Dodawanie warstwy bąbelkowej do mapy (zestaw Android SDK)
W tym artykule przedstawiono sposób renderowania danych punktów ze źródła danych jako warstwy bąbelkowej na mapie. Warstwy bąbelków renderuje punkty jako okręgi na mapie z stałym promieńem pikseli.
Uwaga
Wycofanie zestawu SDK systemu Android w usłudze Azure Maps
Zestaw SDK natywny usługi Azure Maps dla systemu Android jest teraz przestarzały i zostanie wycofany w dniu 3/31/25. Aby uniknąć przerw w działaniu usługi, przeprowadź migrację do zestawu Web SDK usługi Azure Maps przez 3/31/25. Aby uzyskać więcej informacji, zobacz Przewodnik migracji zestawu SDK systemu Android usługi Azure Maps.
Napiwek
Warstwy bąbelków domyślnie renderują współrzędne wszystkich geometrii w źródle danych. Aby ograniczyć warstwę tak, aby renderowana była tylko cechy geometrii punktów, ustaw filter opcję warstwy na eq(geometryType(), "Point"). Jeśli chcesz również uwzględnić funkcje MultiPoint, ustaw filter opcję warstwy na any(eq(geometryType(), "Point"), eq(geometryType(), "MultiPoint")).
Wymagania wstępne
Wykonaj kroki opisane w artykule Szybki start: tworzenie aplikacji dla systemu Android. Bloki kodu w tym artykule można wstawić do programu obsługi zdarzeń map onReady .
Dodawanie warstwy bąbelkowej
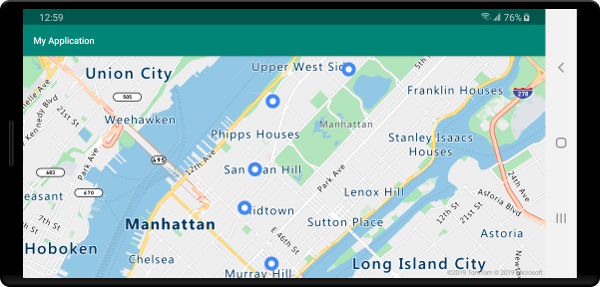
Poniższy kod ładuje tablicę punktów do źródła danych. Następnie łączy punkty danych z warstwą bąbelkową. Warstwa bąbelka renderuje promień każdego bąbelka z pięcioma pikselami i kolorem wypełnienia białym. Kolor pociągnięcia niebieskiego i szerokość pociągnięcia o długości sześciu pikseli.
//Create a data source and add it to the map.
DataSource source = new DataSource();
map.sources.add(source);

//Create point locations.
Point[] points = new Point[] {
    Point.fromLngLat(-73.985708, 40.75773),
    Point.fromLngLat(-73.985600, 40.76542),
    Point.fromLngLat(-73.985550, 40.77900),
    Point.fromLngLat(-73.975550, 40.74859),
    Point.fromLngLat(-73.968900, 40.78859)
};

//Add multiple points to the data source.
source.add(points);

//Create a bubble layer to render the filled in area of the circle, and add it to the map.
BubbleLayer layer = new BubbleLayer(source,
    bubbleRadius(5f),
    bubbleColor("white"),
    bubbleStrokeColor("#4288f7"),
    bubbleStrokeWidth(6f)
);

map.layers.add(layer);
//Create a data source and add it to the map.
val source = DataSource()
map.sources.add(source)

//Create point locations.
val points: Array<Point> = arrayOf<Point>(
    Point.fromLngLat(-73.985708, 40.75773),
    Point.fromLngLat(-73.985600, 40.76542),
    Point.fromLngLat(-73.985550, 40.77900),
    Point.fromLngLat(-73.975550, 40.74859),
    Point.fromLngLat(-73.968900, 40.78859)
)

//Add multiple points to the data source.
source.add(points)

//Create a bubble layer to render the filled in area of the circle, and add it to the map.
val layer = BubbleLayer(
    source,
    bubbleRadius(5f),
    bubbleColor("white"),
    bubbleStrokeColor("#4288f7"),
    bubbleStrokeWidth(6f)
)

map.layers.add(layer)
Poniższy zrzut ekranu przedstawia powyższy kod renderuje punkty w warstwie bąbelkowej.

Pokazywanie etykiet z warstwą bąbelka
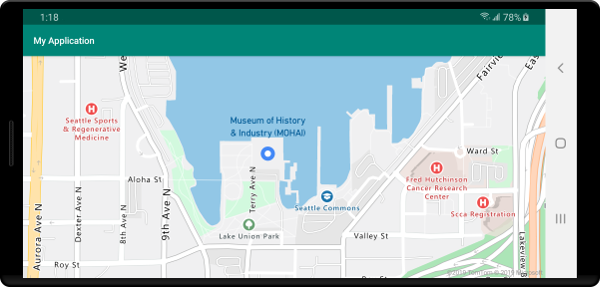
Ten kod pokazuje, jak używać warstwy bąbelkowej do renderowania punktu na mapie. I jak używać warstwy symboli do renderowania etykiety. Aby ukryć ikonę warstwy symboli, ustaw iconImage opcję na "none".
//Create a data source and add it to the map.
DataSource source = new DataSource();
map.sources.add(source);

//Add a data point to the map.
source.add(Point.fromLngLat(-122.336641,47.627631));

//Add a bubble layer.
map.layers.add(new BubbleLayer(source,
    bubbleRadius(5f),
    bubbleColor("white"),
    bubbleStrokeColor("#4288f7"),
    bubbleStrokeWidth(6f)
));

//Add a symbol layer to display text, hide the icon image.
map.layers.add(new SymbolLayer(source,
    //Hide the icon image.
    iconImage("none"),
    textField("Museum of History & Industry (MOHAI)"),
    textColor("#005995"),
    textOffset(new Float[]{0f, -2.2f})
));
//Create a data source and add it to the map.
val source = DataSource()
map.sources.add(source)

//Add a data point to the map.
source.add(Point.fromLngLat(-122.336641, 47.627631))

//Add a bubble layer.
map.layers.add(
    BubbleLayer(
        source,
        bubbleRadius(5f),
        bubbleColor("white"),
        bubbleStrokeColor("#4288f7"),
        bubbleStrokeWidth(6f)
    )
)

//Add a symbol layer to display text, hide the icon image.
map.layers.add(
    SymbolLayer(
        source,  //Hide the icon image.
        iconImage("none"),
        textField("Museum of History & Industry (MOHAI)"),
        textColor("#005995"),
        textOffset(arrayOf(0f, -2.2f))
    )
)
Poniższy zrzut ekranu przedstawia powyższy kod renderujący punkt w warstwie bąbelkowej i etykietę tekstową punktu z warstwą symboli.

Następne kroki
Więcej przykładów kodu do dodania do map można znaleźć w następujących artykułach: