iOS SDK의 지도에 거품형 계층 추가(미리 보기)
이 문서에서는 맵에 거품형 계층으로 데이터 원본에서 지점 데이터를 렌더링할 수 있는 방법을 보여줍니다. 거품형 계층은 고정된 지점 반경을 사용하여 지점을 맵에 원형으로 렌더링합니다.
참고 항목
Azure Maps iOS SDK 사용 중지
이제 iOS용 Azure Maps 네이티브 SDK는 더 이상 사용되지 않으며 2025년 3월 31일에 사용 중지됩니다. 서비스 중단을 방지하려면 2025년 3월 31일까지 Azure Maps 웹 SDK로 마이그레이션하세요. 자세한 내용은 Azure Maps iOS SDK 마이그레이션 가이드를 참조하세요.
팁
기본적으로 거품형 계층은 데이터 원본에 있는 모든 도형의 좌표를 렌더링합니다. 계층이 점 기하 도형 기능만 렌더링하도록 제한하려면 계층의 filter 옵션을 NSPredicate(format: "%@ == \"Point\"", NSExpression.geometryTypeAZMVariable)로 설정합니다. MultiPoint 기능도 포함하려면 NSCompoundPredicate을(를) 사용합니다.
필수 조건
빠른 시작: iOS 앱 문서 만들기의 단계를 완료해야 합니다. 이 문서의 코드 블록은 ViewController의 viewDidLoad 함수에 삽입할 수 있습니다.
거품 계층 추가
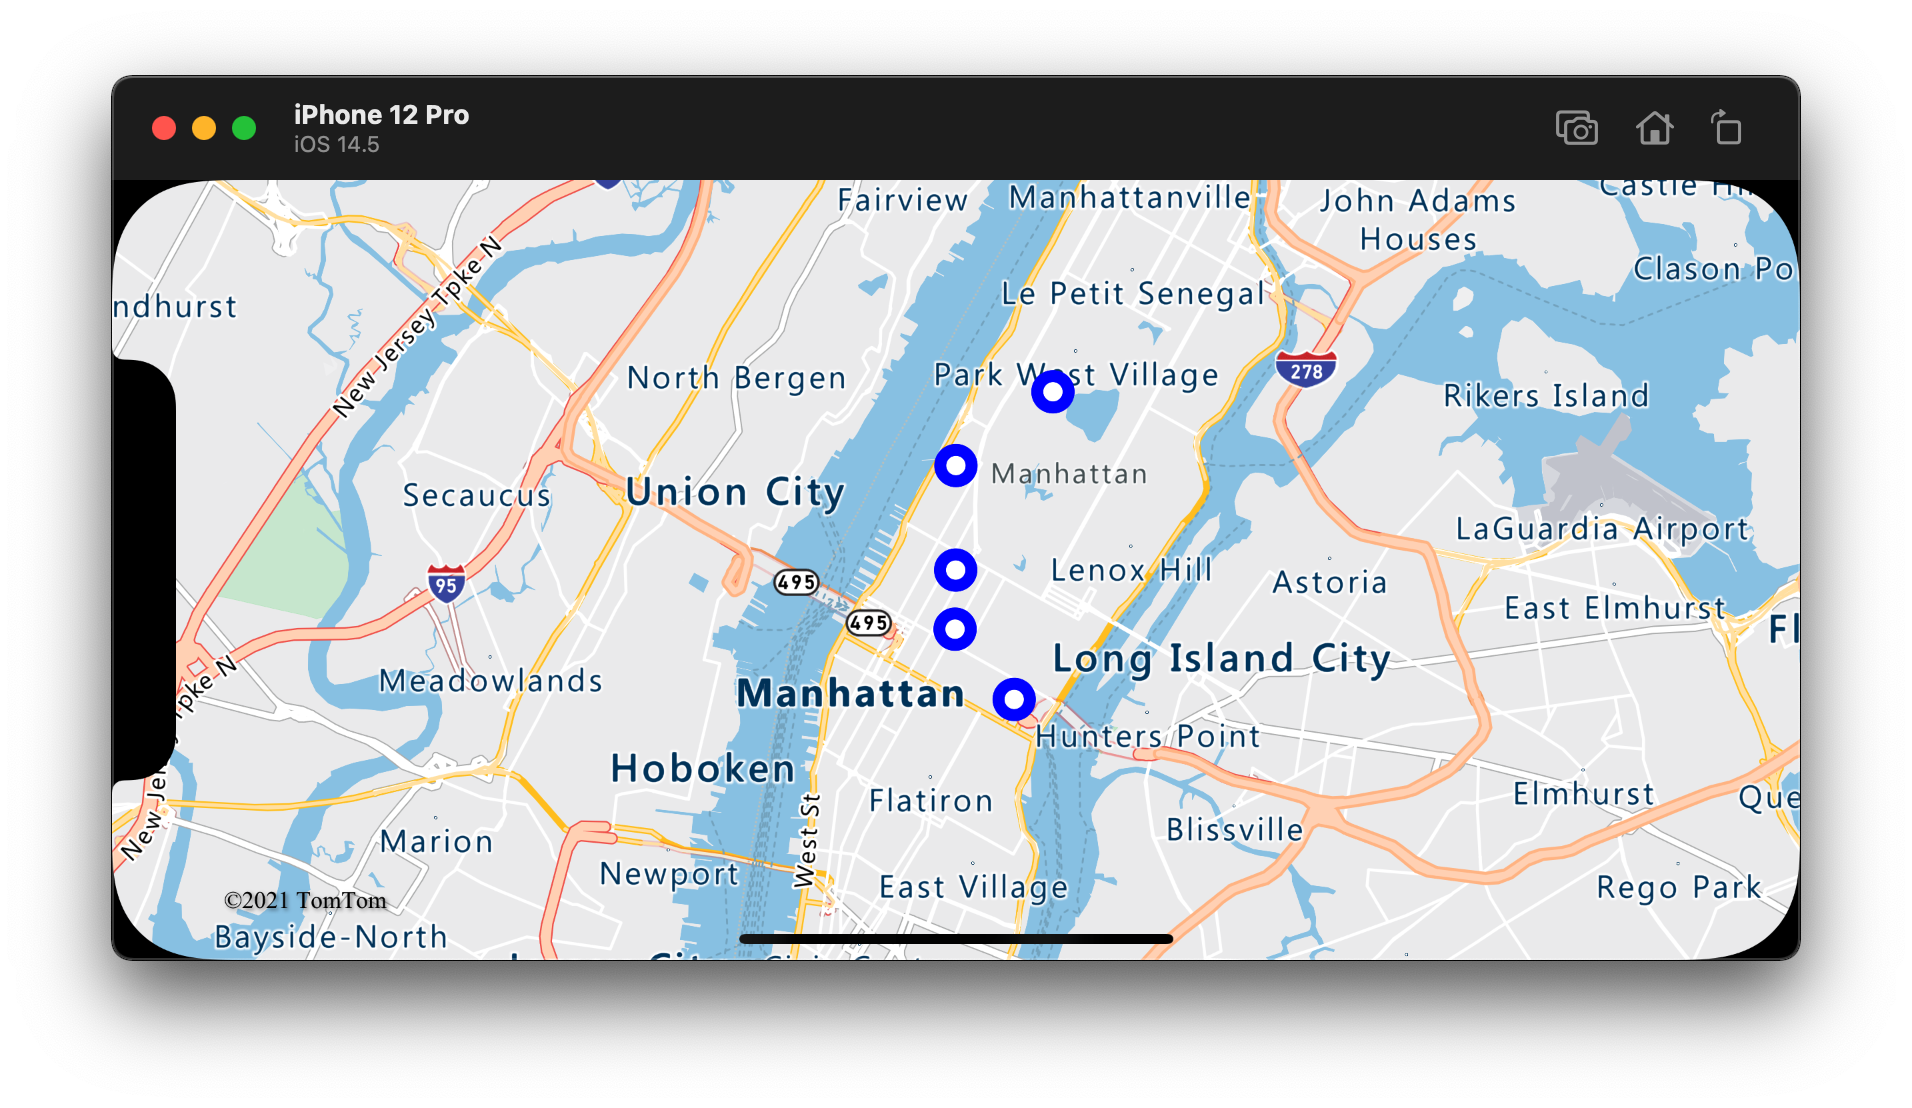
다음 코드는 지점 배열을 데이터 원본에 로드합니다. 그러면 데이터 요소가 거품형 계층에 연결됩니다. 거품형 계층은 5지점과 채우기 색이 흰색인 각 거품의 반경을 렌더링합니다. 그리고 파란색 스트로크 색과 6지점의 스트로크 너비입니다.
// Create a data source and add it to the map.
let source = DataSource()
map.sources.add(source)

// Create point locations.
let points = [
    Point(CLLocationCoordinate2D(latitude: 40.75773, longitude: -73.985708)),
    Point(CLLocationCoordinate2D(latitude: 40.76542, longitude: -73.985600)),
    Point(CLLocationCoordinate2D(latitude: 40.77900, longitude: -73.985550)),
    Point(CLLocationCoordinate2D(latitude: 40.74859, longitude: -73.975550)),
    Point(CLLocationCoordinate2D(latitude: 40.78859, longitude: -73.968900))
]

// Add multiple points to the data source.
source.add(geometries: points)

// Create a bubble layer to render the filled in area of the circle, and add it to the map.
let layer = BubbleLayer(source: source, options: [
    .bubbleRadius(5),
    .bubbleColor(.white),
    .bubbleStrokeColor(.blue),
    .bubbleStrokeWidth(6)
])
map.layers.addLayer(layer)
다음 스크린샷에서는 위 코드가 거품형 계층에서 점을 렌더링하는 것을 보여 줍니다.
거품형 계층을 사용하여 레이블 표시
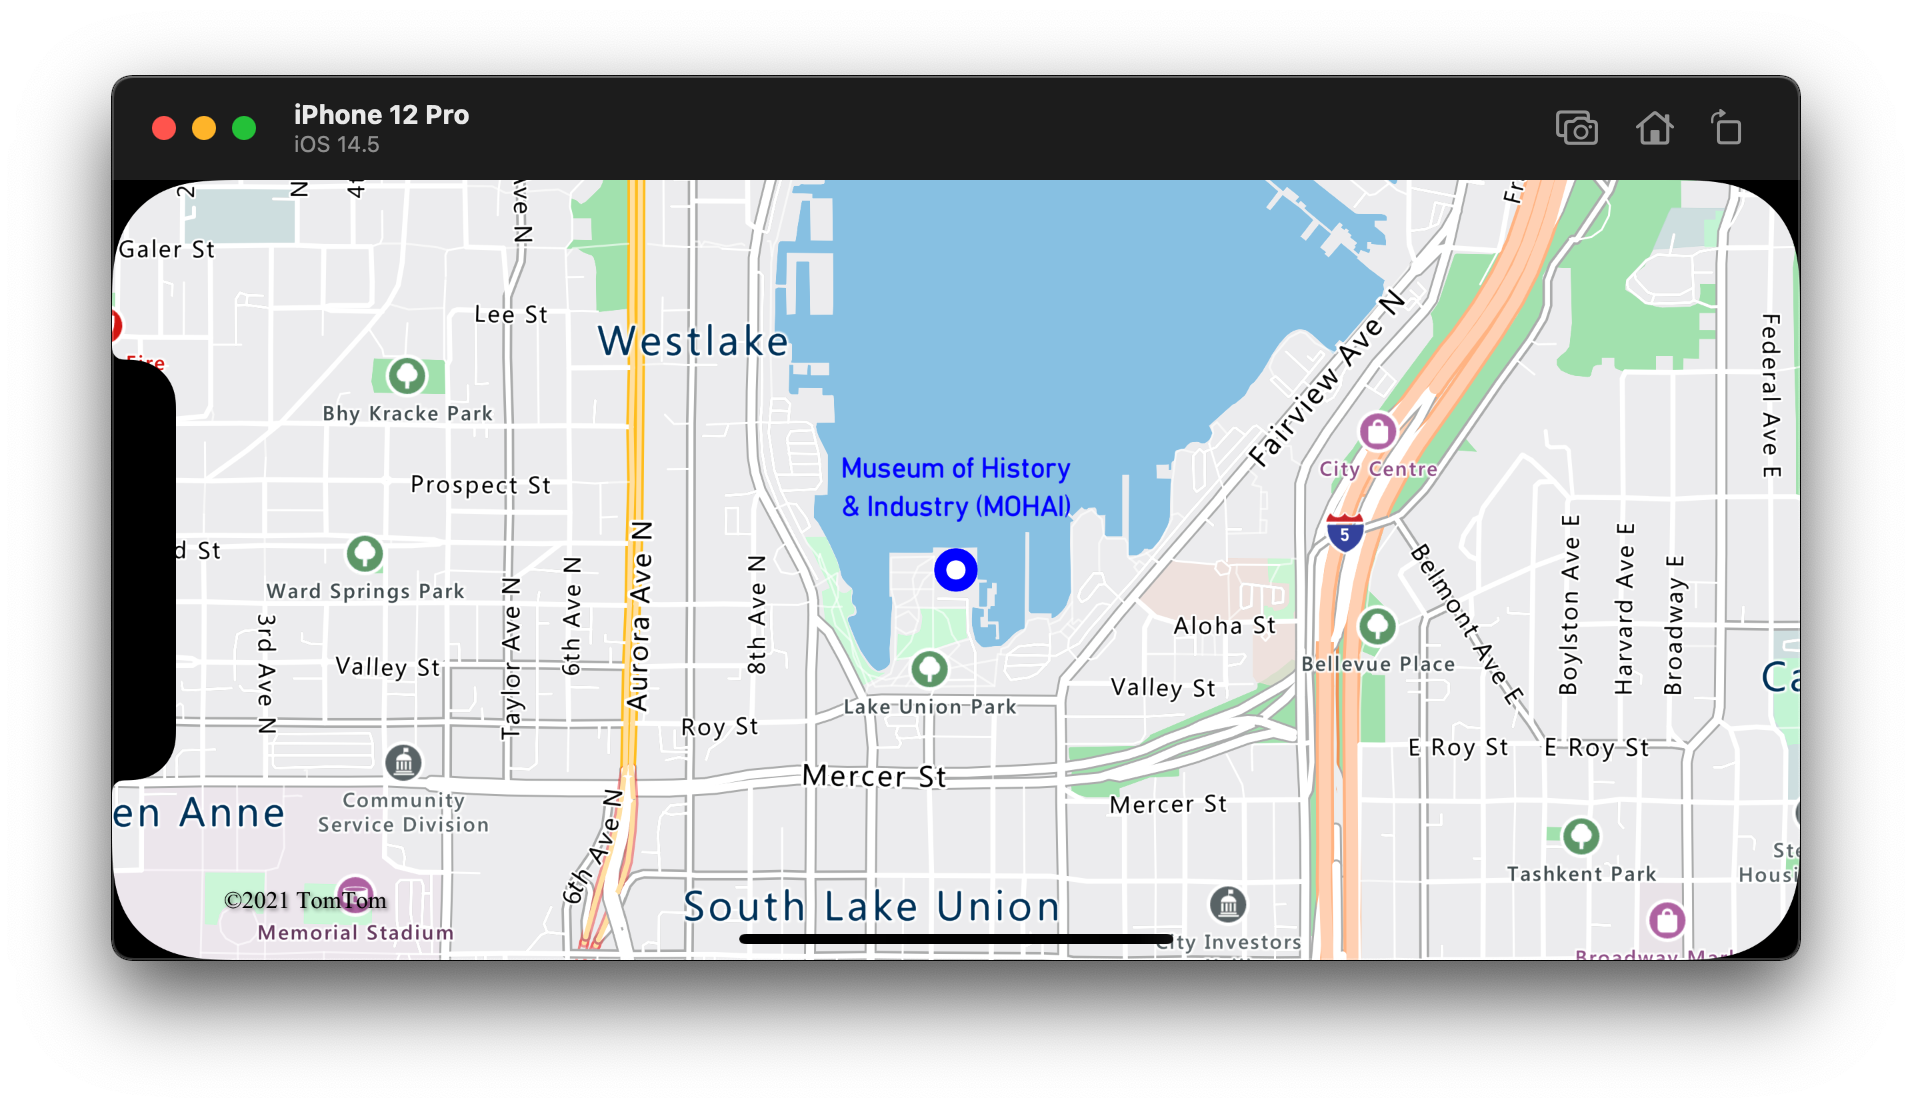
이 코드는 거품형 계층을 사용하여 맵에 지점을 렌더링하는 방법을 보여줍니다. 기호 계층을 사용하여 레이블을 렌더링하는 방법도 있습니다. 기호 계층의 아이콘을 숨기려면 iconImage 옵션을 nil으로 설정합니다.
// Create a data source and add it to the map.
let source = DataSource()
map.sources.add(source)

// Add a data point to the map.
source.add(geometry: Point(CLLocationCoordinate2D(latitude: 47.627631, longitude: -122.336641)))

// Add a bubble layer.
map.layers.addLayer(
    BubbleLayer(source: source, options: [
        .bubbleRadius(5),
        .bubbleColor(.white),
        .bubbleStrokeColor(.blue),
        .bubbleStrokeWidth(6)
    ])
)

// Add a symbol layer to display text, hide the icon image.
map.layers.addLayer(
    SymbolLayer(source: source, options: [
        .iconImage(nil),
        .textField("Museum of History & Industry (MOHAI)"),
        .textColor(.blue),
        .textOffset(CGVector(dx: 0, dy: -2.2))
    ])
)
다음 스크린샷에서는 거품형 계층에서 점을 렌더링하고 기호 계층을 사용하여 점의 텍스트 레이블을 렌더링하는 위 코드를 보여 줍니다.
추가 정보
맵에 추가할 더 많은 코드 예제를 보려면 다음 문서를 참조하세요.