iOS SDK의 맵에 다각형 돌출 계층 추가(미리 보기)
이 문서에서는 다각형 입체 계층을 사용하여 Polygon 및 MultiPolygon 기능 기하 도형을 입체 도형으로 렌더링하는 방법을 보여 줍니다.
참고 항목
Azure Maps iOS SDK 사용 중지
이제 iOS용 Azure Maps 네이티브 SDK는 더 이상 사용되지 않으며 2025년 3월 31일에 사용 중지됩니다. 서비스 중단을 방지하려면 2025년 3월 31일까지 Azure Maps 웹 SDK로 마이그레이션하세요. 자세한 내용은 Azure Maps iOS SDK 마이그레이션 가이드를 참조하세요.
다각형 입체 계층 사용
다각형 입체 계층을 데이터 원본에 연결합니다. 그런 다음 맵에 로드합니다. 다각형 입체 계층은 Polygon 및 MultiPolygon 기능의 영역을 입체 도형으로 렌더링합니다. 다각형 입체 계층의 height 및 base 속성은 미터 단위로 지면에서 입체 도형까지의 기본 거리를 정의합니다. 다음 코드에서는 다각형을 만들어 데이터 원본에 추가하고 다각형 입체 계층 클래스를 사용하여 렌더링하는 방법을 보여 줍니다.
// Create a data source and add it to the map.
let source = DataSource()
map.sources.add(source)

// Create a rectangular polygon.
source.add(geometry: Polygon([
    CLLocationCoordinate2D(latitude: 40.800279, longitude: -73.958383),
    CLLocationCoordinate2D(latitude: 40.768459, longitude: -73.981547),
    CLLocationCoordinate2D(latitude: 40.767761, longitude: -73.981246),
    CLLocationCoordinate2D(latitude: 40.764616, longitude: -73.973618),
    CLLocationCoordinate2D(latitude: 40.765128, longitude: -73.973060),
    CLLocationCoordinate2D(latitude: 40.764908, longitude: -73.972599),
    CLLocationCoordinate2D(latitude: 40.796584, longitude: -73.949446),
    CLLocationCoordinate2D(latitude: 40.797088, longitude: -73.949661),
    CLLocationCoordinate2D(latitude: 40.800523, longitude: -73.957815),
    CLLocationCoordinate2D(latitude: 40.800279, longitude: -73.958383)
]))

// Create and add a polygon extrusion layer to the map below the labels so that they are still readable.
map.layers.insertLayer(
    PolygonExtrusionLayer(source: source, options: [
        .fillColor(.red),
        .fillOpacity(0.7),
        .height(500)
    ]),
    below: "labels"
)
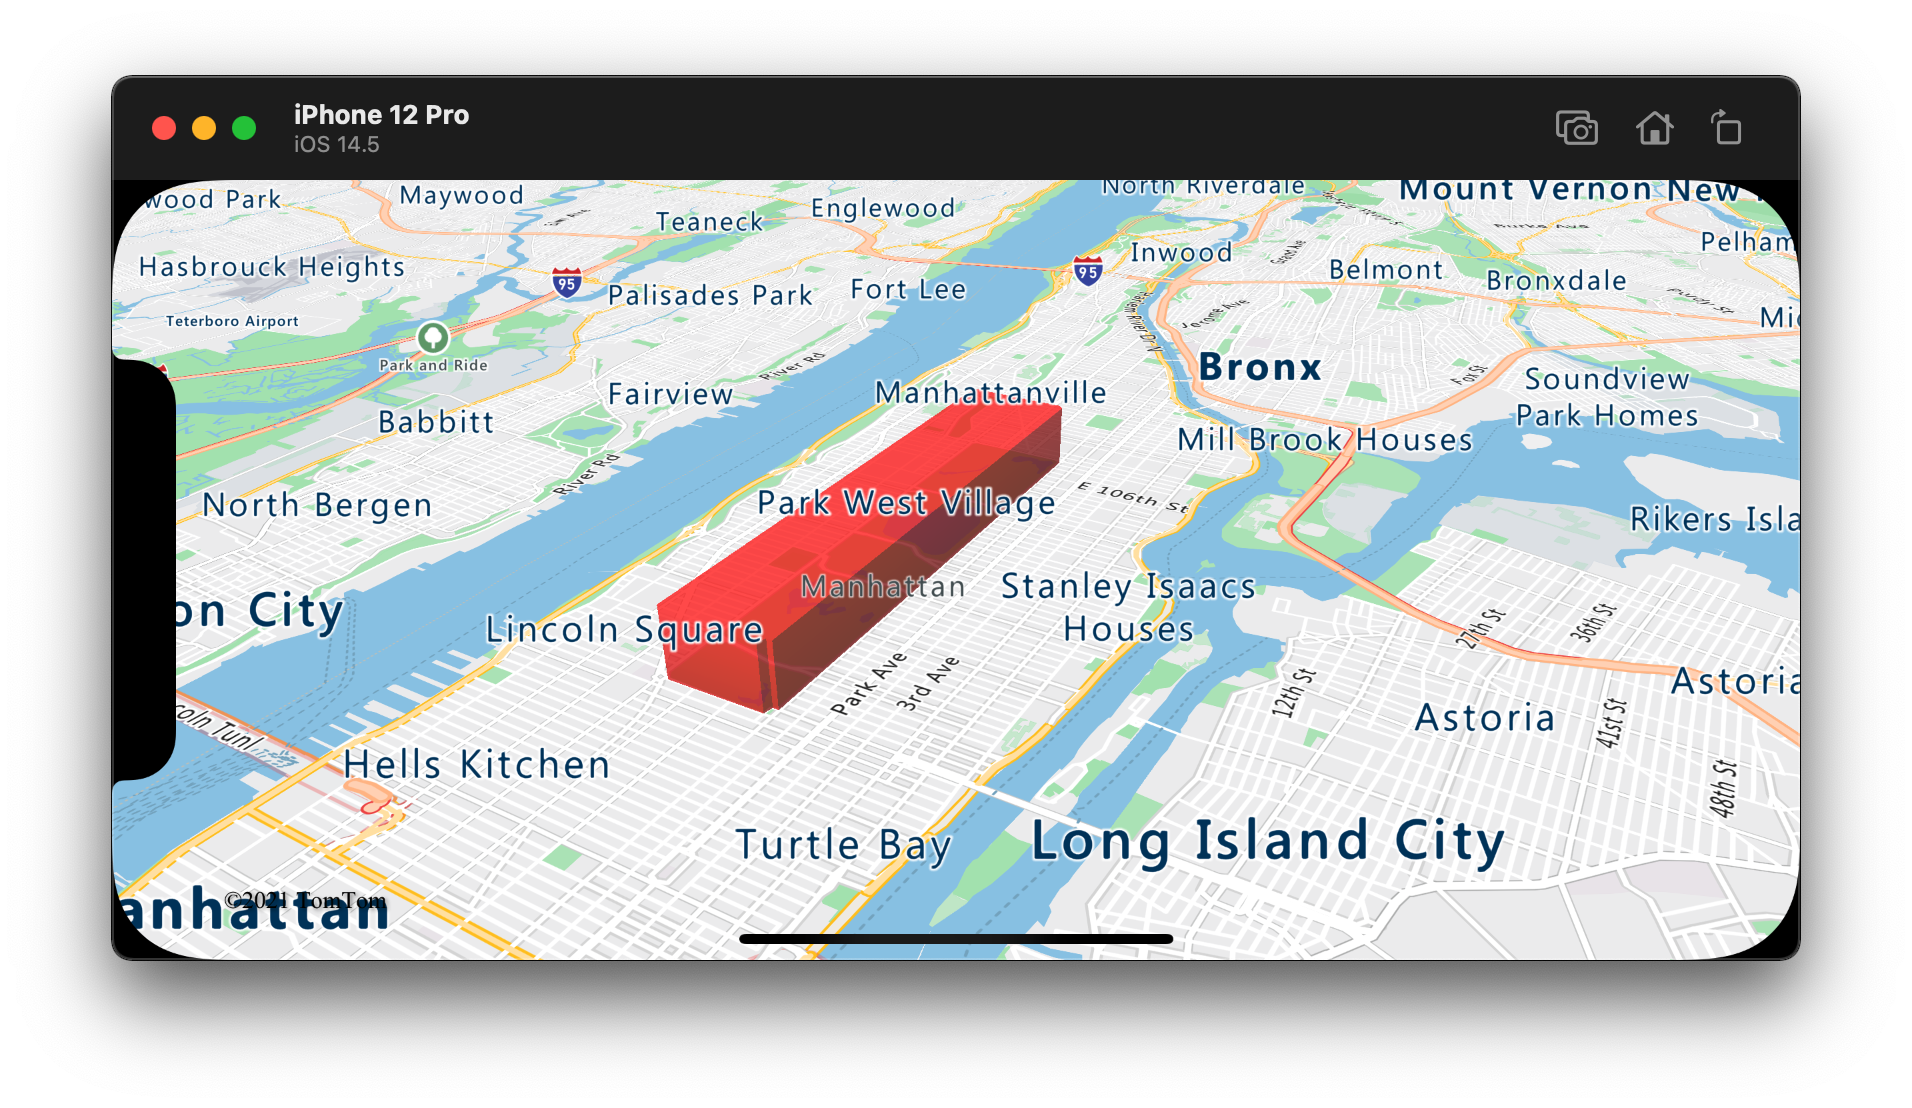
다음 스크린샷에서는 다각형 입체 계층을 사용하여 세로로 확장된 다각형을 렌더링하는 위의 코드를 보여 줍니다.
데이터 중심 다각형 추가
다각형 입체 계층을 사용하여 단계구분도 지도를 렌더링할 수 있습니다. 입체 계층의 height 및 fillColor 속성을 Polygon 및 MultiPolygon 기능 기하 도형의 통계 변수 측정값으로 설정합니다. 다음 코드 샘플은 상태별 인구 밀도의 측정값을 기반으로 하는 미국의 입체 단계구분도 지도를 보여 줍니다.
// Create a data source and add it to the map.
let source = DataSource()

// Import the geojson data and add it to the data source.
source.importData(fromURL: Bundle.main.url(forResource: "US_States_Population_Density", withExtension: "json")!)

map.sources.add(source)

// Create and add a polygon extrusion layer to the map below the labels so that they are still readable.
let densityColorSteps: [Int: UIColor] = [
    0: UIColor(red: 0, green: 1, blue: 0.5, alpha: 1),
    10: UIColor(red: 9 / 255, green: 224 / 255, blue: 118 / 255, alpha: 1),
    20: UIColor(red: 11 / 255, green: 191 / 255, blue: 103 / 255, alpha: 1),
    50: UIColor(red: 247 / 255, green: 227 / 255, blue: 5 / 255, alpha: 1),
    100: UIColor(red: 247 / 255, green: 199 / 255, blue: 7 / 255, alpha: 1),
    200: UIColor(red: 247 / 255, green: 130 / 255, blue: 5 / 255, alpha: 1),
    500: UIColor(red: 247 / 255, green: 94 / 255, blue: 5 / 255, alpha: 1),
    1000: UIColor(red: 247 / 255, green: 37 / 255, blue: 5 / 255, alpha: 1)
]
let colorExpression = NSExpression(
    forAZMStepping: NSExpression(forKeyPath: "density"),
    from: NSExpression(forConstantValue: UIColor(red: 0, green: 1, blue: 0.5, alpha: 1)),
    stops: NSExpression(forConstantValue: densityColorSteps)
)

let densityHeightSteps: [Int: Int] = [
    0: 100,
    1200: 960_000
]
let heightExpression = NSExpression(
    forAZMInterpolating: NSExpression(forKeyPath: "density"),
    curveType: .linear,
    parameters: nil,
    stops: NSExpression(forConstantValue: densityHeightSteps)
)

map.layers.insertLayer(
    PolygonExtrusionLayer(source: source, options: [
        .fillOpacity(0.7),
        .fillColor(from: colorExpression),
        .height(from: heightExpression)
    ]),
    below: "labels"
)
다음 스크린샷에서는 인구 밀도를 기준으로 입체 다각형으로 색이 지정되고 세로로 확장된 미국 단계구분도 지도를 보여 줍니다.

추가 정보
맵에 추가할 더 많은 코드 예제를 보려면 다음 문서를 참조하세요.