Real-Time インテリジェンスチュートリアル パート 4: KQL を使用してストリーミング データにクエリを実行する
手記
このチュートリアルはシリーズの一部です。 前のセクションについては、「Real-Time Intelligence チュートリアル パート 3: KQL データベース内のデータを変換する」を参照してください。
チュートリアルのこの部分では、KQL を使用してストリーミング データに対してクエリを実行する方法について説明します。 KQL クエリを記述し、タイム チャートでデータを視覚化します。
KQL クエリを記述する
前の手順で更新ポリシーから作成したテーブルの名前は、TransformedData
ヒント
十分なサブスクリプションがある場合は、Copilot 機能を使用してクエリを記述できます。 Copilot は、テーブル内のデータと自然言語プロンプトに基づくクエリを提供します。 詳細については、Copilot for Real-Time インテリジェンス (プレビュー) を参照してください。
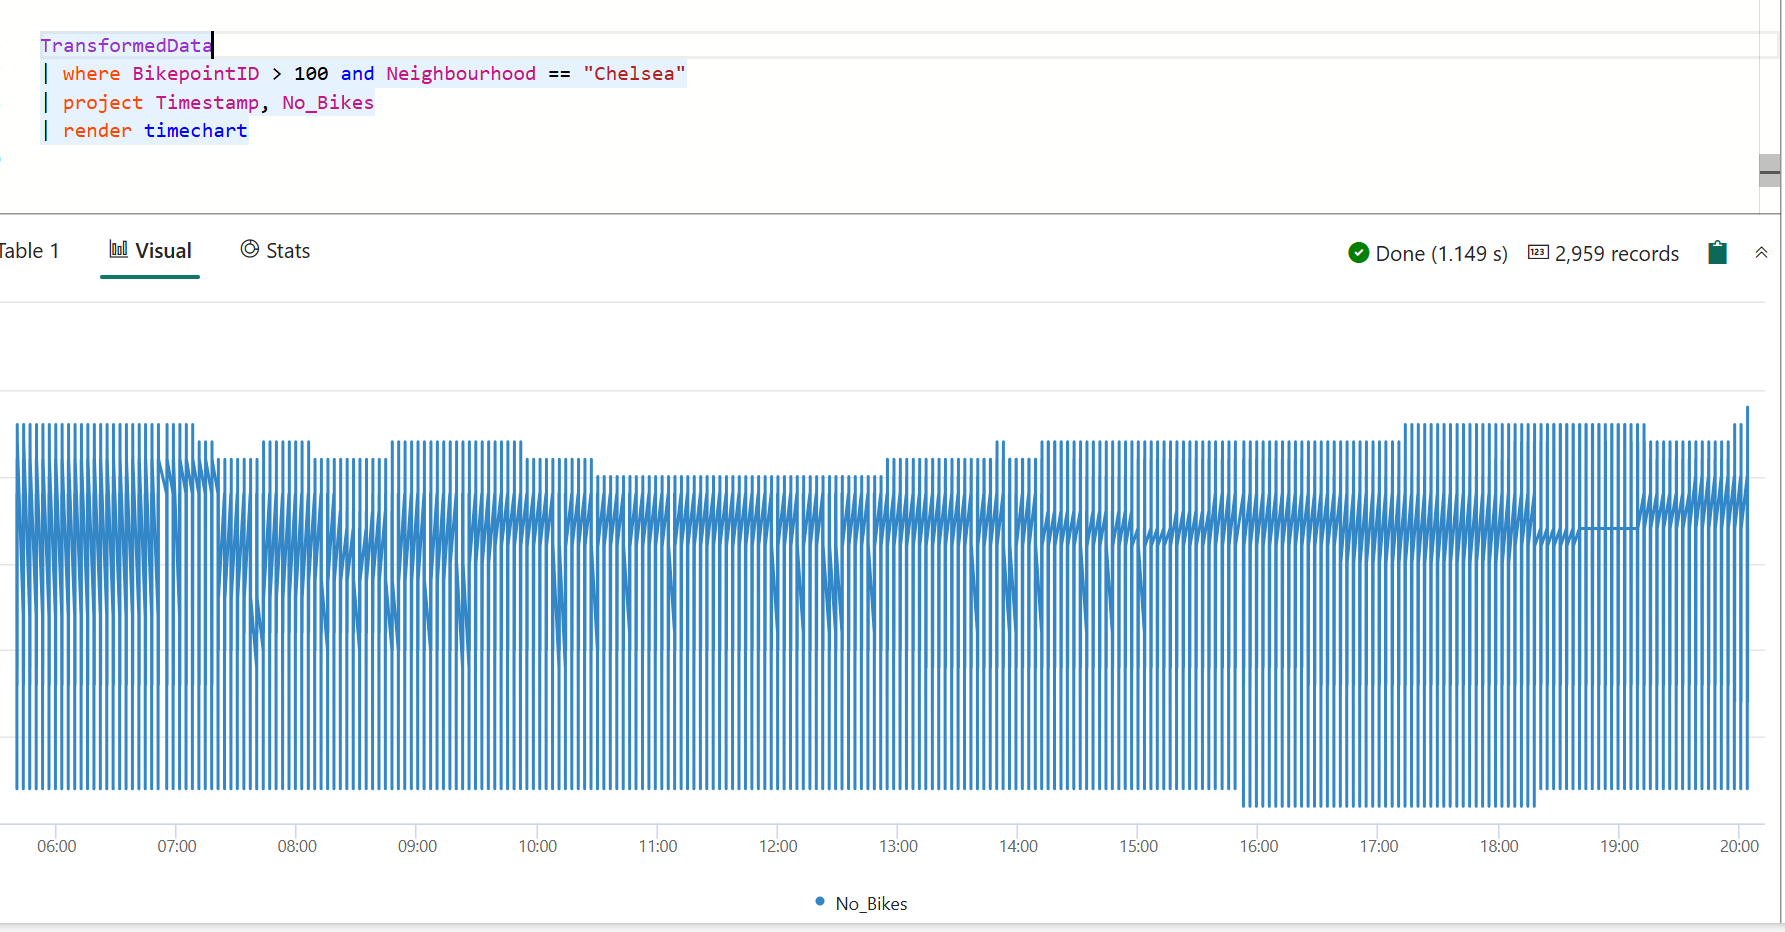
次のクエリを入力します。 次に、Shift キーを押しながら Enter キーを押して クエリを実行します。
TransformedData
| where BikepointID > 100 and Neighbourhood == "Chelsea"
| project Timestamp, No_Bikes
| render timechart
このクエリでは、チェルシー周辺の自転車の数をタイム チャートとして示すタイム チャートが作成されます。
具体化されたビューを作成する
この手順では、集計クエリの up-to-date 結果を返す具体化されたビューを作成します (常に最新)。 具体化されたビューのクエリは、ソース テーブルに対して集計を直接実行するよりもパフォーマンスが高くなります。
次のコマンドをコピーして貼り付けて実行し、各自転車ステーションの最新の自転車数を示す具体化されたビューを作成します。
.create-or-alter materialized-view with (folder="Gold") AggregatedData on table TransformedData
{
   TransformedData
   | summarize arg_max(Timestamp,No_Bikes) by BikepointID
}
次のクエリをコピーして貼り付けて実行し、具体化されたビューのデータを縦棒グラフとして視覚化します。
AggregatedData
| sort by BikepointID
| render columnchart with (ycolumns=No_Bikes,xcolumn=BikepointID)
次の手順でこのクエリを使用して、Real-Time ダッシュボードを作成します。
重要
テーブルの作成、ポリシー、関数、または具体化されたビューの更新に使用する手順を実行できなかった場合は、このスクリプトを使用して、必要なすべてのリソースを作成します。Tutorial コマンド スクリプト。
関連コンテンツ
このチュートリアルで実行されるタスクの詳細については、以下を参照してください。
- クエリ を記述する
- レンダー演算子
- マテリアライズドビューの概要
- 具体化されたビューの作成
