View email security reports in the Microsoft Defender portal
Tip
Did you know you can try the features in Microsoft Defender for Office 365 Plan 2 for free? Use the 90-day Defender for Office 365 trial at the Microsoft Defender portal trials hub. Learn about who can sign up and trial terms on Try Microsoft Defender for Office 365.
In all Microsoft 365 organizations, a variety of reports are available to help you see how email security features are protecting your organization. If you have the necessary permissions, you can view and download these reports as described in this article.
The reports are available in the Microsoft Defender portal at https://security.microsoft.com on the Email & collaboration reports page at Reports > Email & collaboration > Email & collaboration reports. Or, to go directly to the Email & collaboration reports page, use https://security.microsoft.com/emailandcollabreport.
Summary information for each report is available on the page. Identify the report you want to view, and then select View details for that report.
The rest of this article describes the reports that are exclusive to Defender for Office 365.
Note
Some of the reports on the Email & collaboration reports page are exclusive to Microsoft Defender for Office 365. For information about these reports, see View Defender for Office 365 reports in the Microsoft Defender portal.
Reports that are related to mail flow are now in the Exchange admin center. For more information about these reports, see Mail flow reports in the new Exchange admin center.
A link to these reports is available in the Defender portal at Reports > Email & collaboration > Email & collaboration reports > Exchange mail flow reports, which takes you to https://admin.exchange.microsoft.com/#/reports/mailflowreportsmain.
Email security report changes in the Microsoft Defender portal
The Exchange Online Protection (EOP) and Microsoft Defender for Office 365 reports in the Microsoft Defender portal that were replaced, moved, or deprecated are described in the following table.
| Deprecated report and cmdlets | New report and cmdlets | Message Center ID | Date |
|---|---|---|---|
| URL trace Get-URLTrace |
URL protection report Get-SafeLinksAggregateReport Get-SafeLinksDetailReport |
MC239999 | June 2021 |
| Sent and received email report Get-MailTrafficReport Get-MailDetailReport |
Threat protection status report Mailflow status report Get-MailTrafficATPReport Get-MailDetailATPReport Get-MailFlowStatusReport |
MC236025 | June 2021 |
| Forwarding report no cmdlets |
Auto-forwarded messages report in the EAC no cmdlets |
MC250533 | June 2021 |
| Safe Attachments file types report Get-AdvancedThreatProtectionTrafficReport Get-MailDetailMalwareReport |
Threat protection status report: View data by Email > Malware Get-MailTrafficATPReport Get-MailDetailATPReport |
MC250532 | June 2021 |
| Safe Attachments message disposition report Get-AdvancedThreatProtectionTrafficReport Get-MailDetailMalwareReport |
Threat protection status report: View data by Email > Malware Get-MailTrafficATPReport Get-MailDetailATPReport |
MC250531 | June 2021 |
| Malware detected in email report Get-MailTrafficReport Get-MailDetailMalwareReport |
Threat protection status report: View data by Email > Malware Get-MailTrafficATPReport Get-MailDetailATPReport |
MC250530 | June 2021 |
| Spam detection report Get-MailTrafficReport Get-MailDetailSpamReport |
Threat protection status report: View data by Email > Spam Get-MailTrafficATPReport Get-MailDetailATPReport |
MC250529 | October 2021 |
| Get-AdvancedThreatProtectionDocumentReport Get-AdvancedThreatProtectionDocumentDetail |
Get-ContentMalwareMdoAggregateReport Get-ContentMalwareMdoDetailReport |
MC343433 | May 2022 |
| Exchange transport rule report Get-MailTrafficPolicyReport Get-MailDetailTransportRuleReport |
Exchange transport rule report in the EAC Get-MailTrafficPolicyReport Get-MailDetailTransportRuleReport |
MC316157 | April 2022 |
| Get-MailTrafficTopReport | Top senders and recipient report Get-MailTrafficSummaryReport Note: There's no replacement for the encryption reporting capabilities in Get-MailTrafficTopReport. |
MC315742 | April 2022 |
Compromised users report
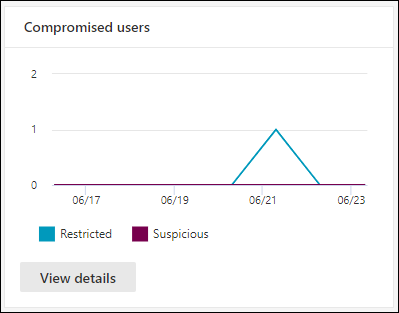
The Compromised users report shows the number of user accounts marked as Suspicious or Restricted within the last 7 days. Accounts in either of these states are problematic or even compromised. With frequent use, you can use the report to spot spikes, and even trends, in suspicious or restricted accounts. For more information about compromised users, see Responding to a compromised email account.
The aggregate view shows data for the last 90 days and the detail view shows data for the last 30 days.
On the Email & collaboration reports page at https://security.microsoft.com/emailandcollabreport, find Compromised users, and then select View details. Or, to go directly to the report, use https://security.microsoft.com/reports/CompromisedUsers.
On the Compromised users page, the chart shows the following information for the specified date range:
- Restricted: The user account was restricted from sending email due to highly suspicious patterns.
- Suspicious: The user account sent suspicious email and is at risk of being restricted from sending email.
The details table below the graph shows the following information:
- Creation time
- User ID
- Action
- Tags: For more information about user tags, see User tags.
Select ![]() Filter to modify the report and the details table by selecting one or more of the following values in the flyout that opens:
Filter to modify the report and the details table by selecting one or more of the following values in the flyout that opens:
- Date (UTC): Start date and End date.
- Activity: Restricted or Suspicious
- Tag: Leave the value All or remove it, double-click in the empty box, and then select Priority account. For more information about user tags, see User tags.
When you're finished configuring the filters, select Apply, Cancel, or ![]() Clear filters.
Clear filters.
On the Compromised users page, the ![]() Create schedule,
Create schedule, ![]() Request report, and
Request report, and ![]() Export actions are available.
Export actions are available.
Exchange transport rule report
Note
The Exchange transport rule report is now available in the EAC. For more information, see Exchange transport rule report in the new EAC.
Forwarding report
Note
This report is now available in the EAC. For more information, see Auto forwarded messages report in the new EAC.
Mailflow status report
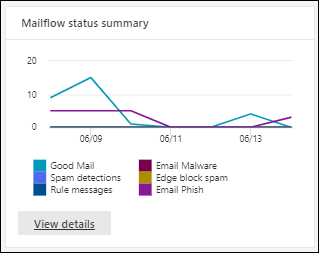
The Mailflow status report is a smart report that shows information about incoming and outgoing email, spam detections, malware, email identified as "good", and information about email allowed or blocked on the edge. This is the only report that contains edge protection information. The report shows how much email is blocked before entering the service for examination by Exchange Online Protection (EOP) or Defender for Microsoft 365.
Tip
If a message is sent to five recipients, we count it as five different messages, not one message.
The Mailflow status report shows the primary threat responsible for blocking or quarantining messages. Threat Explorer or Real-time detections and Advanced hunting in Defender for Office 365 Plan 2 show primary and secondary threats responsible for blocking or quarantining messages. The increased message counts in these other reporting features aren't caused by a mismatch or counting the same item multiple times. The increased message counts are the result of showing all detected threats involved at the same time.
The aggregate message count in the Mailflow status report could also be more than the message count in Threat Explorer or Real-time detections due to zero-hour autopurge (ZAP) activity. ZAP removes messages from mailboxes after delivery, so ZAP activity doesn't affect message counts in the Mailflow status report. ZAP activity does affect message counts in Threat Explorer or Real-time detections. In Defender for Office 365, use the Post-delivery activities report to understand the lifecycle of ZAP on messages in the organization.
On the Email & collaboration reports page at https://security.microsoft.com/emailandcollabreport, find Mailflow status summary, and then select View details. Or, to go directly to the report, use https://security.microsoft.com/reports/mailflowStatusReport.
The available views in the Mailflow status report are described in the following subsections.
Type view for the Mailflow status report
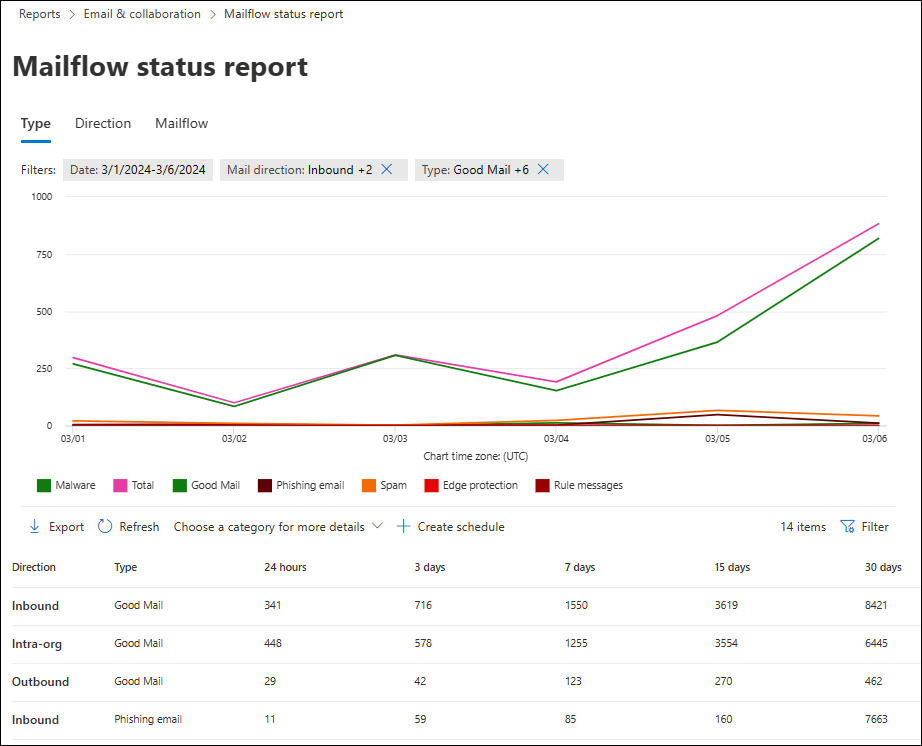
On the Mailflow status report page, the Type tab is selected by default. The chart shows the following information for the specified date range:
- Malware: Email blocked as malware by various filters.
- Total
- Good mail: Email determined not to be spam or allowed by user or organizational policies.
- Phishing email: Email blocked as phishing by various filters.
- Spam: Email blocked as spam by various filters.
- Edge protection: Email rejected at the edge/perimeter before examination by EOP or Defender for Office 365.
- Rule messages: Email quarantined by mail flow rules (also known as transport rules).
- Data loss prevention: Email quarantined by data loss prevention (DLP) policies.
The details table below the graph shows the following information:
- Direction
- Type
- 24 hours
- 3 days
- 7 days
- 15 days
- 30 days
Select ![]() Filter to modify the report and the details table by selecting one or more of the following values in the flyout that opens:
Filter to modify the report and the details table by selecting one or more of the following values in the flyout that opens:
- Date (UTC): Start date and End date.
- Mail direction: Select Inbound, Outbound, and Intra-org.
- Type: Select one or more of the following values:
- Good mail
- Malware
- Spam
- Edge protection
- Rule messages
- Phishing email
- Data loss prevention
- Domain: Select All or an accepted domain.
When you're finished configuring the filters, select Apply, Cancel, or ![]() Clear filters.
Clear filters.
On the Type tab, select Choose a category for more details to see more information:
- Phishing email: This selection takes you to View data by Email > Phish and Chart breakdown by Detection Technology in the Threat protection status report.
- Malware in email: This selection takes you to View data by Email > Malware and Chart breakdown by Detection Technology in the Threat protection status report.
- Spam detections: This selection takes you to View data by Email > Spam and Chart breakdown by Detection Technology in the Threat protection status report.
On the Type tab, the ![]() Create schedule and
Create schedule and ![]() Export actions are available.
Export actions are available.
Direction view for the Mailflow status report
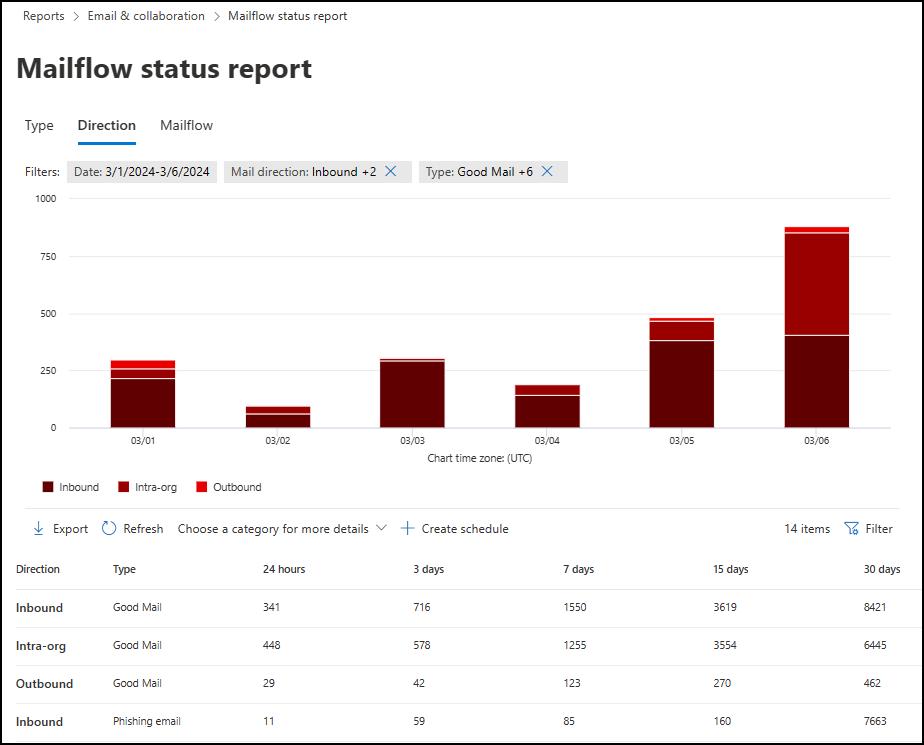
On the Direction tab, the chart shows the following information for the specified date range:
- Inbound
- Intra-org
- Outbound
Select ![]() Filter to modify the report and the details table by selecting one or more of the following values in the flyout that opens:
Filter to modify the report and the details table by selecting one or more of the following values in the flyout that opens:
Date (UTC): Start date and End date.
Note
To see data for a specific date, use the day after. For example, to see January 10 data, use January 11 in the filter. Today's data is available for filtering tomorrow.
Report data for some days is updated continuously, so the longer you wait to run the report, the more stable the message counts and classifications will be. For example, to return comprehensive weekly data from Sunday the 10th to Saturday the 17th, run the report on Friday the 23rd. The same report run on Sunday the 18th or Tuesday the 20th might contain slightly different message counts and classifications.
Mail direction: Select Inbound, Outbound, and Intra-org.
Type: Select one or more of the following values:
- Good mail
- Malware
- Spam
- Edge protection
- Rule messages
- Phishing email
- Data loss prevention: Email quarantined by data loss prevention (DLP) policies.
Domain: Select All or an accepted domain.
When you're finished configuring the filters, select Apply, Cancel, or ![]() Clear filters.
Clear filters.
On the Direction tab, select Choose a category for more details to see more information:
- Phishing email: This selection takes you to View data by Email > Phish and Chart breakdown by Detection Technology in the Threat protection status report.
- Malware in email: This selection takes you to View data by Email > Malware and Chart breakdown by Detection Technology in the Threat protection status report.
- Spam detections: This selection takes you to View data by Email > Spam and Chart breakdown by Detection Technology in the Threat protection status report.
On the Direction tab, the ![]() Create schedule and
Create schedule and ![]() Export actions are available.
Export actions are available.
Mailflow view for the Mailflow status report
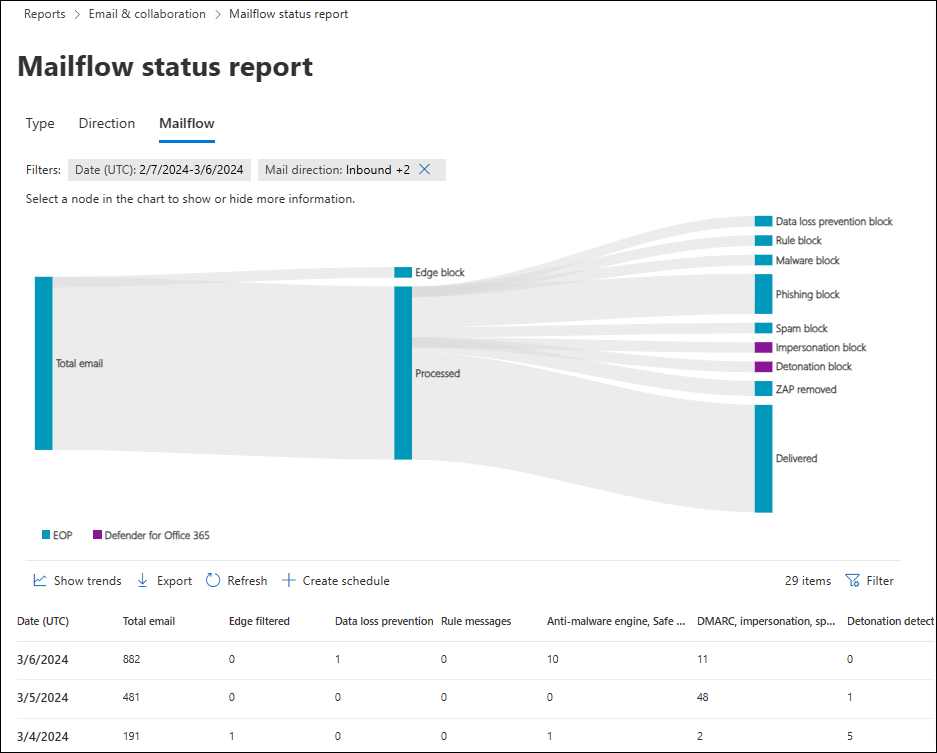
The Mailflow tab shows you how Microsoft's email threat protection features filter incoming and outgoing email in your organization. This view uses a horizontal flow diagram (known as a Sankey diagram) to provide details on the total email count, and how threat protection features affect this count.
The aggregate view and details table view allow for 90 days of filtering.
The information in the diagram is color-coded by EOP and Defender for Office 365 technologies.
The diagram is organized into the following horizontal bands:
- Total email band: This value is always shown first.
- Edge block and Processed band:
- Edge block: Messages filtered at the edge and identified as Edge Protection.
- Processed: Messages handled by the filtering stack.
- Outcomes band:
- Data loss prevention block
- Rule Block: Messages quarantined by Exchange mail flow rules (transport rules).
- Malware block: Messages identified as malware.*
- Phishing block: Messages identified as phishing.*
- Spam block: Messages identified as spam.*
- Impersonation block: Messages detected as user impersonation or domain impersonation in Defender for Office 365.*
- Detonation block: Messages detected during file or URL detonation by Safe Attachments policies or Safe Links policies in Defender for Office 365.*
- ZAP removed: Messages removed by zero-hour auto purge (ZAP).*
- Delivered: Messages delivered to users due to an allow.*
If you hover over a horizontal band in the diagram, you see the number of related messages.
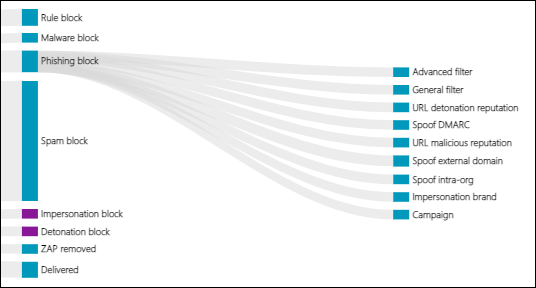
* If you select this element, the diagram expands to show more details. For a description of each element in the expanded nodes, see Detection technologies.
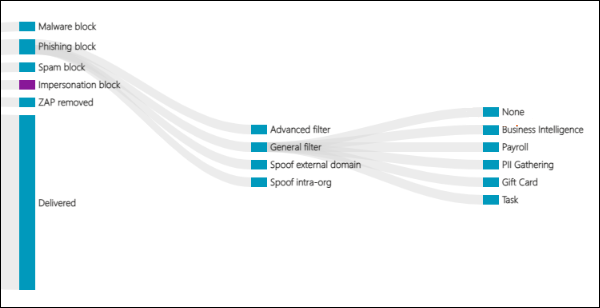
In Defender for Office 365, if you select Phishing block > General filter, threat classification results are shown. For more information, see Threat classification in Microsoft Defender for Office 365.
The details table below the diagram shows the following information:
- Date (UTC)
- Total email
- Edge filtered
- Rule messages
- Anti-malware engine, Safe Attachments, rule filtered
- DMARC impersonation, spoof, phish filtered
- Detonation detection
- Anti-spam filtered
- ZAP removed
- Messages where no threats were detected
Select a row in the details table to see a further breakdown of the email counts in the details flyout that opens.
Select ![]() Filter to modify the report and the details table by selecting one or more of the following values in the flyout that opens:
Filter to modify the report and the details table by selecting one or more of the following values in the flyout that opens:
- Date (UTC) Start date and End date.
- Mail direction: Select Inbound, Outbound, and Intra-org.
- Domain: Select All or an accepted domain.
When you're finished configuring the filters, select Apply, Cancel, or ![]() Clear filters.
Clear filters.
On the Mailflow tab, select ![]() Show trends to see trend graphs in the Mailflow trends flyout that opens.
Show trends to see trend graphs in the Mailflow trends flyout that opens.
On the Mailflow tab, the ![]() Export action is available.
Export action is available.
Malware detections report
Note
This report is deprecated. The same information is available in the Threat protection status report.
Mail latency report
The Mail latency report in Defender for Office 365 contains information on the mail delivery and detonation latency experienced within your organization. For more information, see Mail latency report.
Post-delivery activities report
The Post-delivery activities report is available only in organizations with Microsoft Defender for Office 365 Plan 2. For information about the report, see Post-delivery activities report.
Spam detections report
Note
This report is deprecated. The same information is available in the Threat protection status report.
Spoof detections report
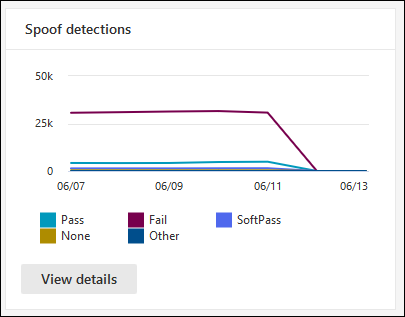
The Spoof detections report shows information about messages blocked or allowed due to spoofing. For more information about spoofing, see Anti-spoofing protection in EOP.
The aggregate and detail views of the report allows for 90 days of filtering.
Note
The latest available data in the report is 3 to 4 days old.
On the Email & collaboration reports page at https://security.microsoft.com/emailandcollabreport, find Spoof detections, and then select View details. Or, to go directly to the report, use https://security.microsoft.com/reports/SpoofMailReport.
The chart shows the following information:
- Pass
- Fail
- SoftPass
- None
- Other
Hover over a day (data point) in the chart to see how many spoofed messages were detected and why.
The details table below the graph shows the following information:
Date
Spoofed user
Sending infrastructure
Spoof type
Result
Result code
SPF
DKIM
DMARC
Message count
To see all columns, you likely need to do one or more of the following steps:
- Horizontally scroll in your web browser.
- Narrow the width of appropriate columns.
- Zoom out in your web browser.
For more information about composite authentication result codes, see Anti-spam message headers in Microsoft 365.
Select ![]() Filter to modify the report and the details table by selecting one or more of the following values in the flyout that opens:
Filter to modify the report and the details table by selecting one or more of the following values in the flyout that opens:
- Date (UTC) Start date and End date
- Result:
- Pass
- Fail
- SoftPass
- None
- Other
- Spoof type: Internal and External
When you're finished configuring the filters, select Apply, Cancel, or ![]() Clear filters.
Clear filters.
On the Spoof mail report page, the ![]() Create schedule,
Create schedule, ![]() Request report, and
Request report, and ![]() Export actions are available.
Export actions are available.
Submissions report
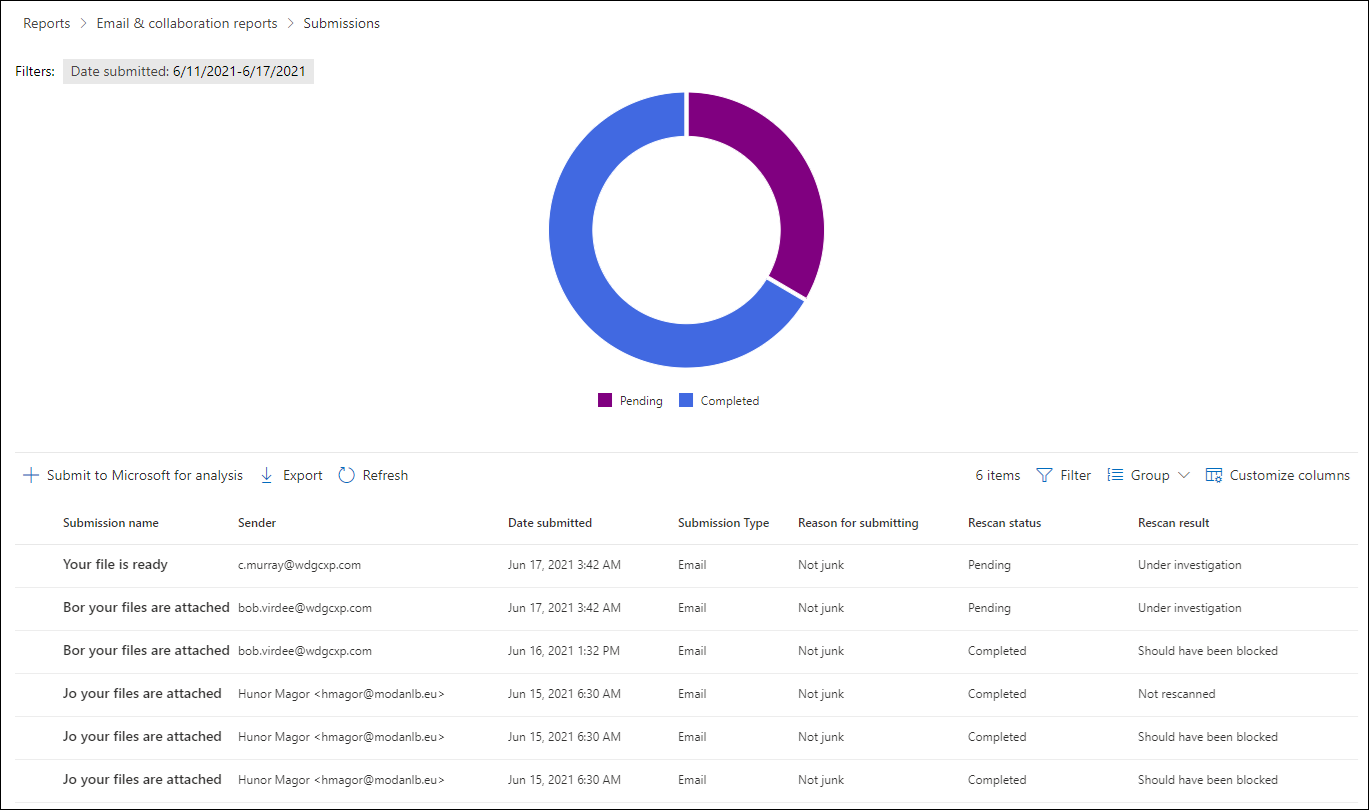
The Submissions report shows information about items that admins reported to Microsoft for analysis for the last 30 days. For more information about admin submissions, see Use Admin Submission to submit suspected spam, phish, URLs, and files to Microsoft.
On the Email & collaboration reports page at https://security.microsoft.com/emailandcollabreport, find Submissions, and then select View details. Or, to go directly to the report, use https://security.microsoft.com/adminSubmissionReport.
To go directly to the Submissions page in the Defender portal, select Go to submissions.
The chart shows the following information:
- Pending
- Completed
The details table below the graph shows the same information and has the same available actions as the Emails tab on the Submissions page at https://security.microsoft.com/reportsubmission?viewid=email:
 Customize columns
 Group
Group Submit to Microsoft for analysis
For more information, see View email admin submissions to Microsoft.
Select ![]() Filter to modify the report and the details table by selecting one or more of the following values in the flyout that opens:
Filter to modify the report and the details table by selecting one or more of the following values in the flyout that opens:
- Date submitted: Start date and End date
- Submission ID
- Network Message ID
- Sender
- Recipient
- Submission name
- Submitted by
- Reason for submitting:
- Not junk
- Appears clean
- Appears suspicious
- Phish
- Malware
- Spam
- Rescan status:
- Pending
- Completed
- Tags: All or one or more user tags.
When you're finished configuring the filters, select Apply, Cancel, or ![]() Clear filters.
Clear filters.
On the Submissions page, the Export action is available.
Threat protection status report
The Threat protection status report is available in both EOP and Defender for Office 365. However, the reports contain different data. For example, EOP customers can view information about malware detected in email, but not information about malicious files detected by Safe Attachments for SharePoint, OneDrive, and Microsoft Teams.
The report provides the count of email messages with malicious content. For example:
- Files or website addresses (URLs) blocked by the anti-malware engine.
- Files or messages affected by zero-hour auto purge (ZAP)
- Files or messages blocked by Defender for Office 365 features: Safe Links, Safe Attachments, and impersonation protection features in anti-phishing policies.
You can use the information in this report to identify trends or determine whether your organizational policies need adjustment.
Tip
If a message is sent to five recipients, we count it as five different messages, not one message.
On the Email & collaboration reports page at https://security.microsoft.com/emailandcollabreport, find Submissions, and then select View details. Or, to go directly to the report, use one of the following URLS:
- Defender for Office 365: https://security.microsoft.com/reports/TPSAggregateReportATP
- EOP: https://security.microsoft.com/reports/TPSAggregateReport
By default, the chart shows data for the past seven days. Select ![]() Filter on the Threat protection status report page to select a 90 day date range (trial subscriptions might be limited to 30 days). The details table allows filtering for 30 days.
Filter on the Threat protection status report page to select a 90 day date range (trial subscriptions might be limited to 30 days). The details table allows filtering for 30 days.
The available views are described in the following subsections.
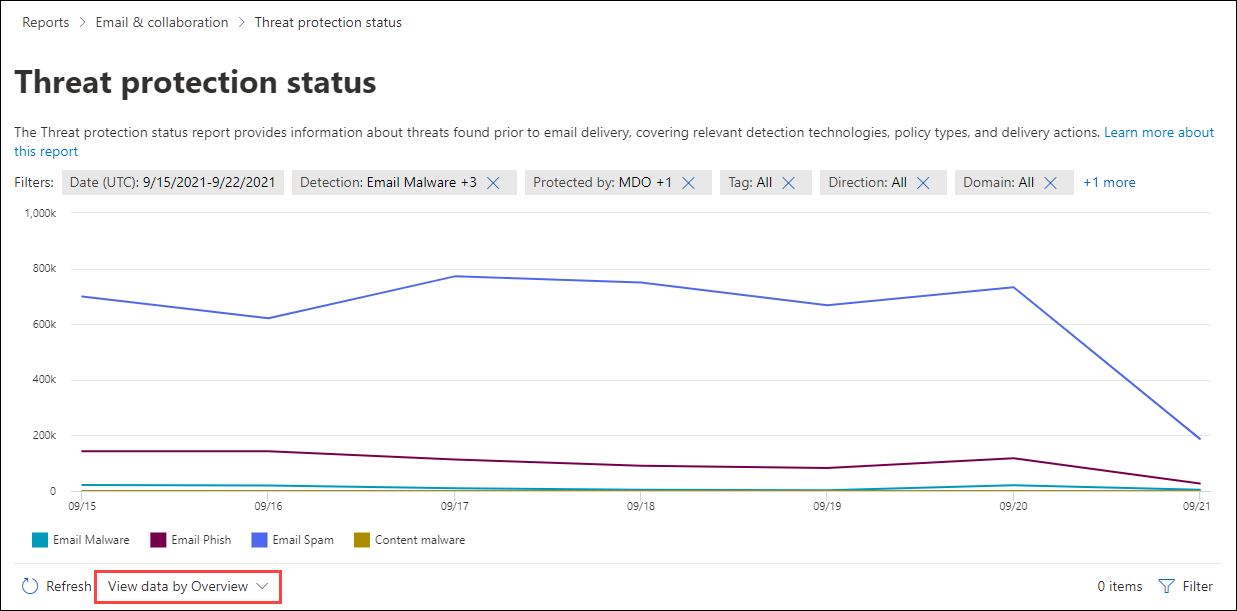
View data by Overview
In the View data by Overview view, the following detection information is shown in the chart:
- Email malware
- Email phish
- Email spam
- Content malware (Defender for Office 365 only: Files detected by Built-in virus protection in SharePoint, OneDrive, and Microsoft Teams and Safe Attachments for SharePoint, OneDrive, and Microsoft Teams)
No details table is available below the chart.
Select ![]() Filter to modify the report by selecting one or more of the following values in the flyout that opens:
Filter to modify the report by selecting one or more of the following values in the flyout that opens:
- Date (UTC) Start date and End date.
- Detection: The same values as in the chart.
- Protected by: MDO (Defender for Office 365) and EOP.
- Tag: Leave the value All or remove it, double-click in the empty box, and then select Priority account. For more information about user tags, see User tags.
- Direction: Leave the value All or remove it, double-click in the empty box, and then select Inbound, Outbound, or Intra-org.
- Domain: Leave the value All or remove it, double-click in the empty box, and then select an accepted domain.
- Policy type: Leave the value All or remove it, double-click in the empty box, and then select one of the following values:
- Anti-malware
- Safe Attachments
- Anti-phish
- Anti-spam
- Mail flow rule (transport rule)
- Others
When you're finished configuring the filters, select Apply, Cancel, or ![]() Clear filters.
Clear filters.
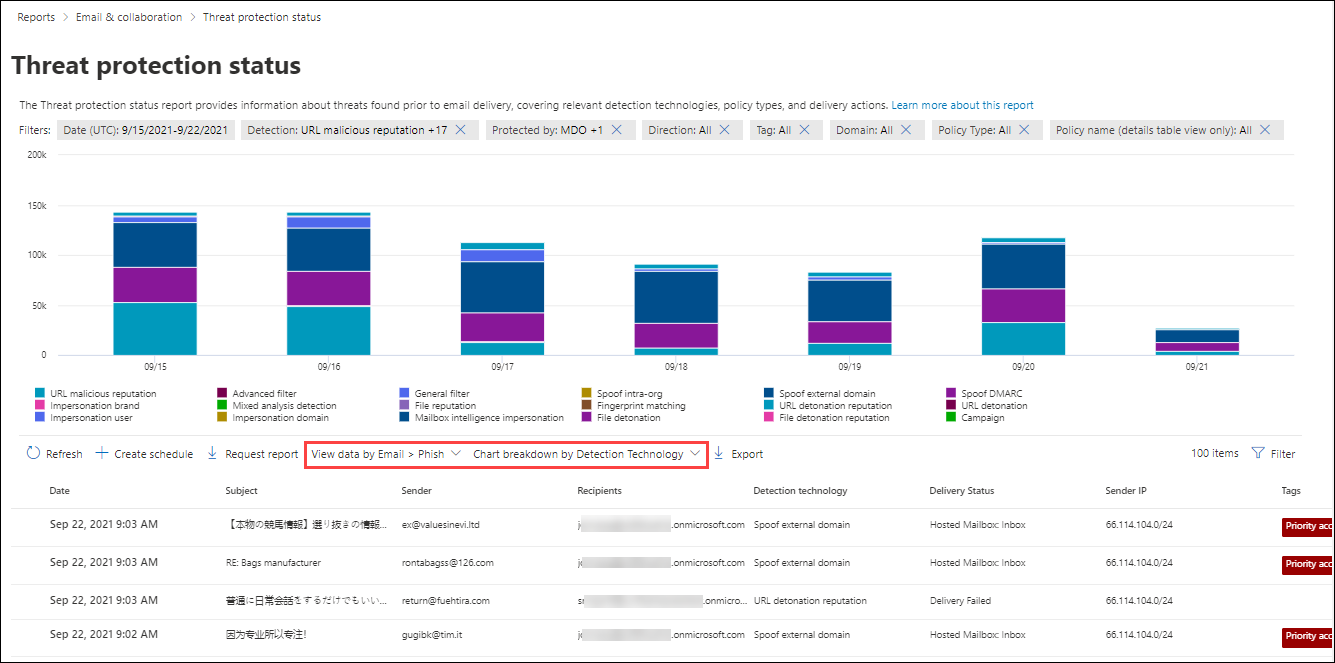
View data by Email > Phish and Chart breakdown by Detection Technology
Note
In May 2021, phishing detections in email were updated to include message attachments that contain phishing URLs. This change might shift some of the detection volume out of the View data by Email > Malware view and into the View data by Email > Phish view. In other words, message attachments with phishing URLs traditionally identified as malware now might be identified as phishing instead.
In the View data by Email > Phish and Chart breakdown by Detection Technology view, the following information is shown in the chart:
- Advanced filter: Phishing signals based on machine learning.
- Campaign*: Messages identified as part of a campaign.
- File detonation*: Safe Attachments detected a malicious attachment during detonation analysis.
- File detonation reputation*: File attachments previously detected by Safe Attachments detonations in other Microsoft 365 organizations.
- File reputation: The message contains a file that was previously identified as malicious in other Microsoft 365 organizations.
- Fingerprint matching: The message closely resembles a previous detected malicious message.
- General filter: Phishing signals based on analyst rules.
- Impersonation brand: Sender impersonation of well-known brands.
- Impersonation domain*: Impersonation of sender domains that you own or specified for protection in anti-phishing policies.
- Impersonation user*: Impersonation of protected senders that you specified in anti-phishing policies or learned through mailbox intelligence.
- Mailbox intelligence impersonation*: Impersonation detections from mailbox intelligence in anti-phishing policies.
- Mixed analysis detection: Multiple filters contributed to the message verdict.
- Spoof DMARC: The message failed DMARC authentication.
- Spoof external domain: Sender email address spoofing using a domain that's external to your organization.
- Spoof intra-org: Sender email address spoofing using a domain that's internal to your organization.
- URL detonation*: Safe Links detected a malicious URL in the message during detonation analysis.
- URL detonation reputation*: URLs previously detected by Safe Links detonations in other Microsoft 365 organizations.
- URL malicious reputation: The message contains a URL that was previously identified as malicious in other Microsoft 365 organizations.
* Defender for Office 365 only
In the details table below the chart, the following information is available:
- Date
- Subject
- Sender
- Recipients
- Detection technology: The same detection technology values from the chart.
- Delivery status
- Sender IP
- Tags: For more information about user tags, see User tags.
To see all columns, you likely need to do one or more of the following steps:
- Horizontally scroll in your web browser.
- Narrow the width of appropriate columns.
- Zoom out in your web browser.
Select ![]() Filter to modify the report by selecting one or more of the following values in the flyout that opens:
Filter to modify the report by selecting one or more of the following values in the flyout that opens:
- Date (UTC): Start date and End date
- Detection: The same values as in the chart.
- Priority account protection: Yes and No. For more information, see Configure and review priority account protection in Microsoft Defender for Office 365.
- Evaluation: Yes or No.
- Protected by: MDO (Defender for Office 365) and EOP
- Direction: Leave the value All or remove it, double-click in the empty box, and then select Inbound, Outbound, or Intra-org.
- Tag: Leave the value All or remove it, double-click in the empty box, and then select Priority account. For more information about user tags, see User tags.
- Domain: Leave the value All or remove it, double-click in the empty box, and then select an accepted domain.
- Policy type: Select All or one of the following values:
- Anti-malware
- Safe Attachments
- Anti-phish
- Anti-spam
- Mail flow rule (transport rule)
- Others
- Policy name (details table view only): Select All or a specific policy.
- Recipients (separated by commas)
When you're finished configuring the filters, select Apply, Cancel, or ![]() Clear filters.
Clear filters.
If you select an entry from the details table by clicking anywhere in the row other than the check box next to the first column, an email details flyout opens. This details flyout is known as the Email summary panel and contains summarized information that's also available on the Email entity page in Defender for Office 365 for the message. For details about the information in the Email summary panel, see The Email summary panel.
In Defender for Microsoft 365, the following actions are available at the top of the Email summary panel for the Threat protection status report:
 Open email entity: For more information, see The Email entity page in Microsoft Defender for Office 365.
 Take action: For information, see Threat hunting: The Take action wizard.
On the Threat protection status page, the ![]() Create schedule,
Create schedule, ![]() Request report, and
Request report, and ![]() Export actions are available.
Export actions are available.
View data by Email > Spam and Chart breakdown by Detection Technology
In the View data by Email > Spam and Chart breakdown by Detection Technology view, the following information is shown in the chart:
- Advanced filter: Phishing signals based on machine learning.
- Bulk: The bulk complaint level (BCL) of the message exceeds the defined threshold for spam.
- Domain reputation: The message was from a domain that was previously identified as sending spam in other Microsoft 365 organizations.
- Fingerprint matching: The message closely resembles a previous detected malicious message.
- General filter
- IP reputation: The message was from a source that was previously identified as sending spam in other Microsoft 365 organizations.
- Mixed analysis detection: Multiple filters contributed to the verdict for the message.
- URL malicious reputation: The message contains a URL that was previously identified as malicious in other Microsoft 365 organizations.
In the details table below the chart, the following information is available:
- Date
- Subject
- Sender
- Recipients
- Detection technology: The same detection technology values from the chart.
- Delivery status
- Sender IP
- Tags: For more information about user tags, see User tags.
To see all columns, you likely need to do one or more of the following steps:
- Horizontally scroll in your web browser.
- Narrow the width of appropriate columns.
- Zoom out in your web browser.
Select ![]() Filter to modify the report by selecting one or more of the following values in the flyout that opens:
Filter to modify the report by selecting one or more of the following values in the flyout that opens:
Date (UTC) Start date and End date
Detection: The same values as in the chart.
Bulk complaint level: When the Detection value Bulk is selected, the slider is available to filter the report by the selected BCL range. You can use this information to confirm or adjust the BCL threshold in anti-spam policies to allow more or less bulk email into your organization.
If the Detection value Bulk isn't selected, the slider is grayed-out and bulk detections aren't included in the report.
Priority account protection: Yes and No. For more information, see Configure and review priority account protection in Microsoft Defender for Office 365.
Direction: All or enter Inbound, Outbound, and Intra-org.
Direction: Leave the value All or remove it, double-click in the empty box, and then select Inbound, Outbound, or Intra-org.
Tag: Leave the value All or remove it, double-click in the empty box, and then select Priority account. For more information about user tags, see User tags.
Domain: Leave the value All or remove it, double-click in the empty box, and then select an accepted domain.
Policy type: Select All or one of the following values:
- Anti-malware
- Safe Attachments
- Anti-phish
- Anti-spam
- Mail flow rule (transport rule)
- Others
Policy name (details table view only): Select All or a specific policy.
Recipients
When you're finished configuring the filters, select Apply, Cancel, or ![]() Clear filters.
Clear filters.
If you select an entry from the details table by clicking anywhere in the row other than the check box next to the first column, an email details flyout opens. This details flyout is known as the Email summary panel and contains summarized information that's also available on the Email entity page in Defender for Office 365 for the message. For details about the information in the Email summary panel, see The Email summary panel.
In Defender for Microsoft 365, the following actions are available at the top of the Email summary panel for the Threat protection status report:
 Open email entity: For more information, see The Email entity page in Microsoft Defender for Office 365.
 Take action: For information, see Threat hunting: The Take action wizard.
On the Threat protection status page, the ![]() Create schedule,
Create schedule, ![]() Request report, and
Request report, and ![]() Export actions are available.
Export actions are available.
View data by Email > Malware and Chart breakdown by Detection Technology
Note
In May 2021, malware detections in email were updated to include harmful URLs in messages attachments. This change might shift some of the detection volume out of the View data by Email > Phish view and into the View data by Email > Malware view. In other words, harmful URLs in message attachments traditionally identified as phishing now might be identified as malware instead.
In the View data by Email > Malware and Chart breakdown by Detection Technology view, the following information is shown in the chart:
- File detonation*: Safe Attachments detected a malicious attachment during detonation analysis.
- File detonation reputation*: File attachments previously detected by Safe Attachments detonations in other Microsoft 365 organizations.
- File reputation: The message contains a file that was previously identified as malicious in other Microsoft 365 organizations.
- Anti-malware engine*: Detection from anti-malware.
- URL malicious reputation
- URL detonation*: Safe Links detected a malicious URL in the message during detonation analysis.
- URL detonation reputation*: URLs previously detected by Safe Links detonations in other Microsoft 365 organizations.
- Campaign*: Messages identified as part of a campaign.
* Defender for Office 365 only
In the details table below the chart, the following information is available:
Date
Subject
Sender
Recipients
Detection technology: The same detection technology values from the chart.
Delivery Status
Sender IP
Tags: For more information about user tags, see User tags.
To see all columns, you likely need to do one or more of the following steps:
- Horizontally scroll in your web browser.
- Narrow the width of appropriate columns.
- Zoom out in your web browser.
Select ![]() Filter to modify the report by selecting one or more of the following values in the flyout that opens:
Filter to modify the report by selecting one or more of the following values in the flyout that opens:
- Date (UTC) Start date and End date
- Detection: The same values as in the chart.
- Priority account protection: Yes and No. For more information, see Configure and review Priority accounts in Microsoft Defender for Office 365.
- Evaluation: Yes or No.
- Protected by: MDO (Defender for Office 365) and EOP
- Direction: Leave the value All or remove it, double-click in the empty box, and then select Inbound, Outbound, or Intra-org.
- Tag: Leave the value All or remove it, double-click in the empty box, and then select Priority account. For more information about user tags, see User tags.
- Domain: Leave the value All or remove it, double-click in the empty box, and then select an accepted domain.
- Policy type: Select All or one of the following values:
- Anti-malware
- Safe Attachments
- Anti-phish
- Anti-spam
- Mail flow rule (transport rule)
- Others
- Policy name (details table view only): Select All or a specific policy.
- Recipients (separated by commas)
When you're finished configuring the filters, select Apply, Cancel, or ![]() Clear filters.
Clear filters.
If you select an entry from the details table by clicking anywhere in the row other than the check box next to the first column, an email details flyout opens. This details flyout is known as the Email summary panel and contains summarized information that's also available on the Email entity page in Defender for Office 365 for the message. For details about the information in the Email summary panel, see The Email summary panel.
In Defender for Microsoft 365, the following actions are available at the top of the Email summary panel for the Threat protection status report:
 Open email entity: For more information, see The Email entity page in Microsoft Defender for Office 365.
 Take action: For information, see Threat hunting: The Take action wizard.
On the Threat protection status page, the ![]() Create schedule,
Create schedule, ![]() Request report, and
Request report, and ![]() Export actions are available.
Export actions are available.
Chart breakdown by Policy type
In the View data by Email > Phish, View data by Email > Spam, or View data by Email > Malware views, selecting Chart breakdown by Policy type shows the following information in the chart:
- Anti-malware
- Safe Attachments*
- Anti-phish
- Anti-spam
- Mail flow rule (also known as a transport rule)
- Others
In the details table below the chart, the following information is available:
Date
Subject
Sender
Recipients
Detection technology: The same detection technology values as described in View data by Email > Phish and Chart breakdown by Detection Technology.
Delivery status
Sender IP
Tags: For more information about user tags, see User tags.
To see all columns, you likely need to do one or more of the following steps:
- Horizontally scroll in your web browser.
- Narrow the width of appropriate columns.
- Zoom out in your web browser.
Select ![]() Filter to modify the report by selecting one or more of the following values in the flyout that opens:
Filter to modify the report by selecting one or more of the following values in the flyout that opens:
- Date (UTC) Start date and End date
- Detection: Detection technology values as previously described in this article and at Detection technologies.
- Priority account protection: Yes and No. For more information, see Configure and review Priority accounts in Microsoft Defender for Office 365.
- Evaluation: Yes or No.
- Protected by: MDO (Defender for Office 365) and EOP
- Direction: Leave the value All or remove it, double-click in the empty box, and then select Inbound, Outbound, or Intra-org.
- Tag: Leave the value All or remove it, double-click in the empty box, and then select Priority account. For more information about user tags, see User tags.
- Domain: Leave the value All or remove it, double-click in the empty box, and then select an accepted domain.
- Policy type: Select All or one of the following values:
- Anti-malware
- Safe Attachments
- Anti-phish
- Anti-spam
- Mail flow rule (transport rule)
- Others
- Policy name (details table view only): Select All or a specific policy.
- Recipients (separated by commas)
* Defender for Office 365 only
When you're finished configuring the filters, select Apply, Cancel, or ![]() Clear filters.
Clear filters.
If you select an entry from the details table by clicking anywhere in the row other than the check box next to the first column, an email details flyout opens. This details flyout is known as the Email summary panel and contains summarized information that's also available on the Email entity page in Defender for Office 365 for the message. For details about the information in the Email summary panel, see The Email summary panel.
In Defender for Microsoft 365, the following actions are available at the top of the Email summary panel for the Threat protection status report:
 Open email entity: For more information, see The Email entity page in Microsoft Defender for Office 365.
 Take action: For information, see Threat hunting: The Take action wizard.
On the Threat protection status page, the ![]() Create schedule,
Create schedule, ![]() Request report, and
Request report, and ![]() Export actions are available.
Export actions are available.
View data by Email > Phish and Chart breakdown by Threat classification (Defender for Office 365)
Threat classification in Defender for Office 365 uses AI to identify and categorize threats. For more information, see Threat classification in Microsoft Defender for Office 365.
In the View data by Email > Phish view, selecting Chart breakdown by Threat classification shows the following information in the chart:
- PII Gathering
- Business intelligence
- Invoice
- Payroll
- Gift card
- Contact establishment
- Task
- None
In the details table below the chart, the following information is available:
Date
Subject
Sender
Recipients
Detection technology: The same detection technology values as described in View data by Email > Phish and Chart breakdown by Detection Technology.
Threat classification: The same threat classification values shown in the chart and described in Threat classification in Microsoft Defender for Office 365.
Delivery status
Sender IP
Tags: For more information about user tags, see User tags.
To see all columns, you likely need to do one or more of the following steps:
- Horizontally scroll in your web browser.
- Narrow the width of appropriate columns.
- Zoom out in your web browser.
Select ![]() Filter to modify the report by selecting one or more of the following values in the flyout that opens:
Filter to modify the report by selecting one or more of the following values in the flyout that opens:
- Date (UTC) Start date and End date
- Detection section:
- URL malicious reputation: The message contains a URL that was previously identified as malicious in other Microsoft 365 organizations.
- Advanced filter: Phishing signals based on machine learning.
- General filter: Phishing signals based on analyst rules.
- Spoof intra-org: Sender email address spoofing using a domain that's internal to your organization.
- Spoof external domain: Sender email address spoofing using a domain that's external to your organization.
- Spoof DMARC: The message failed DMARC authentication.
- Impersonation brand: Sender impersonation of well-known brands.
- Mixed analysis detection: Multiple filters contributed to the message verdict.
- File reputation: The message contains a file that was previously identified as malicious in other Microsoft 365 organizations.
- Fingerprint matching: The message closely resembles a previous detected malicious message.
- URL detonation reputation: URLs previously detected by Safe Links detonations in other Microsoft 365 organizations.
- URL detonation: Safe Links detected a malicious URL in the message during detonation analysis.
- Impersonation user: Impersonation of protected senders that you specified in anti-phishing policies or learned through mailbox intelligence.
- Impersonation domain: Impersonation of sender domains that you own or specified for protection in anti-phishing policies.
- Mailbox intelligence impersonation: Impersonation detections from mailbox intelligence in anti-phishing policies.
- File detonation: Safe Attachments detected a malicious attachment during detonation analysis.
- File detonation reputation: File attachments previously detected by Safe Attachments detonations in other Microsoft 365 organizations.
- Campaign: Messages identified as part of a campaign.
- Threat classification: Leave the value All or remove it, double-click in the empty box, and then select an available value.
- Priority account protection: Yes and No. For more information, see Configure and review priority account protection in Microsoft Defender for Office 365.
- Evaluation: Yes or No.
- Protected by: MDO (Defender for Office 365) and EOP
- Direction: Leave the value All or remove it, double-click in the empty box, and then select Inbound, Outbound, or Intra-org.
- Tag: Leave the value All or remove it, double-click in the empty box, and then select Priority account. For more information about user tags, see User tags.
- Domain: Leave the value All or remove it, double-click in the empty box, and then select an accepted domain.
- Policy type: Select All or one of the following values:
- Anti-malware
- Safe Attachments
- Anti-phish
- Anti-spam
- Mail flow rule (transport rule)
- Others
- Policy name (details table view only): Select All or a specific policy.
- Recipients (separated by commas)
When you're finished configuring the filters, select Apply, Cancel, or ![]() Clear filters.
Clear filters.
If you select an entry from the details table by clicking anywhere in the row other than the check box next to the first column, an email details flyout opens. This details flyout is known as the Email summary panel and contains summarized information that's also available on the Email entity page in Defender for Office 365 for the message. For details about the information in the Email summary panel, see The Email summary panel.
The following actions are available at the top of the Email summary panel for the Threat protection status report:
 Open email entity: For more information, see The Email entity page in Microsoft Defender for Office 365.
 Take action: For information, see Threat hunting: The Take action wizard.
On the Threat protection status page, the ![]() Create schedule,
Create schedule, ![]() Request report, and
Request report, and ![]() Export actions are available.
Export actions are available.
Chart breakdown by Delivery status
In the View data by Email > Phish, View data by Email > Spam, or View data by Email > Malware views, selecting Chart breakdown by Delivery status shows the following information in the chart:
- Hosted mailbox: Inbox
- Hosted mailbox: Junk
- Hosted mailbox: Custom folder
- Hosted mailbox: Deleted Items
- Forwarded
- On-premises server: Delivered
- Quarantine
- Delivery failed
- Dropped
In the details table below the chart, the following information is available:
Date
Subject
Sender
Recipients
Detection technology: The same detection technology values as described in View data by Email > Phish and Chart breakdown by Detection Technology.
Delivery status
Sender IP
Tags: For more information about user tags, see User tags.
To see all columns, you likely need to do one or more of the following steps:
- Horizontally scroll in your web browser.
- Narrow the width of appropriate columns.
- Zoom out in your web browser.
Select ![]() Filter to modify the report by selecting one or more of the following values in the flyout that opens:
Filter to modify the report by selecting one or more of the following values in the flyout that opens:
- Date (UTC) Start date and End date
- Detection: Detection technology values as previously described in this article and at Detection technologies.
- Protected by: MDO (Defender for Office 365) and EOP
- Direction: Leave the value All or remove it, double-click in the empty box, and then select Inbound, Outbound, or Intra-org.
- Tag: Leave the value All or remove it, double-click in the empty box, and then select Priority account. For more information about user tags, see User tags.
- Domain: Leave the value All or remove it, double-click in the empty box, and then select an accepted domain.
- Policy type: Select All or one of the following values:
- Anti-malware
- Safe Attachments
- Anti-phish
- Anti-spam
- Mail flow rule (transport rule)
- Others
- Policy name (details table view only): Select All or a specific policy.
- Recipients (separated by commas)
* Defender for Office 365 only
When you're finished configuring the filters, select Apply, Cancel, or ![]() Clear filters.
Clear filters.
If you select an entry from the details table by clicking anywhere in the row other than the check box next to the first column, an email details flyout opens. This details flyout is known as the Email summary panel and contains summarized information that's also available on the Email entity page in Defender for Office 365 for the message. For details about the information in the Email summary panel, see The Email summary panel.
In Defender for Microsoft 365, the following actions are available at the top of the Email summary panel for the Threat protection status report:
 Open email entity: For more information, see The Email entity page in Microsoft Defender for Office 365.
 Take action: For information, see Threat hunting: The Take action wizard.
On the Threat protection status page, the ![]() Create schedule,
Create schedule, ![]() Request report, and
Request report, and ![]() Export actions are available.
Export actions are available.
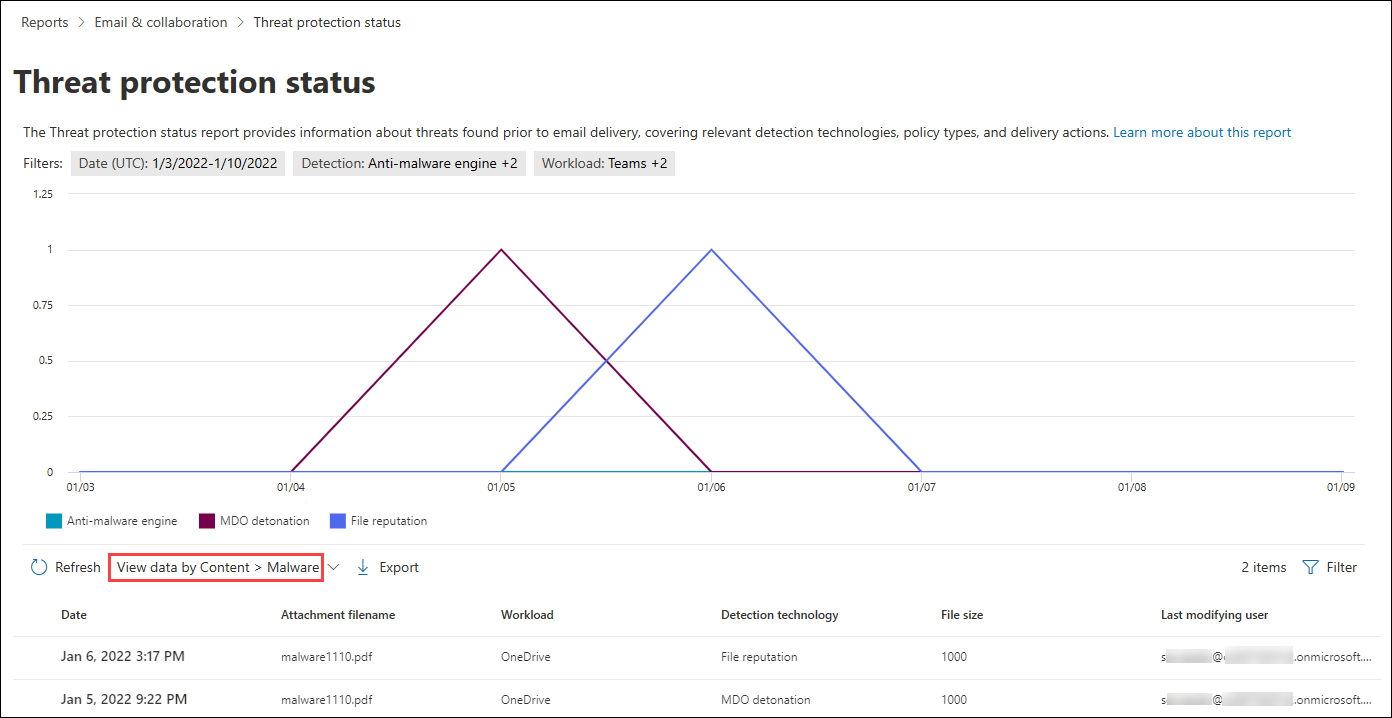
View data by Content > Malware
In the View data by Content > Malware view, the following information is shown in the chart for Microsoft Defender for Office 365 organizations:
- Anti-malware engine: Malicious files detected in SharePoint, OneDrive, and Microsoft Teams by the built-in virus detection in Microsoft 365.
- MDO detonation: Malicious files detected by Safe Attachments for SharePoint, OneDrive, and Microsoft Teams.
- File reputation: The message contains a file that was previously identified as malicious in other Microsoft 365 organizations.
In the details table below the chart, the following information is available:
- Date
- Attachment filename
- Workload
- Detection technology: The same detection technology values as described in View data by Email > Phish and Chart breakdown by Detection Technology.
- File size
- Last modifying user
Select ![]() Filter to modify the report by selecting one or more of the following values in the flyout that opens:
Filter to modify the report by selecting one or more of the following values in the flyout that opens:
- Date (UTC) Start date and End date.
- Detection: The same values as in the chart.
- Workload: Teams, SharePoint, and OneDrive
When you're finished configuring the filters, select Apply, Cancel, or ![]() Clear filters.
Clear filters.
On the Threat protection status page, the ![]() Export action is available.
Export action is available.
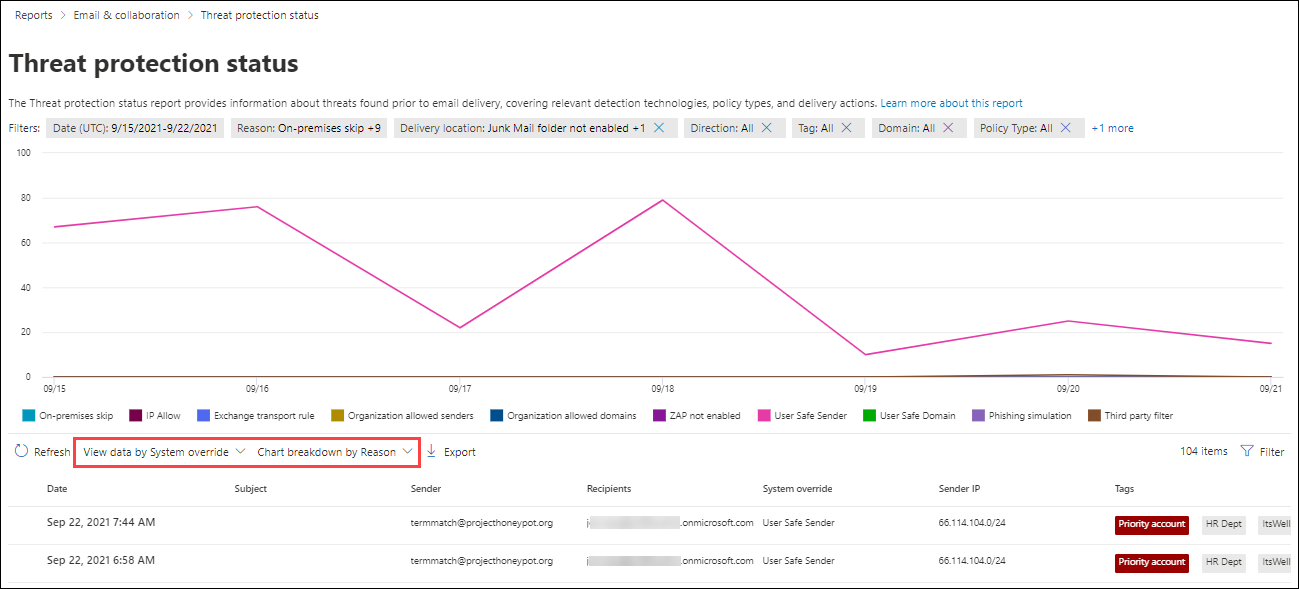
View data by System override and Chart breakdown by Reason
In the View data by System override and Chart breakdown by Reason view, the following override reason information is shown in the chart:
- Data Loss Prevention: Email messages quarantined by data loss prevention (DLP) policies.
- Exchange transport rule
- Exclusive setting (Outlook)
- IP Allow
- On-premises skip
- Organization allowed domains: The domain is specified in the allowed domains list in an anti-spam policy.
- Organization allowed senders: The sender is specified in the allowed senders list in an anti-spam policy.
- Phishing simulation: For more information, see Configure the delivery of third-party phishing simulations to users and unfiltered messages to SecOps mailboxes.
- Sender Domain List
- TABL - Both URL and file allowed
- TABL - File allowed
- TABL - File blocked
- TABL - URL allowed
- TABL - URL blocked
- TABL Sender email address Allow
- TABL Sender email address block
- TABL Spoof Block
- Third party filter
- Trusted Contact List - Sender in Address Book
- Trusted Recipient Address List
- Trusted Recipient Domain List
- Trusted Senders List (Outlook)
- User Safe Domain
- User Safe Sender
- ZAP not enabled
In the details table below the chart, the following information is available:
- Date
- Subject
- Sender
- Recipients
- System override
- Sender IP
- Tags: For more information about user tags, see User tags.
Select ![]() Filter to modify the report by selecting one or more of the following values in the flyout that opens:
Filter to modify the report by selecting one or more of the following values in the flyout that opens:
- Date (UTC) Start date and End date
- Reason: The same values as the chart.
- Delivery Location: Junk Mail folder not enabled and SecOps mailbox.
- Direction: Leave the value All or remove it, double-click in the empty box, and then select Inbound, Outbound, or Intra-org.
- Tag: Leave the value All or remove it, double-click in the empty box, and then select Priority account. For more information about user tags, see User tags.
- Domain: Leave the value All or remove it, double-click in the empty box, and then select an accepted domain.
- Policy type: Select All or one of the following values:
- Anti-malware
- Safe Attachments
- Anti-phish
- Anti-spam
- Mail flow rule (transport rule)
- Others
- Policy name (details table view only): Select All or a specific policy.
- Recipients (separated by commas)
When you're finished configuring the filters, select Apply, Cancel, or ![]() Clear filters.
Clear filters.
On the Threat protection status page, the ![]() Export action is available.
Export action is available.
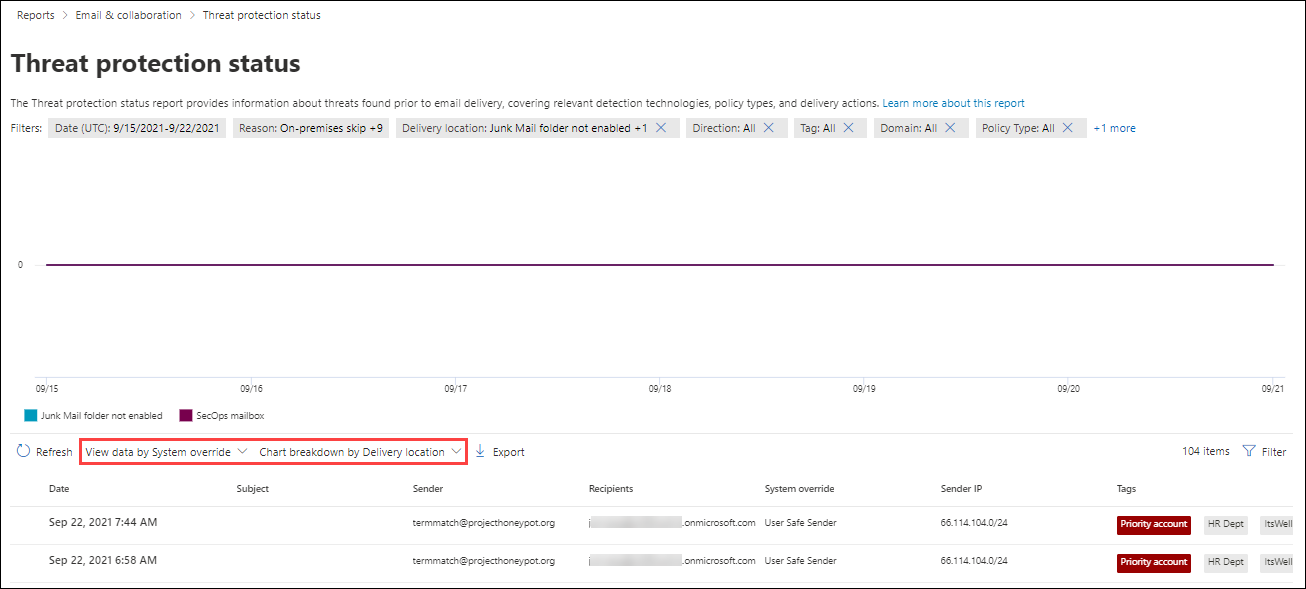
View data by System override and Chart breakdown by Delivery location
In the View data by System override and Chart breakdown by Delivery location view, the following override reason information is shown in the chart:
- Junk Mail folder not enabled
- SecOps mailbox: For more information, see Configure the delivery of third-party phishing simulations to users and unfiltered messages to SecOps mailboxes.
In the details table below the chart, the following information is available:
- Date
- Subject
- Sender
- Recipients
- System override
- Sender IP
- Tags: For more information about user tags, see User tags.
Select ![]() Filter to modify the report by selecting one or more of the following values in the flyout that opens:
Filter to modify the report by selecting one or more of the following values in the flyout that opens:
- Date (UTC) Start date and End date
- Reason: The same values as in Chart breakdown by Policy type
- Delivery Location: Junk Mail folder not enabled and SecOps mailbox.
- Direction: Leave the value All or remove it, double-click in the empty box, and then select Inbound, Outbound, or Intra-org.
- Tag: Leave the value All or remove it, double-click in the empty box, and then select Priority account. For more information about user tags, see User tags.
- Domain: Leave the value All or remove it, double-click in the empty box, and then select an accepted domain.
- Policy type: Select All or one of the following values:
- Anti-malware
- Safe Attachments
- Anti-phish
- Anti-spam
- Mail flow rule (transport rule)
- Others
- Policy name (details table view only): Select All or a specific policy.
- Recipients (separated by commas)
When you're finished configuring the filters, select Apply, Cancel, or ![]() Clear filters.
Clear filters.
On the Threat protection status page, the ![]() Export action is available.
Export action is available.
Top malware report
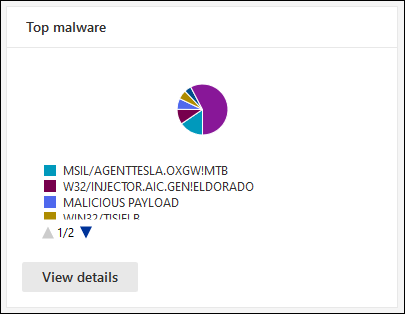
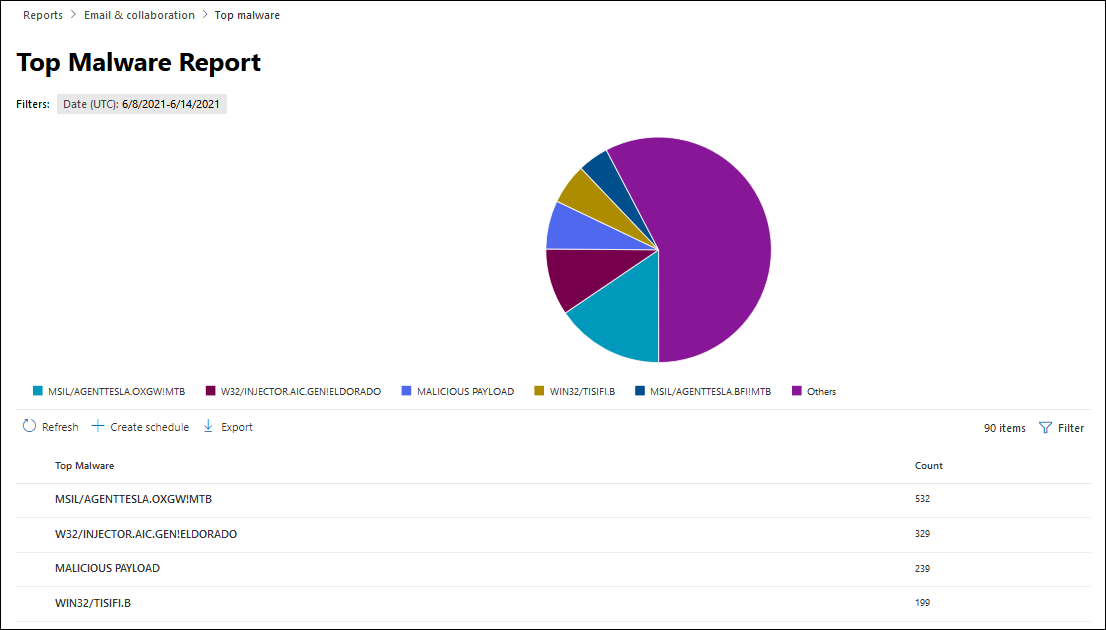
The Top malware report shows the various kinds of malware that was detected by anti-malware protection in EOP.
On the Email & collaboration reports page at https://security.microsoft.com/emailandcollabreport, find Top malware.
Hover over a wedge in the pie chart to see the malware name and how many messages contained the malware.
Select View details to go to the Top malware report page. Or, to go directly to the report, use https://security.microsoft.com/reports/TopMalware.
On the Top malware report page, a larger version of the pie chart is displayed. The details table below the chart shows the following information:
- Top malware: The malware name
- Count: How many messages contained the malware.
Select ![]() Filter to modify the report by selecting the Start date and End date values in the flyout that opens.
Filter to modify the report by selecting the Start date and End date values in the flyout that opens.
On the Top malware page, the ![]() Create schedule and
Create schedule and ![]() Export actions are available.
Export actions are available.
Top senders and recipients report
The Top senders and recipients report is available in both EOP and Defender for Office 365; however, the reports contain different data. For example, EOP customers can view information about top malware, spam, and phishing (spoofing) recipients, but not information about malware detected by Safe Attachments or phishing detected by impersonation protection.
The Top senders and recipients report shows the top 20 message senders in the organization, as well as the top 20 recipients for messages detected by EOP and Defender for Office 365 protection features. By default, the report shows data for the last week, but data is available for the last 90 days.
On the Email & collaboration reports page at https://security.microsoft.com/emailandcollabreport, find Top senders and recipients.
Hover over a wedge in the pie chart to see the number of messages for the sender or recipient.
Select View details to go to the Top senders and recipients page. Or, to go directly to the report, use one of the following URLs:
- Defender for Office 365: https://security.microsoft.com/reports/TopSenderRecipientsATP
- EOP: https://security.microsoft.com/reports/TopSenderRecipient
On the Top senders and recipients page, a larger version of the pie chart is displayed. The following charts are available:
- Show data for Top mail senders (default view)
- Show data for Top mail recipients
- Show data for Top spam recipients
- Show data for Top malware recipients (EOP)
- Show data for Top phishing recipients
- Show data for Top malware recipients (MDO)
- Show data for Top phish recipients (MDO)
- Show data for Top intra.org mail senders
- Show data for Top intra.org mail recipients
- Show data for Top intra.org spam recipients
- Show data for Top intra.org malware recipients
- Show data for Top intra.org phishing recipients
- Show data for Top intra.org phishing recipients (MDO)
- Show data for Top intra.org malware recipients (MDO)
Hover over a wedge in the pie chart to see the message count for that specific sender or recipient.
For each chart, the details table below the chart shows the following information:
- Email address
- Item count
- Tags: For more information about user tags, see User tags.
Select ![]() Filter to modify the report by selecting one or more of the following values in the flyout that opens:
Filter to modify the report by selecting one or more of the following values in the flyout that opens:
- Date (UTC) Start date and End date
- Tag: Leave the value All or remove it, double-click in the empty box, and then select Priority account. For more information about user tags, see User tags.
When you're finished configuring the filters, select Apply, Cancel, or ![]() Clear filters.
Clear filters.
On the Top senders and recipients page, the ![]() Export action is available.
Export action is available.
URL protection report
The URL protection report is available only in Microsoft Defender for Office 365. For more information, see URL protection report.
User reported messages report
Important
In order for the User reported messages report to work correctly, audit logging must be turned on in your Microsoft 365 organization (it's on by default). For more information, see Turn auditing on or off.
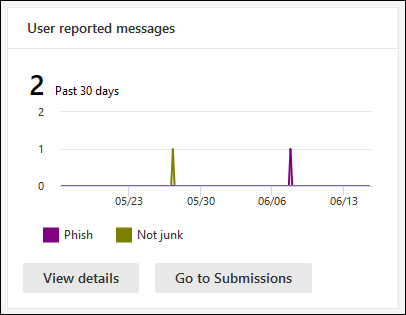
The User reported messages report shows information about email messages that users reported as junk, phishing attempts, or good mail by using the built-in Report button in Outlook or the Microsoft Report Message or Report Phishing add-ins.
On the Email & collaboration reports page at https://security.microsoft.com/emailandcollabreport, find User reported messages, and then select View details. Or, to go directly to the report, use https://security.microsoft.com/reports/userSubmissionReport.
To go directly to the User reported tab on the Submissions page in the Defender portal, select Go to submissions.
The chart shows the following information:
- Not junk
- Phish
- Spam
The details table below the graph shows the same information and has the same actions that are available on the User reported tab on the Submissions page at https://security.microsoft.com/reportsubmission?viewid=user:
 Customize columns
 Group
Group Filter
 Mark as and notify
 Submit to Microsoft for analysis
For more information, see View user reported messages to Microsoft and Admin actions for user reported messages.
On the report page, the ![]() Export action is available.
Export action is available.
What permissions are needed to view these reports?
You need to be assigned permissions before you can view and use the reports that are described in this article. You have the following options:
- Microsoft Defender XDR Unified role based access control (RBAC) (If Email & collaboration > Defender for Office 365 permissions is
 Active. Affects the Defender portal only, not PowerShell): Security operations/Security data/Security data basics (read) or Authorization and settings/System settings/manage.
 - Email & collaboration permissions in the Microsoft Defender portal: Membership in any of the following role groups:
- Organization Management¹
- Security Administrator
- Security Reader
- Global Reader
- Microsoft Entra permissions: Membership in the Global Administrator¹ ², Security Administrator, Security Reader, or Global Reader roles in Microsoft Entra ID gives users the required permissions and permissions for other features in Microsoft 365.
¹ Membership in the Organization Management role group or in the Global Administrator role is required to use the ![]() Create schedule or
Create schedule or ![]() Request report actions in reports (where available).
Request report actions in reports (where available).
Important
² Microsoft recommends that you use roles with the fewest permissions. Using lower permissioned accounts helps improve security for your organization. Global Administrator is a highly privileged role that should be limited to emergency scenarios when you can't use an existing role.
What if the reports aren't showing data?
If you don't see data in the reports, check the report filters and double-check that your protection policies are configured to detect and take action on messages. For more information, see the following articles:
- Configuration analyzer for protection policies in EOP and Microsoft Defender for Office 365
- Preset security policies in EOP and Microsoft Defender for Office 365
- How do I turn off spam filtering?
Download and export report information
Depending on the report and the specific view in the report, one or more of the following actions might be available on the main report page as previously described:
Export report data
Tip
- The exported data is affected by any filters that are configured in the report at the time of export.
- If the exported data exceeds 150,000 entries, the data is split into multiple files.
On the report page, select
 Export.
In the Export conditions flyout that opens, review, and configure the following settings:
- Select a view to export: Select one of the following values:
- Summary: Data from the last 90 days is available. This is the default value.
- Details: Data from the last 30 days is available. A date range of one day is supported.
- Date (UTC):
- Start date: The default value is three months ago.
- End date: The default value is today.
When you're finished in the Export conditions flyout, select Export.
The Export button changes to Exporting... and a progress bar is shown.
- Select a view to export: Select one of the following values:
In the Save as dialog that opens, you see the default name of the .csv file and the download location (the local Downloads folder by default), but you can change those values and then select Save to download the exported data.
If you see a dialog that security.microsoft.com wants to download multiple files, select Allow.
Schedule recurring reports
To create scheduled reports, you need to be a member of the Organization management role in Exchange Online or the Global Administrator* role in Microsoft Entra ID.
Important
* Microsoft recommends that you use roles with the fewest permissions. Using lower permissioned accounts helps improve security for your organization. Global Administrator is a highly privileged role that should be limited to emergency scenarios when you can't use an existing role.
On the report page, select
 Create schedule to start the new scheduled report wizard.
On the Name scheduled report page, review or customize the Name value, and then select Next.
On the Set preferences page, review or configure the following settings:
- Frequency: Select one of the following values:
- Weekly (default)
- Daily (this value results in no data being shown in charts)
- Monthly
- Start date: Enter the date when generation of the report begins. The default value is today.
- Expiry date: Enter the date when generation of the report ends. The default value is one year from today.
When you're finished on the Set preferences page, select Next.
- Frequency: Select one of the following values:
On the Select filters page, configure the following settings:
- Direction: Select one of the following values:
- All (default)
- Outbound
- Inbound
- Sender address
- Recipient address
When you're finished on the Select filters page, select Next.
- Direction: Select one of the following values:
On the Recipients page, choose recipients for the report in the Send email to box. The default value is your email address, but you can add others by doing either of the following steps:
- Click in the box, wait for the list of users to resolve, and then select the user from the list below the box.
- Click in the box, start typing a value, and then select the user from the list below the box.
To remove an entry from the list, select
 next to the entry.
When you're finished on the Recipients page, select Next.
On the Review page, review your settings. You can select Edit in each section to modify the settings within the section. Or you can select Back or the specific page in the wizard.
When you're finished on the Review page, select Submit.
On the New scheduled report created page, you can select the links to view the scheduled report or create another report.
When you're finished on the New scheduled report created page, select Done.
The reports are emailed to the specified recipients based on the schedule you configured
The scheduled report entry is available on the Managed schedules page as described in the next subsection.
Manage existing scheduled reports
After you create a scheduled report as described in the previous section, the scheduled report entry is available on the Manage schedules page in the Defender portal.
In the Microsoft Defender portal at https://security.microsoft.com, go to Reports > Email & collaboration > select Manage schedules. Or, to go directly to the Manage schedules page, use https://security.microsoft.com/ManageSubscription.
On the Manage schedules page, the following information is shown for each scheduled report entry:
- Schedule start date
- Schedule name
- Report type
- Frequency
- Last sent
To change the list from normal to compact spacing, select ![]() Change list spacing to compact or normal, and then select
Change list spacing to compact or normal, and then select ![]() Compact list.
Compact list.
Use the ![]() Search box to find an existing scheduled report entry.
Search box to find an existing scheduled report entry.
To modify the scheduled report settings, do the following steps:
Select the scheduled report entry by clicking anywhere in the row other than the check box.
In the details flyout that opens, do any of the following steps:
- Select
 Edit name to change the name of the scheduled report.
 - Select the Edit link in the section to modify the corresponding settings.
The settings and configuration steps are the same as described in Schedule report.
- Select
To delete a scheduled report entry, use either of the following methods:
- Select the check box next to one, more or all of the scheduled reports, and then select the
 Delete action that appears on the main page.
 - Select the scheduled report by clicking anywhere in the row other than the check box, and then select
 Delete in the details flyout that opens.
Read the warning dialog that opens, and then select OK.
Back on the Manage schedules page, the deleted scheduled report entry is no longer listed, and previous reports for the scheduled report are deleted and are no longer available for download.
Request on-demand reports for download
To create on-demand reports, you need to be a member of the Organization management role in Exchange Online or the Global Administrator* role in Microsoft Entra ID.
Important
* Microsoft recommends that you use roles with the fewest permissions. Using lower permissioned accounts helps improve security for your organization. Global Administrator is a highly privileged role that should be limited to emergency scenarios when you can't use an existing role.
On the report page, select
 Request report to start the new on-demand report wizard.
On the Name on-demand report page, review or customize the Name value, and then select Next.
On the Set preferences page, review or configure the following settings:
- Start date: Enter the start date for the report data. The default value is one month ago.
- Expiry date: Enter the end date for the report data. The default value is today.
When you're finished on the Name on-demand report page, select Next.
On the Recipients page, choose recipients for the report in the Send email to box. The default value is your email address, but you can add others by doing either of the following steps:
- Click in the box, wait for the list of users to resolve, and then select the user from the list below the box.
- Click in the box, start typing a value, and then select the user from the list below the box.
To remove an entry from the list, select
 next to the entry.
When you're finished on the Recipients page, select Next.
On the Review page, review your settings. You can select Edit in each section to modify the settings within the section. Or you can select Back or the specific page in the wizard.
When you're finished on the Review page, select Submit.
On the New on-demand report created page, you can select the link to create another report.
When you're finished on the New on-demand report created page, select Done.
The report creation task (and eventually the finished report) is available on the Reports for download page as described in the next subsection.
Download reports
To download on-demand reports, you need to be a member of the Organization management role in Exchange Online or the Global Administrator* role in Microsoft Entra ID.
Important
* Microsoft recommends that you use roles with the fewest permissions. Using lower permissioned accounts helps improve security for your organization. Global Administrator is a highly privileged role that should be limited to emergency scenarios when you can't use an existing role.
After you request an on-demand report as described in the previous section, you check the status of the report and eventually download the report on the Reports for download page in the Defender portal.
In the Microsoft Defender portal at https://security.microsoft.com, go to Reports > Email & collaboration > select Reports for download. Or, to go directly to the Reports for download page, use https://security.microsoft.com/ReportsForDownload.
On the Reports for download page, the following information is shown for each available report:
- Start date
- Name
- Report type
- Last sent
- Status:
- Pending: The report is still being created, and it isn't available to download yet.
- Complete - Ready for download: Report generation is complete, and the report is available to download.
- Complete - No results found: Report generation is complete, but the report contains no data, so you can't download it.
To download the report, select the check box next in the start date of the report, and then select the ![]() Download report action that appears.
Download report action that appears.
Use the ![]() Search box to find an existing report.
Search box to find an existing report.
In the Save as dialog that opens, you see the default name of the .csv file and the download location (the local Downloads folder by default), but you can change those values and then select Save to download the report.
Related articles
Anti-malware protection in EOP
