About Threat Explorer and Real-time detections in Microsoft Defender for Office 365
Tip
Did you know you can try the features in Microsoft Defender for Office 365 Plan 2 for free? Use the 90-day Defender for Office 365 trial at the Microsoft Defender portal trials hub. Learn about who can sign up and trial terms on Try Microsoft Defender for Office 365.
Microsoft 365 organizations that have Microsoft Defender for Office 365 included in their subscription or purchased as an add-on have Explorer (also known as Threat Explorer) or Real-time detections. These features are powerful, near real-time reporting tools that help Security Operations (SecOps) teams investigate and respond to threats.
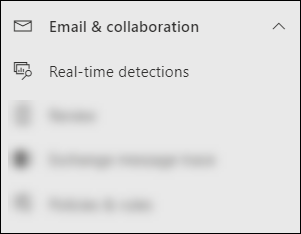
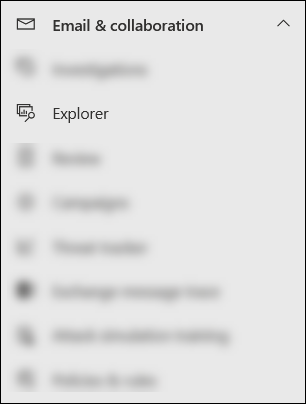
Depending on your subscription, Threat Explorer or Real-time detections is available in the Email & collaboration section in the Microsoft Defender portal at https://security.microsoft.com:
Real-time detections is available in Defender for Office 365 Plan 1. The Real-time detections page is available directly at https://security.microsoft.com/realtimereportsv3.
Threat Explorer is available in Defender for Office 365 Plan 2. The Explorer page is available directly at https://security.microsoft.com/threatexplorerv3.
Threat Explorer contains the same information and capabilities as Real-time detections, but with the following additional features:
- More views.
- More property filtering options, including the option to save queries.
- More actions.
For more information about the differences between Defender for Office 365 Plan 1 and Plan 2, see the Defender for Office 365 Plan 1 vs. Plan 2 cheat sheet.
The rest of this article explains the views and features that are available in Threat Explorer and Real-time detections.
Tip
For email scenarios using Threat Explorer and Real-time detections, see the following articles:
Permissions and licensing for Threat Explorer and Real-time detections
To use Explorer or Real-time detections, you need to be assigned permissions. You have the following options:
- Microsoft Defender XDR Unified role based access control (RBAC) (If Email & collaboration > Defender for Office 365 permissions is
 Active. Affects the Defender portal only, not PowerShell):
- Read access for email and Teams message headers: Security operations/Raw data (email & collaboration)/Email & collaboration metadata (read).
- Preview and download email messages: Security operations/Raw data (email & collaboration)/Email & collaboration content (read).
- Remediate malicious email: Security operations/Security data/Email & collaboration advanced actions (manage).
- Email & collaboration permissions in the Microsoft Defender portal:
- Full access: Membership in the Organization Management or Security Administrator role groups. More permissions are required to do all available actions:
- Preview and download messages: Requires the Preview role, which is assigned only to the Data Investigator or eDiscovery Manager role groups by default. Or, you can create a new role group with the Preview role assigned, and add the users to the custom role group.
- Move messages in and delete messages from mailboxes: Requires the Search and Purge role, which is assigned only to the Data Investigator or Organization Management role groups by default. Or, you can create a new role group with the Search and Purge role assigned, and add the users to the custom role group.
- Read-only access: Membership in the Security Reader role group.
- Full access: Membership in the Organization Management or Security Administrator role groups. More permissions are required to do all available actions:
- Microsoft Entra permissions: Membership these roles gives users the required permissions and permissions for other features in Microsoft 365:
Full access: Membership in the Global Administrator* or Security Administrator roles.
Search for Exchange mail flow rules (transport rules) by name in Threat Explorer: Membership in the Security Administrator or Security Reader roles.
Read-only access: Membership in the Global Reader or Security Reader roles.
Important
* Microsoft recommends that you use roles with the fewest permissions. Using lower permissioned accounts helps improve security for your organization. Global Administrator is a highly privileged role that should be limited to emergency scenarios when you can't use an existing role.
Tip
End-user spam notifications and system generated messages aren't avaialble in Threat Explorer. These types of messages are available if there's a mail flow rule (also known as a transport rule) to override.
Audit log entries are generated when admins preview or download email messages. You can search the admin audit log by user for AdminMailAccess activity. For instructions, see Audit New Search.
To use Threat Explorer or Real-time detections, you need to be assigned a license for Defender for Office 365 (included in your subscription or an add-on license).
Threat Explorer or Real-time detections contains data for users with Defender for Office 365 licenses assigned to them.
Elements of Threat Explorer and Real-time detections
Threat Explorer and Real-time detections contain the following elements:
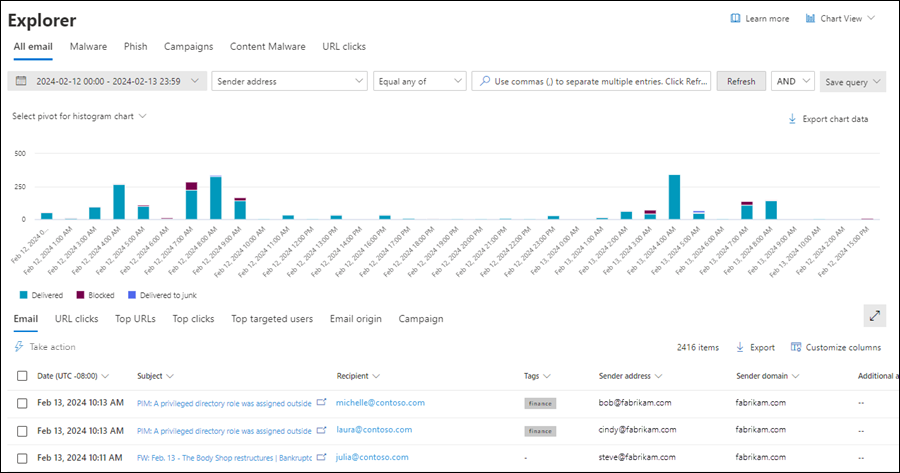
Views: Tabs at the top of the page that organize detections by threat. The view affects the rest of the data and options on the page.
The following table lists the available views in Threat Explorer and Real-time detections:
View Threat
ExplorerReal-time
detectionsDescription All email ✔ Default view for Threat Explorer. Information about all email messages sent by external users into your organization (Inbound), email messages sent by internal users in your organization to external users (Outbound), and email messages sent between internal users in your organization (Intra-org). Malware ✔ ✔ Default view for Real-time detections. Information about email messages that contain malware. Phish ✔ ✔ Information about email messages that contain phishing threats. Campaigns ✔ Information about malicious email that Defender for Office 365 Plan 2 identified as part of a coordinated phishing or malware campaign. Content malware ✔ ✔ Information about malicious files detected by the following features: URL clicks ✔ Information about user clicks on URLs in email messages, Teams messages, SharePoint files, and OneDrive files. These views are described in detail in this article, including the differences between Threat Explorer and Real-time detections.
Tip
Real-time detections shows the malicious email detections at the time of delivery only. Threat Explorer shows all email detections at the time of delivery along with post-delivery activities.
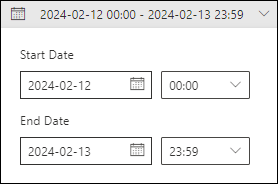
Date/time filters: By default, the view is filtered by yesterday and today. To change the date filter, select the date range, and then select Start Date and End date values up to 30 days ago.
Property filters (queries): Filter the results in the view by the available message, file, or threat properties. The available filterable properties depend on the view. Some properties are available in many views, while other properties are limited to a specific view.
The available property filters for each view are listed in this article, including the differences between Threat Explorer and Real-time detections.
For instructions to create property filters, see Property filters in Threat Explorer and Real-time detections
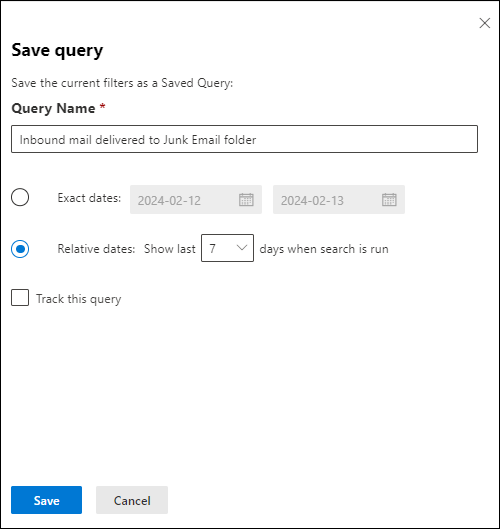
Threat Explorer allows you to save queries for later use as described in the Saved queries in Threat Explorer section.
Charts: Each view contains a visual, aggregate representation of the filtered or unfiltered data. You can use available pivots to organize the chart in different ways.
You can often use
 Export chart data to export filtered or unfiltered chart data to a CSV file.
The charts and available pivots are described in detail in this article, including the differences between Threat Explorer and Real-time detections.
Tip
To remove the chart from the page (which maximizes the size of the details area), use either of the following methods:
- Select
 Chart View >
  List View at the top of the page.
 - Select
 Show list view between the chart and the details area.
- Select
Details area: The details area for a view typically shows a table that contains the filtered or unfiltered data. You can use the available views (tabs) to organize the data in the details area in different ways. For example, a view might contain charts, maps, or different tables.
If the details area contains a table, you can often use
 Export to selectively export up to 200,000 filtered or unfiltered results to a CSV file.
Tip
In the Export flyout, you can select some or all of the available properties to export. The selections are saved per user. Selections in Incognito or InPrivate browsing mode are saved until you close the web browser.
All email view in Threat Explorer
The All email view in Threat Explorer shows information about all inbound, outbound, and intra-org email messages. The view shows malicious and non-malicious email. For example:
- Email identified phishing or malware.
- Email identified as spam or bulk.
- Email identified with no threats.
This view is the default in Threat Explorer. To open the All email view on the Explorer page in the Defender portal at https://security.microsoft.com, go to Email & collaboration > Explorer > All email tab. Or, go directly to the Explorer page using https://security.microsoft.com/threatexplorerv3, and then verify that the All email tab is selected.
Filterable properties in the All email view in Threat Explorer
By default, no property filters are applied to the data. The steps to create filters (queries) are described in the Filters in Threat Explorer and Real-time detections section later in this article.
The filterable properties that are available in the Delivery action box in the All email view are described in the following table:
| Property | Type |
|---|---|
| Basic | |
| Sender address | Text. Separate multiple values by commas. |
| Recipients | Text. Separate multiple values by commas. |
| Sender domain | Text. Separate multiple values by commas. |
| Recipient domain | Text. Separate multiple values by commas. |
| Subject | Text. Separate multiple values by commas. |
| Sender display name | Text. Separate multiple values by commas. |
| Sender mail from address | Text. Separate multiple values by commas. |
| Sender mail from domain | Text. Separate multiple values by commas. |
| Return path | Text. Separate multiple values by commas. |
| Return path domain | Text. Separate multiple values by commas. |
| Malware family | Text. Separate multiple values by commas. |
| Tags | Text. Separate multiple values by commas. For more information about user tags, see User tags. |
| Impersonated domain | Text. Separate multiple values by commas. |
| Impersonated user | Text. Separate multiple values by commas. |
| Exchange transport rule | Text. Separate multiple values by commas. |
| Data loss prevention rule | Text. Separate multiple values by commas. |
| Context | Select one or more values:
|
| Connector | Text (connector name). Separate multiple values by commas. |
| Delivery action | Select one or more values:
|
| Additional action | Select one or more values:
|
| Directionality | Select one or more values:
|
| Detection technology | Select one or more values:
|
| Threat classification | Select one or more values:
|
| Original delivery location | Select one or more values:
|
| Latest delivery location¹ | Same values as Original delivery location |
| Phish confidence level | Select one or more values:
|
| Primary override | Select one or more values:
|
| Primary override source | Messages can have multiple allow or block overrides as identified in Override source. The override that ultimately allowed or blocked the message is identified in Primary override source. Select one or more values:
|
| Override source | Same values as Primary override source |
| Policy type | Select one or more values:
|
| Policy action | Select one or more values:
|
| Threat type | Select one or more values:
|
| Forwarded message | Select one or more values:
|
| Distribution list | Text. Separate multiple values by commas. |
| Email size | Integer. Separate multiple values by commas. |
| Advanced | |
| Internet Message ID | Text. Separate multiple values by commas. Available in the Message-ID header field in the message header. An example value is <08f1e0f6806a47b4ac103961109ae6ef@server.domain> (note the angle brackets). |
| Network message ID | Text. Separate multiple values by commas. A GUID value that's available in the X-MS-Exchange-Organization-Network-Message-Id header field in the message header. |
| Sender IP | Text. Separate multiple values by commas. |
| Attachment SHA256 | Text. Separate multiple values by commas. |
| Cluster ID | Text. Separate multiple values by commas. |
| Alert ID | Text. Separate multiple values by commas. |
| Alert Policy ID | Text. Separate multiple values by commas. |
| Campaign ID | Text. Separate multiple values by commas. |
| ZAP URL signal | Text. Separate multiple values by commas. |
| Urls | |
| URL Count | Integer. Separate multiple values by commas. |
| URL domain² | Text. Separate multiple values by commas. |
| URL domain and path² | Text. Separate multiple values by commas. |
| URL² | Text. Separate multiple values by commas. |
| URL path² | Text. Separate multiple values by commas. |
| URL source | Select one or more values:
|
| Click verdict | Select one or more values:
|
| URL Threat | Select one or more values:
|
| File | |
| Attachment Count | Integer. Separate multiple values by commas. |
| Attachment filename | Text. Separate multiple values by commas. |
| File type | Text. Separate multiple values by commas. |
| File Extension | Text. Separate multiple values by commas. |
| File Size | Integer. Separate multiple values by commas. |
| Authentication | |
| SPF | Select one or more values:
|
| DKIM | Select one or more values:
|
| DMARC | Select one or more values:
|
| Composite | Select one or more values:
|
Tip
¹ Latest delivery location doesn't include end-user actions on messages. For example, if the user deleted the message or moved the message to an archive or PST file.
There are scenarios where Original delivery location/Latest delivery location and/or Delivery action have the value Unknown. For example:
- The message was delivered (Delivery action is Delivered), but an Inbox rule moved the message to a default folder other than the Inbox or Junk Email folder (for example, the Draft or Archive folder).
- ZAP attempted to move the message after delivery, but the message wasn't found (for example, the user moved or deleted the message).
² By default, a URL search maps to http, unless another value is explicitly specified. For example:
- Searching with and without the
http://prefix in URL, URL Domain, and URL Domain and Path should show the same results. - Search for the
https://prefix in URL. When no value is specified, thehttp://prefix is assumed. /at the beginning and end of the URL path, URL Domain, URL domain and path fields is ignored./at the end of the URL field is ignored.
Pivots for the chart in the All email view in Threat Explorer
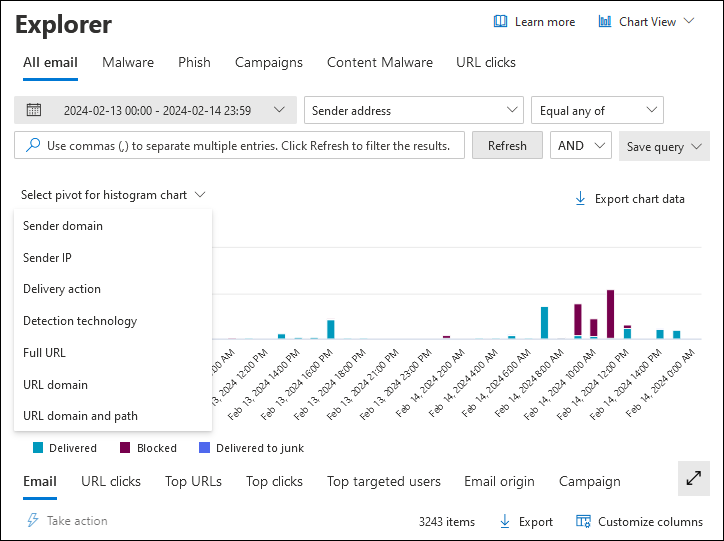
The chart has a default view, but you can select a value from Select pivot for histogram chart to change how the filtered or unfiltered chart data is organized and displayed.
The available chart pivots are described in the following subsections.
Delivery action chart pivot in the All email view in Threat Explorer
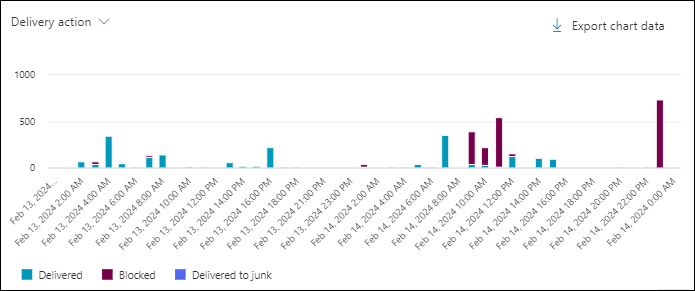
Although this pivot doesn't look selected by default, Delivery action is the default chart pivot in the All email view.
The Delivery action pivot organizes the chart by the actions taken on messages for the specified date/time range and property filters.
Hovering over a data point in the chart shows the count for each delivery action.
Sender domain chart pivot in the All email view in Threat Explorer
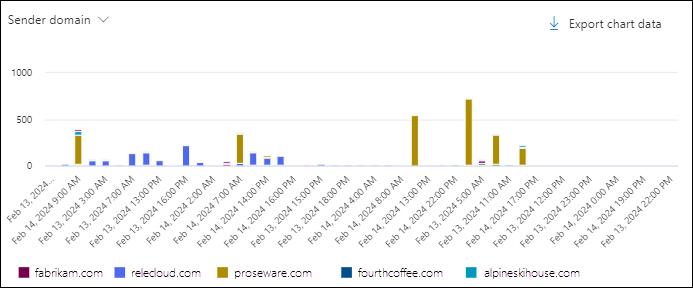
The Sender domain pivot organizes the chart by the domains in messages for the specified date/time range and property filters.
Hovering over a data point in the chart shows the count for each sender domain.
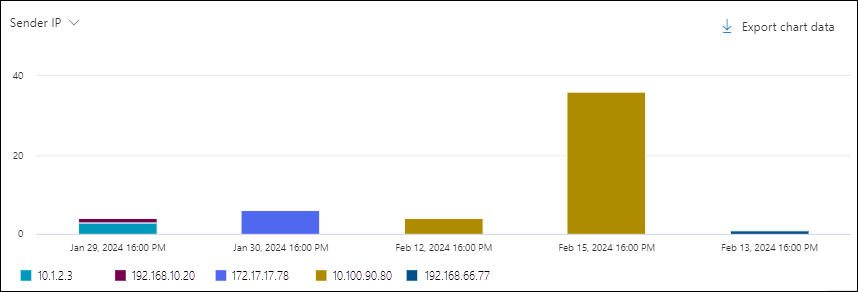
Sender IP chart pivot in the All email view in Threat Explorer
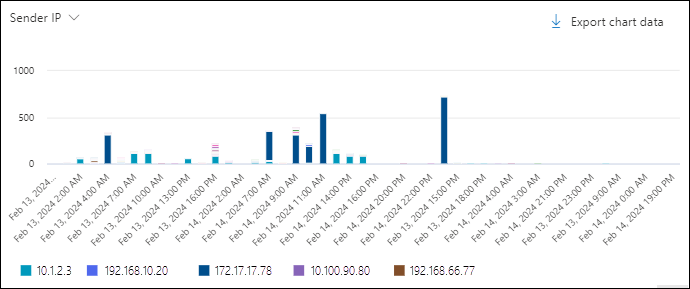
The Sender IP pivot organizes the chart by the source IP addresses of messages for the specified date/time range and property filters.
Hovering over a data point in the chart shows the count for each sender IP address.
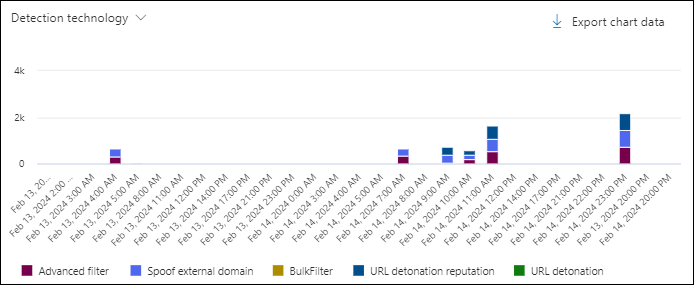
Detection technology chart pivot in the All email view in Threat Explorer
The Detection technology pivot organizes the chart by the feature that identified messages for the specified date/time range and property filters.
Hovering over a data point in the chart shows the count for each detection technology.
Threat classification chart pivot in the All email view in Threat Explorer
The Threat classification pivot organizes the chart by classified threats. For more information, see Threat classification in Microsoft Defender for Office 365.
Hovering over a data point in the chart shows the count for each classification.
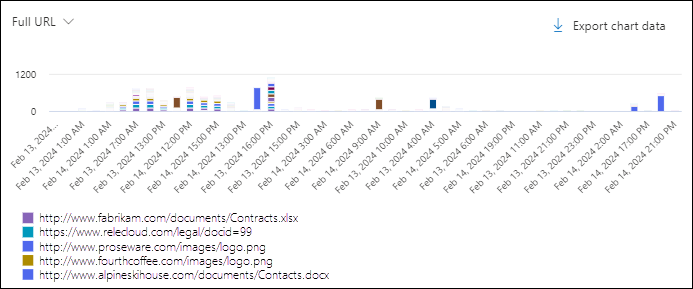
Full URL chart pivot in the All email view in Threat Explorer
The Full URL pivot organizes the chart by the full URLs in messages for the specified date/time range and property filters.
Hovering over a data point in the chart shows the count for each full URL.
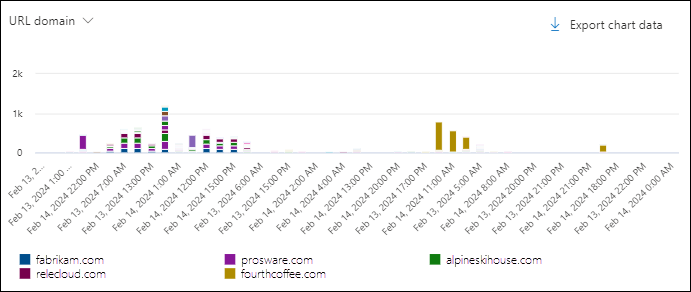
URL domain chart pivot in the All email view in Threat Explorer
The URL domain pivot organizes the chart by the domains in URLs in messages for the specified date/time range and property filters.
Hovering over a data point in the chart shows the count for each URL domain.
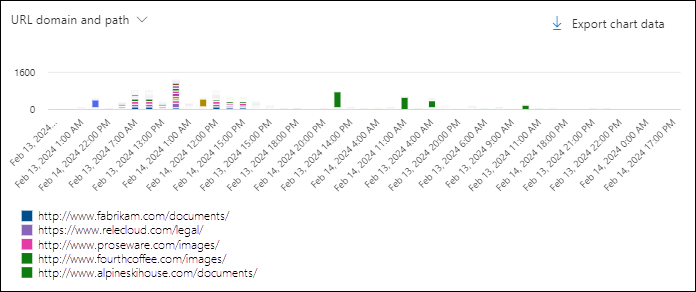
URL domain and path chart pivot in the All email view in Threat Explorer
The URL domain and path pivot organizes the chart by the domains and paths in URLs in messages for the specified date/time range and property filters.
Hovering over a data point in the chart shows the count for each URL domain and path.
Views for the details area of the All email view in Threat Explorer
The available views (tabs) in the details area of the All email view are described in the following subsections.
Email view for the details area of the All email view in Threat Explorer
Email is the default view for the details area in the All email view.
The Email view shows a details table. You can sort the entries by clicking on an available column header. Select ![]() Customize columns to change the columns that are shown. The default values are marked with an asterisk (*):
Customize columns to change the columns that are shown. The default values are marked with an asterisk (*):
- Date*
- Subject*
- Recipient*
- Recipient domain
- Tags*
- Sender address*
- Sender display name
- Sender domain*
- Sender IP
- Sender mail from address
- Sender mail from domain
- Additional actions*
- Delivery action
- Latest delivery location*
- Original delivery location*
- System overrides source
- System overrides
- Alert ID
- Internet message ID
- Network message ID
- Mail language
- Exchange transport rule
- Connector
- Context
- Data loss prevention rule
- Threat type*
- Detection technology
- Threat classification
- Attachment Count
- URL Count
- Email size
Tip
To see all columns, you likely need to do one or more of the following steps:
- Horizontally scroll in your web browser.
- Narrow the width of appropriate columns.
- Remove columns from the view.
- Zoom out in your web browser.
Customized column settings are saved per user. Customized column settings in Incognito or InPrivate browsing mode are saved until you close the web browser.
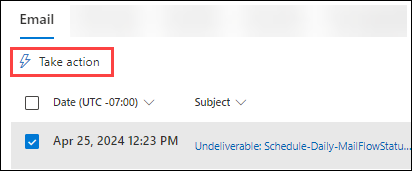
When you select one or more entries from the list by selecting the check box next to the first column, the ![]() Take action is available. For information, see Threat hunting: Email remediation.
Take action is available. For information, see Threat hunting: Email remediation.
In the Subject value for the entry, the ![]() Open in new window action is available. This action opens the message in the Email entity page.
Open in new window action is available. This action opens the message in the Email entity page.
When you click on the Subject or Recipient values in an entry, details flyouts open. These flyouts are described in the following subsections.
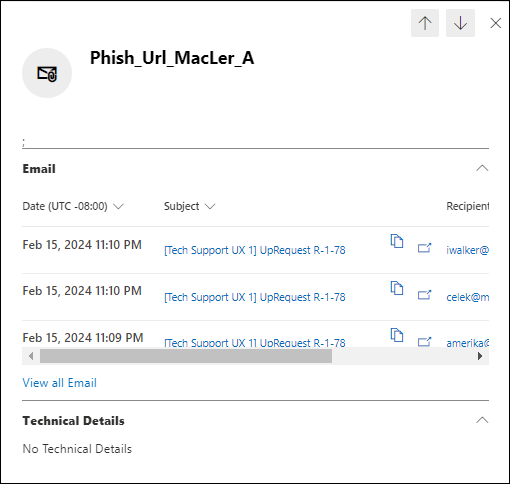
Email details from the Email view of the details area in the All email view
When you select the Subject value of an entry in the table, an email details flyout opens. This details flyout is known as the Email summary panel and contains standardized summary information that's also available on the Email entity page for the message.
For details about the information in the Email summary panel, see The Email summary panel in Defender.
The following actions are available at the top of the Email summary panel for Threat Explorer and Real-time detections:
 Open email entity
 View header
 Take action: For information, see Threat hunting: Email remediation.
 More options:
 Email preview¹ ²
 Download email¹ ² ³
 View in Explorer
 Go hunt⁴
¹ The Email preview and Download email actions require the Preview role in Email & collaboration permissions. By default, this role is assigned to the Data Investigator and eDiscovery Manager role groups. By default, members of the Organization Management or Security Administrators role groups can't do these actions. To allow these actions for the members of those groups, you have the following options:
- Add the users to the Data Investigator or eDiscovery Manager role groups.
- Create a new role group with the Search and Purge role assigned, and add the users to the custom role group.
² You can preview or download email messages that are available in Microsoft 365 mailboxes. Examples of when messages are no longer available in mailboxes include:
- The message was dropped before delivery or delivery failed.
- The message was soft deleted (deleted from the Deleted items folder, which moves the message to the Recoverable Items\Deletions folder).
- ZAP moved the message to quarantine.
³ Download email isn't available for messages that were quarantined. Instead, download a password protected copy of the message from quarantine.
⁴ Go hunt is available only in Threat Explorer. It isn't available in Real-time detections.
Recipient details from the Email view of the details area in the All email view
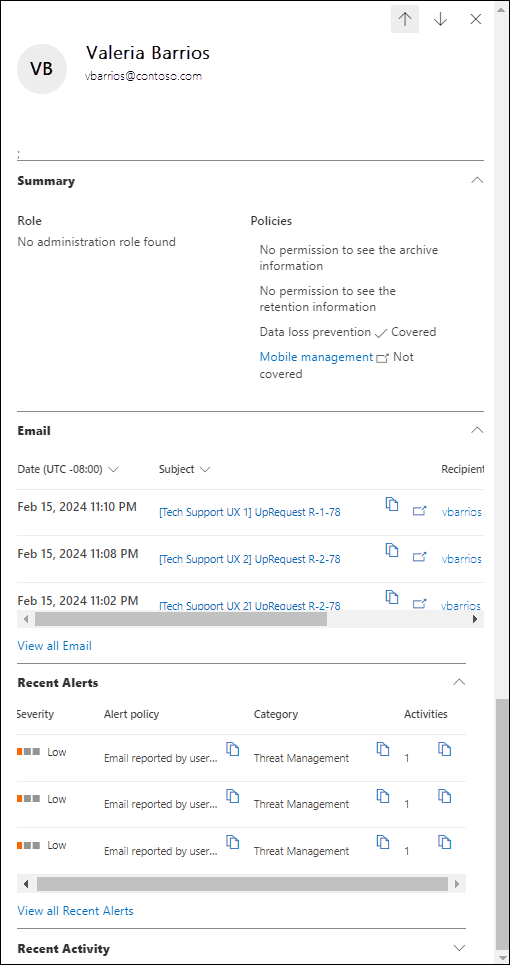
When you select an entry by clicking on the Recipient value, a details flyout opens with the following information:
Tip
To see details about other recipients without leaving the details flyout, use  Previous item and Next item at the top of the flyout.
Summary section:
- Role: Whether the recipient has any admin roles assigned.
- Policies:
- Whether the user has permission to see archive information.
- Whether the user has permission to see retention information.
- Whether the user is covered by data loss prevention (DLP).
- Whether the user is covered by Mobile management at https://portal.office.com/EAdmin/Device/IntuneInventory.aspx.
Email section: A table showing the following related information for messages sent to the recipient:
- Date
- Subject
- Recipient
Select View all email to open Threat Explorer in a new tab filtered by the recipient.
Recent alerts section: A table showing the following related information for related recent alerts:
- Severity
- Alert policy
- Category
- Activities
If there are more than three recent alerts, select View all recent alerts to see all of them.
Recent activity section: Shows the summarized results of an Audit log search for the recipient:
- Date
- IP address
- Activity
- Item
If the recipient has more than three audit log entries, select View all recent activity to see all of them.
Tip
Members of the Security Administrators role group in Email & collaboration permissions can't expand the Recent activity section. You need to be a member of a role group in Exchange Online permissions that has the Audit Logs, Information Protection Analyst, or Information Protection Investigator roles assigned. By default, those roles are assigned to the Records Management, Compliance Management, Information Protection, Information Protection Analysts, Information Protection Investigators, and Organization Management role groups. You can add the members of Security Administrators to those role groups, or you can create a new role group with with the Audit Logs role assigned.
URL clicks view for the details area of the All email view in Threat Explorer
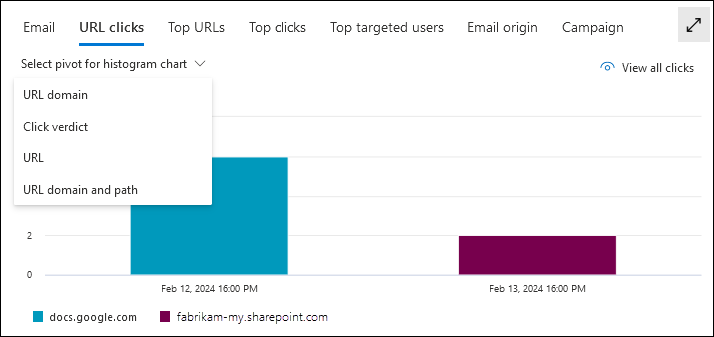
The URL clicks view shows a chart that can be organized using pivots. The chart has a default view, but you can select a value from Select pivot for histogram chart to change how the filtered or unfiltered chart data is organized and displayed.
The chart pivots are described in the following subsections.
Tip
In Threat Explorer, each pivot in URL clicks view has a ![]() View all clicks action that opens the URL clicks view in a new tab.
View all clicks action that opens the URL clicks view in a new tab.
URL domain pivot for the URL clicks view for the details area of the All email view in Threat Explorer
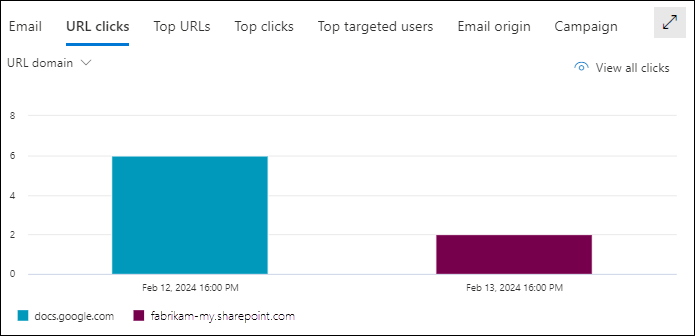
Although this chart pivot doesn't appear to be selected, URL domain is the default chart pivot in the URL clicks view.
The URL domain pivot shows the different domains in URLs in email messages for the specified date/time range and property filters.
Hovering over a data point in the chart shows the count for each URL domain.
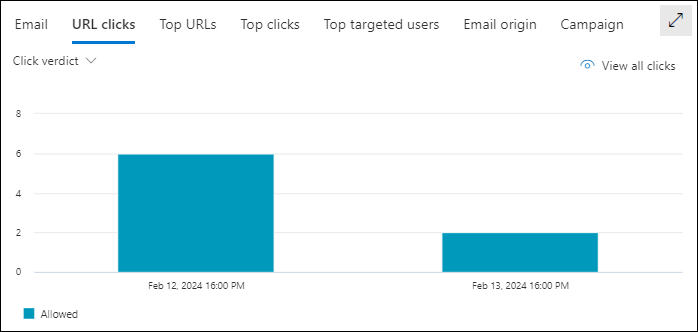
Click verdict pivot for the URL clicks view for the details area of the All email view in Threat Explorer
The Click verdict pivot shows the different verdicts for clicked URLs in email messages for the specified date/time range and property filters.
Hovering over a data point in the chart shows the count for each click verdict.
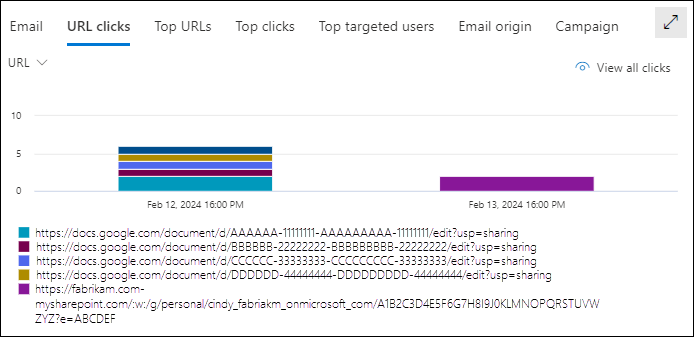
URL pivot for the URL clicks view for the details area of the All email view in Threat Explorer
The URL pivot shows the different URLs that were clicked in email messages for the specified date/time range and property filters.
Hovering over a data point in the chart shows the count for each URL.
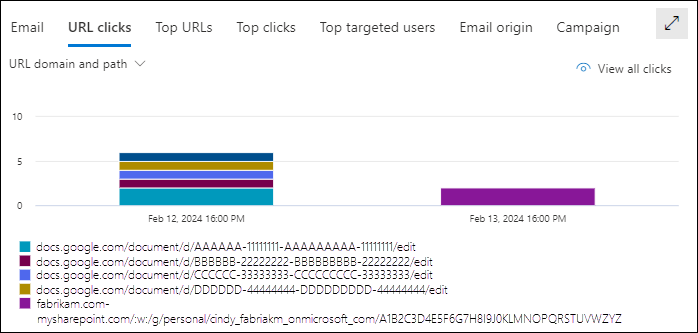
URL domain and path pivot for the URL clicks view for the details area of the All email view in Threat Explorer
The URL domain and path pivot shows the different domains and file paths of URLs that were clicked in email messages for the specified date/time range and property filters.
Hovering over a data point in the chart shows the count for each URL domain and file path.
Top URLs view for the details area of the All email view in Threat Explorer
The Top URLs view shows a details table. You can sort the entries by clicking on an available column header:
- URL
- Messages blocked
- Messages junked
- Messages delivered
Top URLs details for the All email view
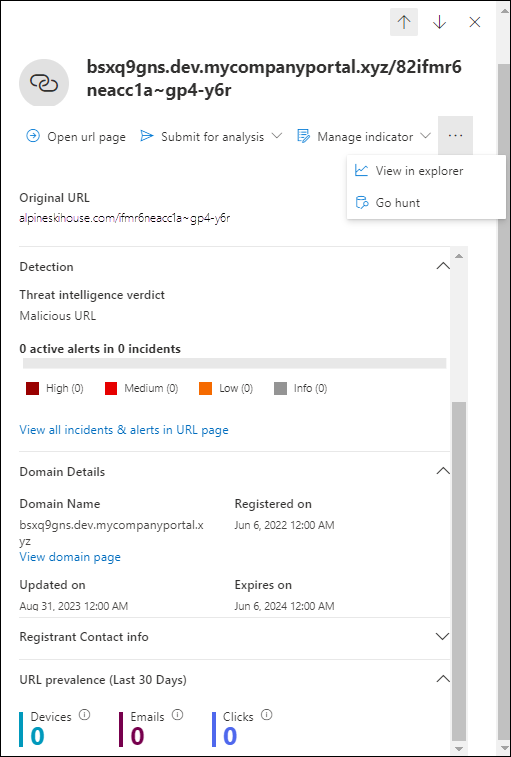
When you select an entry by clicking anywhere in the row other than the check box next to the first column, a details flyout opens with the following information:
Tip
To see details about other URLs without leaving the details flyout, use  Previous item and Next item at the top of the flyout.
- The following actions are available at the top of the flyout:
 Open URL page
 Submit for analysis:
 Report clean
 Report phishing
 Report malware
 Manage indicator:
 Add indicator
 Manage in tenant block list
Selecting any of these options takes you to the Submissions page in the Defender portal.
 More:
More: View in Explorer
 Go hunt
- Original URL
- Detection section:
- Threat intelligence verdict
- x active alerts y incidents: A horizontal bar graph that shows the number of High, Medium, Low, and Info alerts that are related to this link.
- A link to View all incidents & alerts in URL page.
- Domain details section:
- Domain name and a link to View domain page.
- Registrant
- Registered on
- Updated on
- Expires on
- Registrant contact info section:
- Registrar
- Country/Region
- Mailing address
- Phone
- More info: A link to Open at Whois.
- URL prevalence (last 30 days) section: Contains the number of Devices, Email, and Clicks. Select each value to view the full list.
- Devices: Shows the affected devices:
Date (First / Last)
Devices
If more than two devices are involved, select View all devices to see all of them.
Top clicks view for the details area of the All email view in Threat Explorer
The Top clicks view shows a details table. You can sort the entries by clicking on an available column header:
- URL
- Blocked
- Allowed
- Block overridden
- Pending verdict
- Pending verdict bypassed
- None
- Error page
- Failure
Tip
All available columns are selected. If you select ![]() Customize columns, you can't deselect any columns.
Customize columns, you can't deselect any columns.
To see all columns, you likely need to do one or more of the following steps:
- Horizontally scroll in your web browser.
- Narrow the width of appropriate columns.
- Zoom out in your web browser.
When you select an entry by clicking anywhere in the row other than the check box next to the first column, a details flyout opens. The information in the flyout is the same as described in Top URLs details for the All email view.
Top targeted users view for the details area of the All email view in Threat Explorer
The Top targeted users view organizes the data into a table of the top five recipients who were targeted by the most threats. The table contains the following information:
Top targeted users: The recipient's email address. If you select a recipient address, a details flyout opens. The information in the flyout is the same as described in Recipient details from the Email view of the details area in the All email view.
The number of attempts: If you select the number of attempts, Threat Explorer opens in a new tab filtered by the recipient.
Tip
Use ![]() Export to export the list of up to 3000 users and the corresponding attempts.
Export to export the list of up to 3000 users and the corresponding attempts.
Email origin view for the details area of the All email view in Threat Explorer
The Email origin view shows message sources on a map of the world.
Campaign view for the details area of the All email view in Threat Explorer
The Campaign view shows a details table. You can sort the entries by clicking on an available column header.
The information in the table is the same as described in details table on the Campaigns page.
When you select an entry by clicking anywhere in the row other than the check box next to the Name, a details flyout opens. The information in the flyout is the same as described in Campaign details.
Malware view in Threat Explorer and Real-time detections
The Malware view in Threat Explorer and Real-time detections shows information about email messages that were found to contain malware. This view is the default in Real-time detections.
To open the Malware view, do one of the following steps:
- Threat Explorer: On the Explorer page in the Defender portal at https://security.microsoft.com, go to Email & collaboration > Explorer > Malware tab. Or, go directly to the Explorer page using https://security.microsoft.com/threatexplorerv3, and then select the Malware tab.
- Real-time detections: On the Real-time detections page in the Defender portal at https://security.microsoft.com, go to Email & collaboration > Explorer > Malware tab. Or, go directly to the Real-time detections page using https://security.microsoft.com/realtimereportsv3, and then verify that the Malware tab is selected.
Filterable properties in the Malware view in Threat Explorer and Real-time detections
By default, no property filters are applied to the data. The steps to create filters (queries) are described in the Filters in Threat Explorer and Real-time detections section later in this article.
The filterable properties that are available in the Sender address box in the Malware view are described in the following table:
| Property | Type | Threat Explorer |
Real-time detections |
|---|---|---|---|
| Basic | |||
| Sender address | Text. Separate multiple values by commas. | ✔ | ✔ |
| Recipients | Text. Separate multiple values by commas. | ✔ | ✔ |
| Sender domain | Text. Separate multiple values by commas. | ✔ | ✔ |
| Recipient domain | Text. Separate multiple values by commas. | ✔ | ✔ |
| Subject | Text. Separate multiple values by commas. | ✔ | ✔ |
| Sender display name | Text. Separate multiple values by commas. | ✔ | ✔ |
| Sender mail from address | Text. Separate multiple values by commas. | ✔ | ✔ |
| Sender mail from domain | Text. Separate multiple values by commas. | ✔ | ✔ |
| Return path | Text. Separate multiple values by commas. | ✔ | ✔ |
| Return path domain | Text. Separate multiple values by commas. | ✔ | ✔ |
| Malware family | Text. Separate multiple values by commas. | ✔ | ✔ |
| Tags | Text. Separate multiple values by commas. For more information about user tags, see User tags. |
✔ | |
| Exchange transport rule | Text. Separate multiple values by commas. | ✔ | |
| Data loss prevention rule | Text. Separate multiple values by commas. | ✔ | |
| Context | Select one or more values:
|
✔ | |
| Connector | Text (connector name). Separate multiple values by commas. | ✔ | |
| Delivery action | Select one or more values:
|
✔ | ✔ |
| Additional action | Select one or more values:
|
✔ | ✔ |
| Directionality | Select one or more values:
|
✔ | ✔ |
| Detection technology | Select one or more values:
|
✔ | ✔ |
| Original delivery location | Select one or more values:
|
✔ | ✔ |
| Latest delivery location | Same values as Original delivery location | ✔ | ✔ |
| Primary override | Select one or more values:
|
✔ | ✔ |
| Primary override source | Messages can have multiple allow or block overrides as identified in Override source. The override that ultimately allowed or blocked the message is identified in Primary override source. Select one or more values:
|
✔ | ✔ |
| Override source | Same values as Primary override source | ✔ | ✔ |
| Policy type | Select one or more values:
|
✔ | ✔ |
| Policy action | Select one or more values:
|
✔ | ✔ |
| Email size | Integer. Separate multiple values by commas. | ✔ | ✔ |
| Advanced | |||
| Internet Message ID | Text. Separate multiple values by commas. Available in the Message-ID header field in the message header. An example value is <08f1e0f6806a47b4ac103961109ae6ef@server.domain> (note the angle brackets). |
✔ | ✔ |
| Network message ID | Text. Separate multiple values by commas. A GUID value that's available in the X-MS-Exchange-Organization-Network-Message-Id header field in the message header. |
✔ | ✔ |
| Sender IP | Text. Separate multiple values by commas. | ✔ | ✔ |
| Attachment SHA256 | Text. Separate multiple values by commas. | ✔ | ✔ |
| Cluster ID | Text. Separate multiple values by commas. | ✔ | ✔ |
| Alert ID | Text. Separate multiple values by commas. | ✔ | ✔ |
| Alert Policy ID | Text. Separate multiple values by commas. | ✔ | ✔ |
| Campaign ID | Text. Separate multiple values by commas. | ✔ | ✔ |
| ZAP URL signal | Text. Separate multiple values by commas. | ✔ | ✔ |
| Urls | |||
| URL Count | Integer. Separate multiple values by commas. | ✔ | ✔ |
| URL domain | Text. Separate multiple values by commas. | ✔ | ✔ |
| URL domain and path | Text. Separate multiple values by commas. | ✔ | ✔ |
| URL | Text. Separate multiple values by commas. | ✔ | ✔ |
| URL path | Text. Separate multiple values by commas. | ✔ | ✔ |
| URL source | Select one or more values:
|
✔ | ✔ |
| Click verdict | Select one or more values:
|
✔ | ✔ |
| URL Threat | Select one or more values:
|
✔ | ✔ |
| File | |||
| Attachment Count | Integer. Separate multiple values by commas. | ✔ | ✔ |
| Attachment filename | Text. Separate multiple values by commas. | ✔ | ✔ |
| File type | Text. Separate multiple values by commas. | ✔ | ✔ |
| File Extension | Text. Separate multiple values by commas. | ✔ | ✔ |
| File Size | Integer. Separate multiple values by commas. | ✔ | ✔ |
| Authentication | |||
| SPF | Select one or more values:
|
✔ | ✔ |
| DKIM | Select one or more values:
|
✔ | ✔ |
| DMARC | Select one or more values:
|
✔ | ✔ |
| Composite | Select one or more values:
|
Pivots for the chart in the Malware view in Threat Explorer and Real-time Detections
The chart has a default view, but you can select a value from Select pivot for histogram chart to change how the filtered or unfiltered chart data is organized and displayed.
The chart pivots that are available in the Malware view in Threat Explorer and Real-time detections are listed in the following table:
| Pivot | Threat Explorer |
Real-time detections |
|---|---|---|
| Malware family | ✔ | |
| Sender domain | ✔ | |
| Sender IP | ✔ | |
| Delivery action | ✔ | ✔ |
| Threat classification | ✔ | ✔ |
| Detection technology | ✔ | ✔ |
The available chart pivots are described in the following subsections.
Malware family chart pivot in the Malware view in Threat Explorer
Although this pivot doesn't look selected by default, Malware family is the default chart pivot in the Malware view in Threat Explorer.
The Malware family pivot organizes the chart by the malware family detected in messages for the specified date/time range and property filters.
Hovering over a data point in the chart shows the count for each malware family.
Sender domain chart pivot in the Malware view in Threat Explorer
The Sender domain pivot organizes the chart by the sender domain of messages that were found to contain malware for the specified date/time range and property filters.
Hovering over a data point in the chart shows the count for each sender domain.
Sender IP chart pivot in the Malware view in Threat Explorer
The Sender IP pivot organizes the chart by the source IP address of messages that were found to contain malware for the specified date/time range and property filters.
Hovering over a data point in the chart shows the count for each source IP address.
Delivery action chart pivot in the Malware view in Threat Explorer and Real-time detections
Although this pivot doesn't look selected by default, Delivery action is the default chart pivot in the Malware view in Real-time detections.
The Delivery action pivot organizes the chart by what happened to messages that were found to contain malware for the specified date/time range and property filters.
Hovering over a data point in the chart shows the count for each delivery action.
Threat classification chart pivot in the Malware view in Threat Explorer and Real-time detections
The Threat classification pivot organizes the chart by classified threats. For more information, see Threat classification in Microsoft Defender for Office 365.
Hovering over a data point in the chart shows the count for each classification.
Detection technology chart pivot in the Malware view in Threat Explorer and Real-time detections
The Detection technology pivot organizes the chart by the feature that identified malware in messages for the specified date/time range and property filters.
Hovering over a data point in the chart shows the count for each detection technology.
Views for the details area of the Malware view in Threat Explorer and Real-time detections
The available views (tabs) in the details area of the Malware view are listed in the following table, and are described in the following subsections.
| View | Threat Explorer |
Real-time detections |
|---|---|---|
| ✔ | ✔ | |
| Top malware families | ✔ | |
| Top targeted users | ✔ | |
| Email origin | ✔ | |
| Campaign | ✔ |
Email view for the details area of the Malware view in Threat Explorer and Real-time detections
Email is the default view for the details area of the Malware view in Threat Explorer and Real-time detections.
The Email view shows a details table. You can sort the entries by clicking on an available column header. Select ![]() Customize columns to change the columns that are shown.
Customize columns to change the columns that are shown.
The following table shows the columns that are available in Threat Explorer and Real-time detections. The default values are marked with an asterisk (*).
| Column | Threat Explorer |
Real-time detections |
|---|---|---|
| Date* | ✔ | ✔ |
| Subject* | ✔ | ✔ |
| Recipient* | ✔ | ✔ |
| Recipient domain | ✔ | ✔ |
| Tags* | ✔ | |
| Sender address* | ✔ | ✔ |
| Sender display name | ✔ | ✔ |
| Sender domain* | ✔ | ✔ |
| Sender IP | ✔ | ✔ |
| Sender mail from address | ✔ | ✔ |
| Sender mail from domain | ✔ | ✔ |
| Additional actions* | ✔ | ✔ |
| Delivery action | ✔ | ✔ |
| Latest delivery location* | ✔ | ✔ |
| Original delivery location* | ✔ | ✔ |
| System overrides source | ✔ | ✔ |
| System overrides | ✔ | ✔ |
| Alert ID | ✔ | ✔ |
| Internet message ID | ✔ | ✔ |
| Network message ID | ✔ | ✔ |
| Mail language | ✔ | ✔ |
| Exchange transport rule | ✔ | |
| Connector | ✔ | |
| Context | ✔ | ✔ |
| Data loss prevention rule | ✔ | ✔ |
| Threat type* | ✔ | ✔ |
| Detection technology | ✔ | ✔ |
| Threat classification | ✔ | ✔ |
| Attachment Count | ✔ | ✔ |
| URL Count | ✔ | ✔ |
| Email size | ✔ | ✔ |
Tip
To see all columns, you likely need to do one or more of the following steps:
- Horizontally scroll in your web browser.
- Narrow the width of appropriate columns.
- Remove columns from the view.
- Zoom out in your web browser.
Customized column settings are saved per user. Customized column settings in Incognito or InPrivate browsing mode are saved until you close the web browser.
When you select one or more entries from the list by selecting the check box next to the first column, the ![]() Take action is available. For information, see Threat hunting: Email remediation.
Take action is available. For information, see Threat hunting: Email remediation.
When you click on the Subject or Recipient values in an entry, details flyouts open. These flyouts are described in the following subsections.
Email details from the Email view of the details area in the Malware view
When you select the Subject value of an entry in the table, an email details flyout opens. This details flyout is known as the Email summary panel and contains standardized summary information that's also available on the Email entity page for the message.
For details about the information in the Email summary panel, see The Email summary panels.
The available actions at the top of the Email summary panel for Threat Explorer and Real-time detections are described in the Email details from the Email view of the details area in the All email view.
Recipient details from the Email view of the details area in the Malware view
When you select an entry by clicking on the Recipient value, a details flyout opens. The information in the flyout is the same as described in Recipient details from the Email view of the details area in the All email view.
Top malware families view for the details area of the Malware view in Threat Explorer
The Top malware families view for the details area organizes the data into a table of the top malware families. The table shows:
Top malware families column: The malware family name.
If you select a malware family name, a details flyout opens that contains the following information:
Email section: A table showing the following related information for messages that contain the malware file:
- Date
- Subject
- Recipient
Select View all email to open Threat Explorer in a new tab filtered by the malware family name.
Technical details section
The number of attempts: If you select the number of attempts, Threat Explorer opens in a new tab filtered by the malware family name.
Top targeted users view for the details area of the Malware view in Threat Explorer
The Top targeted users view organizes the data into a table of the top five recipients who were targeted by malware. The table shows:
Top targeted users: The email address of the top targeted user. If you select an email address, a details flyout opens. The information in the flyout is the same as described in Top targeted users view for the details area of the All email view in Threat Explorer.
The number of attempts: If you select the number of attempts, Threat Explorer opens in a new tab filtered by the malware family name.
Tip
Use ![]() Export to export the list of up to 3000 users and the corresponding attempts.
Export to export the list of up to 3000 users and the corresponding attempts.
Email origin view for the details area of the Malware view in Threat Explorer
The Email origin view shows message sources on a map of the world.
Campaign view for the details area of the Malware view in Threat Explorer
The Campaign view shows a details table. You can sort the entries by clicking on an available column header.
The details table is identical to the details table on the Campaigns page.
When you select an entry by clicking anywhere in the row other than the check box next to the Name, a details flyout opens. The information in the flyout is the same as described in Campaign details.
Phish view in Threat Explorer and Real-time detections
The Phish view in Threat Explorer and Real-time detections shows information about email messages that were identified as phishing.
To open the Phish view, do one of the following steps:
- Threat Explorer: On the Explorer page in the Defender portal at https://security.microsoft.com, go to Email & collaboration > Explorer > Phish tab. Or, go directly to the Explorer page using https://security.microsoft.com/threatexplorerv3, and then select the Phish tab.
- Real-time detections: On the Real-time detections page in the Defender portal at https://security.microsoft.com, go to Email & collaboration > Explorer > Phish tab. Or, go directly to the Real-time detections page using https://security.microsoft.com/realtimereportsv3, and then select the Phish tab.
Filterable properties in the Phish view in Threat Explorer and Real-time detections
By default, no property filters are applied to the data. The steps to create filters (queries) are described in the Filters in Threat Explorer and Real-time detections section later in this article.
The filterable properties that are available in the Sender address box in the Malware view are described in the following table:
| Property | Type | Threat Explorer |
Real-time detections |
|---|---|---|---|
| Basic | |||
| Sender address | Text. Separate multiple values by commas. | ✔ | ✔ |
| Recipients | Text. Separate multiple values by commas. | ✔ | ✔ |
| Sender domain | Text. Separate multiple values by commas. | ✔ | ✔ |
| Recipient domain | Text. Separate multiple values by commas. | ✔ | ✔ |
| Subject | Text. Separate multiple values by commas. | ✔ | ✔ |
| Sender display name | Text. Separate multiple values by commas. | ✔ | ✔ |
| Sender mail from address | Text. Separate multiple values by commas. | ✔ | ✔ |
| Sender mail from domain | Text. Separate multiple values by commas. | ✔ | ✔ |
| Return path | Text. Separate multiple values by commas. | ✔ | ✔ |
| Return path domain | Text. Separate multiple values by commas. | ✔ | ✔ |
| Tags | Text. Separate multiple values by commas. For more information about user tags, see User tags. |
✔ | |
| Impersonated domain | Text. Separate multiple values by commas. | ✔ | ✔ |
| Impersonated user | Text. Separate multiple values by commas. | ✔ | ✔ |
| Exchange transport rule | Text. Separate multiple values by commas. | ✔ | |
| Data loss prevention rule | Text. Separate multiple values by commas. | ✔ | |
| Context | Select one or more values:
|
✔ | |
| Connector | Text (connector name). Separate multiple values by commas. | ✔ | |
| Delivery action | Select one or more values:
|
✔ | ✔ |
| Additional action | Select one or more values:
|
✔ | ✔ |
| Directionality | Select one or more values:
|
✔ | ✔ |
| Detection technology | Select one or more values:
|
✔ | ✔ |
| Threat classification | Select one or more values:
|
✔ | ✔ |
| Original delivery location | Select one or more values:
|
✔ | ✔ |
| Latest delivery location | Same values as Original delivery location | ✔ | ✔ |
| Phish confidence level | Select one or more values:
|
✔ | |
| Primary override | Select one or more values:
|
✔ | ✔ |
| Primary override source | Messages can have multiple allow or block overrides as identified in Override source. The override that ultimately allowed or blocked the message is identified in Primary override source. Select one or more values:
|
✔ | ✔ |
| Override source | Same values as Primary override source | ✔ | ✔ |
| Policy type | Select one or more values:
|
✔ | ✔ |
| Policy action | Select one or more values:
|
✔ | ✔ |
| Email size | Integer. Separate multiple values by commas. | ✔ | ✔ |
| Advanced | |||
| Internet Message ID | Text. Separate multiple values by commas. Available in the Message-ID header field in the message header. An example value is <08f1e0f6806a47b4ac103961109ae6ef@server.domain> (note the angle brackets). |
✔ | ✔ |
| Network message ID | Text. Separate multiple values by commas. A GUID value that's available in the X-MS-Exchange-Organization-Network-Message-Id header field in the message header. |
✔ | ✔ |
| Sender IP | Text. Separate multiple values by commas. | ✔ | ✔ |
| Attachment SHA256 | Text. Separate multiple values by commas. | ✔ | ✔ |
| Cluster ID | Text. Separate multiple values by commas. | ✔ | ✔ |
| Alert ID | Text. Separate multiple values by commas. | ✔ | ✔ |
| Alert Policy ID | Text. Separate multiple values by commas. | ✔ | ✔ |
| Campaign ID | Text. Separate multiple values by commas. | ✔ | ✔ |
| ZAP URL signal | Text. Separate multiple values by commas. | ✔ | |
| Urls | |||
| URL Count | Integer. Separate multiple values by commas. | ✔ | ✔ |
| URL domain | Text. Separate multiple values by commas. | ✔ | ✔ |
| URL domain and path | Text. Separate multiple values by commas. | ✔ | |
| URL | Text. Separate multiple values by commas. | ✔ | |
| URL path | Text. Separate multiple values by commas. | ✔ | |
| URL source | Select one or more values:
|
✔ | ✔ |
| Click verdict | Select one or more values:
|
✔ | ✔ |
| URL Threat | Select one or more values:
|
✔ | ✔ |
| File | |||
| Attachment Count | Integer. Separate multiple values by commas. | ✔ | ✔ |
| Attachment filename | Text. Separate multiple values by commas. | ✔ | ✔ |
| File type | Text. Separate multiple values by commas. | ✔ | ✔ |
| File Extension | Text. Separate multiple values by commas. | ✔ | ✔ |
| File Size | Integer. Separate multiple values by commas. | ✔ | ✔ |
| Authentication | |||
| SPF | Select one or more values:
|
✔ | ✔ |
| DKIM | Select one or more values:
|
✔ | ✔ |
| DMARC | Select one or more values:
|
✔ | ✔ |
| Composite | Select one or more values:
|
Pivots for the chart in the Phish view in Threat Explorer and Real-time Detections
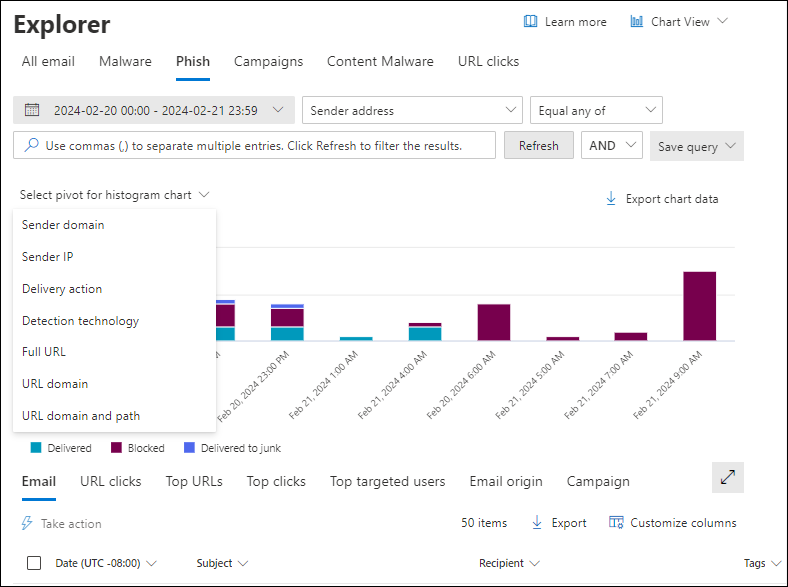
The chart has a default view, but you can select a value from Select pivot for histogram chart to change how the filtered or unfiltered chart data is organized and displayed.
The chart pivots that are available in the Phish view in Threat Explorer and Real-time detections are listed in the following table:
| Pivot | Threat Explorer |
Real-time detections |
|---|---|---|
| Sender domain | ✔ | ✔ |
| Sender IP | ✔ | |
| Delivery action | ✔ | ✔ |
| Detection technology | ✔ | ✔ |
| Threat classification | ✔ | ✔ |
| Full URL | ✔ | |
| URL domain | ✔ | ✔ |
| URL domain and path | ✔ |
The available chart pivots are described in the following subsections.
Sender domain chart pivot in the Phish view in Threat Explorer and Real-time detections
Although this pivot doesn't look selected by default, Sender domain is the default chart pivot in the Phish view in Real-time detections.
The Sender domain pivot organizes the chart by the domains in messages for the specified date/time range and property filters.
Hovering over a data point in the chart shows the count for each sender domain.
Sender IP chart pivot in the Phish view in Threat Explorer
The Sender IP pivot organizes the chart by the source IP addresses of messages for the specified date/time range and property filters.
Hovering over a data point in the chart shows the count for each source IP address.
Delivery action chart pivot in the Phish view in Threat Explorer and Real-time detections
Although this pivot doesn't look selected by default, Delivery action is the default chart pivot in the Phish view in Threat Explorer.
The Delivery action pivot organizes the chart by the actions taken on messages for the specified date/time range and property filters.
Hovering over a data point in the chart shows the count for each delivery action.
Detection technology chart pivot in the Phish view in Threat Explorer and Real-time detections
The Detection technology pivot organizes the chart by the feature that identified the phishing messages for the specified date/time range and property filters.
Hovering over a data point in the chart shows the count for each detection technology.
Threat classification chart pivot in the Phish view in Threat Explorer and Real-time detections
The Threat classification pivot organizes the chart by classified threats. For more information, see Threat classification in Microsoft Defender for Office 365.
Hovering over a data point in the chart shows the count for each classification.
Full URL chart pivot in the Phish view in Threat Explorer
The Full URL pivot organizes the chart by the full URLs in phishing messages for the specified date/time range and property filters.
Hovering over a data point in the chart shows the count for each full URL.
URL domain chart pivot in the Phish view in Threat Explorer and Real-time detections
The URL domain pivot organizes the chart by the domains in URLs in phishing messages for the specified date/time range and property filters.
Hovering over a data point in the chart shows the count for each URL domain.
URL domain and path chart pivot in the Phish view in Threat Explorer
The URL domain and path pivot organizes the chart by the domains and paths in URLs in phishing messages for the specified date/time range and property filters.
Hovering over a data point in the chart shows the count for each URL domain and path.
Views for the details area of the Phish view in Threat Explorer
The available views (tabs) in the details area of the Phish view are listed in the following table, and are described in the following subsections.
| View | Threat Explorer |
Real-time detections |
|---|---|---|
| ✔ | ✔ | |
| URL clicks | ✔ | ✔ |
| Top URLs | ✔ | ✔ |
| Top clicks | ✔ | ✔ |
| Top targeted users | ✔ | |
| Email origin | ✔ | |
| Campaign | ✔ |
Email view for the details area of the Phish view in Threat Explorer and Real-time detections
Email is the default view for the details area of the Phish view in Threat Explorer and Real-time detections.
The Email view shows a details table. You can sort the entries by clicking on an available column header. Select ![]() Customize columns to change the columns that are shown.
Customize columns to change the columns that are shown.
The following table shows the columns that are available in Threat Explorer and Real-time detections. The default values are marked with an asterisk (*).
| Column | Threat Explorer |
Real-time detections |
|---|---|---|
| Date* | ✔ | ✔ |
| Subject* | ✔ | ✔ |
| Recipient* | ✔ | ✔ |
| Recipient domain | ✔ | ✔ |
| Tags* | ✔ | |
| Sender address* | ✔ | ✔ |
| Sender display name | ✔ | ✔ |
| Sender domain* | ✔ | ✔ |
| Sender IP | ✔ | ✔ |
| Sender mail from address | ✔ | ✔ |
| Sender mail from domain | ✔ | ✔ |
| Additional actions* | ✔ | ✔ |
| Delivery action | ✔ | ✔ |
| Latest delivery location* | ✔ | ✔ |
| Original delivery location* | ✔ | ✔ |
| System overrides source | ✔ | ✔ |
| System overrides | ✔ | ✔ |
| Alert ID | ✔ | ✔ |
| Internet message ID | ✔ | ✔ |
| Network message ID | ✔ | ✔ |
| Mail language | ✔ | ✔ |
| Exchange transport rule | ✔ | |
| Connector | ✔ | |
| Phish confidence level | ✔ | |
| Context | ✔ | |
| Data loss prevention rule | ✔ | |
| Threat type* | ✔ | ✔ |
| Detection technology | ✔ | ✔ |
| Threat classification | ✔ | ✔ |
| Attachment Count | ✔ | ✔ |
| URL Count | ✔ | ✔ |
| Email size | ✔ | ✔ |
Tip
To see all columns, you likely need to do one or more of the following steps:
- Horizontally scroll in your web browser.
- Narrow the width of appropriate columns.
- Remove columns from the view.
- Zoom out in your web browser.
Customized column settings are saved per user. Customized column settings in Incognito or InPrivate browsing mode are saved until you close the web browser.
When you select one or more entries from the list by selecting the check box next to the first column, the ![]() Take action is available. For information, see Threat hunting: Email remediation.
Take action is available. For information, see Threat hunting: Email remediation.
When you click on the Subject or Recipient values in an entry, details flyouts open. These flyouts are described in the following subsections.
Email details from the Email view of the details area in the Phish view
When you select the Subject value of an entry in the table, an email details flyout opens. This details flyout is known as the Email summary panel and contains standardized summary information that's also available on the Email entity page for the message.
For details about the information in the Email summary panel, see The Email summary panel in Defender for Office 365 features.
The available actions at the top of the Email summary panel for Threat Explorer and Real-time detections are described in the Email details from the Email view of the details area in the All email view.
Recipient details from the Email view of the details area in the Phish view
When you select an entry by clicking on the Recipient value, a details flyout opens. The information in the flyout is the same as described in Recipient details from the Email view of the details area in the All email view.
URL clicks view for the details area of the Phish view in Threat Explorer and Real-time detections
The URL clicks view shows a chart that can be organized using pivots. The chart has a default view, but you can select a value from Select pivot for histogram chart to change how the filtered or unfiltered chart data is organized and displayed.
The chart pivots that are available in the Malware view in Threat Explorer and Real-time detections are described in the following table:
| Pivot | Threat Explorer |
Real-time detections |
|---|---|---|
| URL domain | ✔ | ✔ |
| Click verdict | ✔ | ✔ |
| URL | ✔ | |
| URL domain and path | ✔ |
The same chart pivots are available and described for the All email view in Threat Explorer:
- URL domain pivot for the URL clicks view for the details area of the All email view in Threat Explorer
- Click verdict pivot for the URL clicks view for the details area of the All email view in Threat Explorer
- URL pivot for the URL clicks view for the details area of the All email view in Threat Explorer
- URL domain and path pivot for the URL clicks view for the details area of the All email view in Threat Explorer
Tip
In Threat Explorer, each pivot in URL clicks view has a ![]() View all clicks action that opens the URL clicks view in Threat Explorer in a new tab. This action isn't available in Real-time detections, because the URL clicks view isn't available in Real-time detections.
View all clicks action that opens the URL clicks view in Threat Explorer in a new tab. This action isn't available in Real-time detections, because the URL clicks view isn't available in Real-time detections.
Top URLs view for the details area of the Phish view in Threat Explorer and Real-time detections
The Top URLs view shows a details table. You can sort the entries by clicking on an available column header:
- URL
- Messages blocked
- Messages junked
- Messages delivered
Top URLs details for the Phish view
When you select an entry by clicking anywhere in the row other than the check box next to the first column, a details flyout opens. The information in the flyout is the same as described in Top URLs details for the All email view.
Tip
The ![]() Go hunt action is available only in Threat Explorer. It isn't available in Real-time detections.
Go hunt action is available only in Threat Explorer. It isn't available in Real-time detections.
Top clicks view for the details area of the Phish view in Threat Explorer and Real-time detections
The Top clicks view shows a details table. You can sort the entries by clicking on an available column header:
- URL
- Blocked
- Allowed
- Block overridden
- Pending verdict
- Pending verdict bypassed
- None
- Error page
- Failure
Tip
All available columns are selected. If you select ![]() Customize columns, you can't deselect any columns.
Customize columns, you can't deselect any columns.
To see all columns, you likely need to do one or more of the following steps:
- Horizontally scroll in your web browser.
- Narrow the width of appropriate columns.
- Zoom out in your web browser.
When you select an entry by clicking anywhere in the row other than the check box next to the first column, a details flyout opens. The information in the flyout is the same as described in Top URLs details for the All email view.
Top targeted users view for the details area of the Phish view in Threat Explorer
The Top targeted users view organizes the data into a table of the top five recipients who were targeted by phishing attempts. The table shows:
Top targeted users: The email address of the top targeted user. If you select an email address, a details flyout opens. The information in the flyout is the same as described in Top targeted users view for the details area of the All email view in Threat Explorer.
The number of attempts: If you select the number of attempts, Threat Explorer opens in a new tab filtered by the malware family name.
Tip
Use ![]() Export to export the list of up to 3000 users and the corresponding attempts.
Export to export the list of up to 3000 users and the corresponding attempts.
Email origin view for the details area of the Phish view in Threat Explorer
The Email origin view shows message sources on a map of the world.
Campaign view for the details area of the Phish view in Threat Explorer
The Campaign view shows a details table. You can sort the entries by clicking on an available column header.
The information in the table is the same as described in details table on the Campaigns page.
When you select an entry by clicking anywhere in the row other than the check box next to the Name, a details flyout opens. The information in the flyout is the same as described in Campaign details.
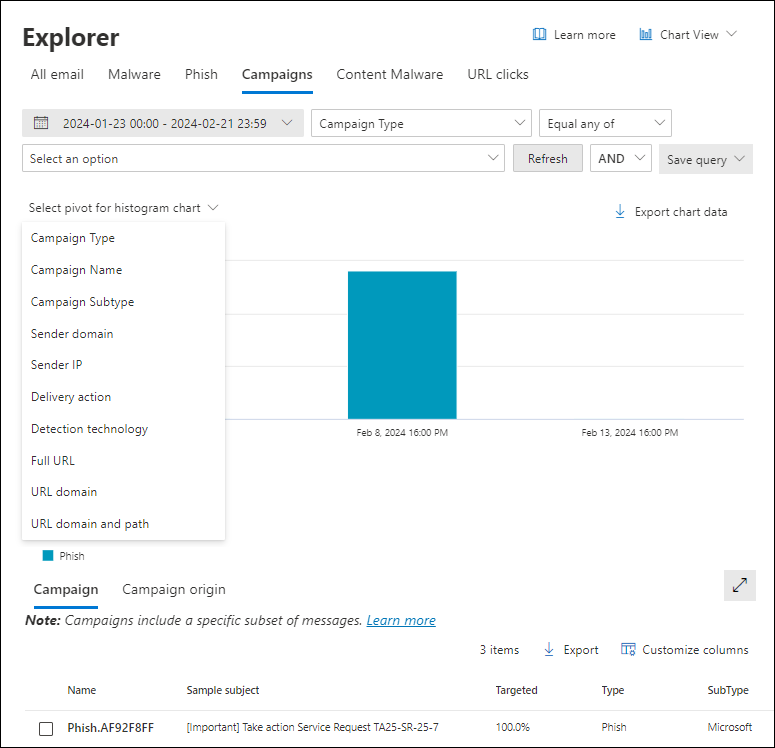
Campaigns view in Threat Explorer
The Campaigns view in Threat Explorer shows information about threats that were identified as coordinated phishing and malware attacks, either specific to your organization, or to other organizations in Microsoft 365.
To open the Campaigns view on the Explorer page in the Defender portal at https://security.microsoft.com, go to Email & collaboration > Explorer > Campaigns tab. Or, go directly to the Explorer page using https://security.microsoft.com/threatexplorerv3, and then select the Campaigns tab.
All of the available information and actions are identical to the information and actions on the Campaigns page at https://security.microsoft.com/campaignsv3. For more information, see Campaigns page in the Microsoft Defender portal.
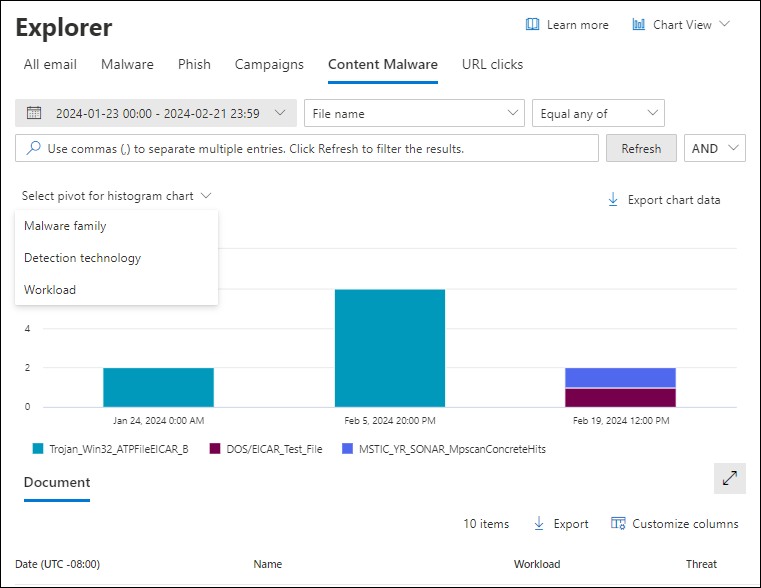
Content malware view in Threat Explorer and Real-time detections
The Content malware view in Threat Explorer and Real-time detections shows information about files that were identified as malware by:
- Built-in virus protection in SharePoint, OneDrive, and Microsoft Teams
- Safe Attachments for SharePoint, OneDrive, and Microsoft Teams.
To open the Content malware view, do one of the following steps:
- Threat Explorer: On the Explorer page in the Defender portal at https://security.microsoft.com, go to Email & collaboration > Explorer > Content malware tab. Or, go directly to the Explorer page using https://security.microsoft.com/threatexplorerv3, and then select the Content malware tab.
- Real-time detections: On the Real-time detections page in the Defender portal at https://security.microsoft.com, go to Email & collaboration > Explorer > Content malware tab. Or, go directly to the Real-time detections page using https://security.microsoft.com/realtimereportsv3, and then select the Content malware tab.
Filterable properties in the Content malware view in Threat Explorer and Real-time detections
By default, no property filters are applied to the data. The steps to create filters (queries) are described in the Filters in Threat Explorer and Real-time detections section later in this article.
The filterable properties that are available in the File name box in the Content malware view in Threat Explorer and Real-time detections are described in the following table:
| Property | Type | Threat Explorer |
Real-time detections |
|---|---|---|---|
| File | |||
| File name | Text. Separate multiple values by commas. | ✔ | ✔ |
| Workload | Select one or more values:
|
✔ | ✔ |
| Site | Text. Separate multiple values by commas. | ✔ | ✔ |
| File owner | Text. Separate multiple values by commas. | ✔ | ✔ |
| Last modified by | Text. Separate multiple values by commas. | ✔ | ✔ |
| SHA256 | Integer. Separate multiple values by commas. To find the SHA256 hash value of a file, run the following command in PowerShell: Get-FileHash -Path "<Path>\<Filename>" -Algorithm SHA256. |
✔ | ✔ |
| Malware family | Text. Separate multiple values by commas. | ✔ | ✔ |
| Detection technology | Select one or more values:
|
✔ | ✔ |
| Threat type | Select one or more values:
|
✔ | ✔ |
Pivots for the chart in the Content malware view in Threat Explorer and Real-time Detections
The chart has a default view, but you can select a value from Select pivot for histogram chart to change how the filtered or unfiltered chart data is organized and displayed.
The chart pivots that are available in the Content malware view in Threat Explorer and Real-time detections are listed in the following table:
| Pivot | Threat Explorer |
Real-time detections |
|---|---|---|
| Malware family | ✔ | ✔ |
| Detection technology | ✔ | ✔ |
| Workload | ✔ | ✔ |
The available chart pivots are described in the following subsections.
Malware family chart pivot in the Content malware view in Threat Explorer and Real-time detections
Although this pivot doesn't look selected by default, Malware family is the default chart pivot in the Content malware view in Threat Explorer and Real-time detections.
The Malware family pivot organizes the chart by the malware identified in files in SharePoint, OneDrive, and Microsoft Teams using the specified date/time range and property filters.
Hovering over a data point in the chart shows the count for each malware family.
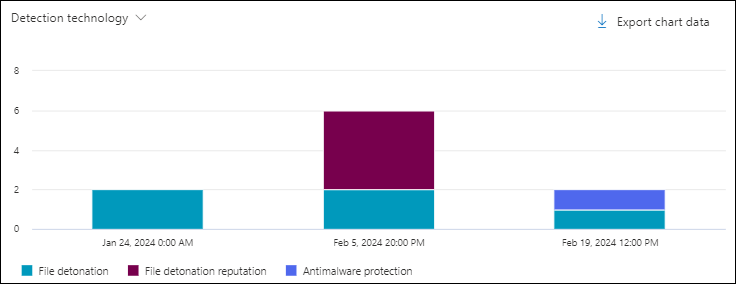
Detection technology chart pivot in the Content malware view in Threat Explorer and Real-time detections
The Detection technology pivot organizes the chart by the feature that identified malware in files in SharePoint, OneDrive, and Microsoft Teams for the specified date/time range and property filters.
Hovering over a data point in the chart shows the count for each detection technology.
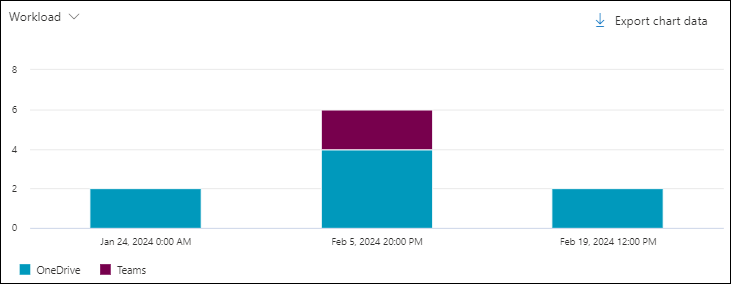
Workload chart pivot in the Content malware view in Threat Explorer and Real-time detections
The Workload pivot organizes the chart by where the malware was identified (SharePoint, OneDrive, or Microsoft Teams) for the specified date/time range and property filters.
Hovering over a data point in the chart shows the count for each workload.
Views for the details area of the Content malware view in Threat Explorer and Real-time detections
In Threat Explorer and Real-time detections, the details area of the Content malware view contains only one view (tab) named Documents. This view is described in the following subsection.
Document view for the details area of the Content malware view in Threat Explorer and Real-time detections
Document is the default and only view for the details area in the Content malware view.
The Document view shows a details table. You can sort the entries by clicking on an available column header. Select ![]() Customize columns to change the columns that are shown. The default values are marked with an asterisk (*):
Customize columns to change the columns that are shown. The default values are marked with an asterisk (*):
- Date*
- Name*
- Workload*
- Threat*
- Detection technology*
- Last modifying user*
- File owner*
- Size (bytes)*
- Last modified time
- Site path
- File path
- Document ID
- SHA256
- Detected date
- Malware family
- Context
Tip
To see all columns, you likely need to do one or more of the following steps:
- Horizontally scroll in your web browser.
- Narrow the width of appropriate columns.
- Remove columns from the view.
- Zoom out in your web browser.
Customized column settings are saved per user. Customized column settings in Incognito or InPrivate browsing mode are saved until you close the web browser.
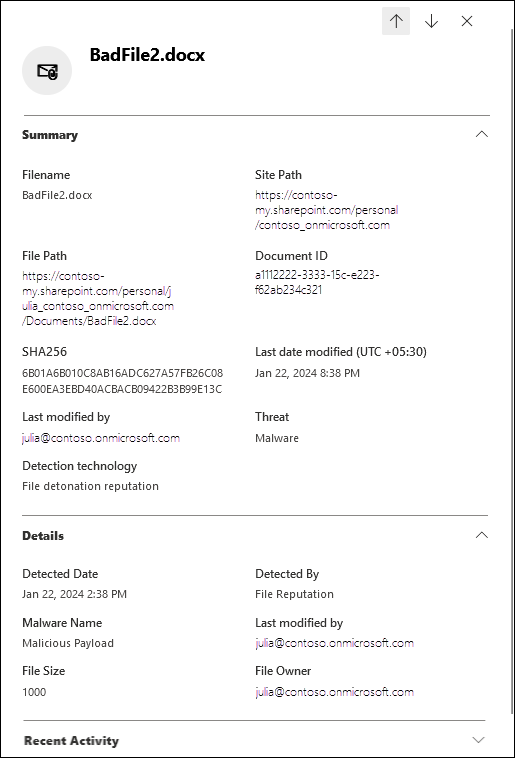
When you select a filename value from the Name column, a details flyout opens. The flyout contains the following information:
Summary section:
- Filename
- Site path
- File path
- Document ID
- SHA256
- Last date modified
- Last modified by
- Threat
- Detection technology
Details section:
- Detected date
- Detected by
- Malware name
- Last modified by
- File size
- File owner
Email list section: A table showing the following related information for messages that contain the malware file:
- Date
- Subject
- Recipient
Select View all email to open Threat Explorer in a new tab filtered by the malware family name.
Recent activity: Shows the summarized results of an Audit log search for the recipient:
- Date
- IP address
- Activity
- Item
If the recipient has more than three audit log entries, select View all recent activity to see all of them.
Tip
Members of the Security Administrators role group in Email & collaboration permissions can't expand the Recent activity section. You need to be a member of a role group in Exchange Online permissions that has the Audit Logs, Information Protection Analyst, or Information Protection Investigator roles assigned. By default, those roles are assigned to the Records Management, Compliance Management, Information Protection, Information Protection Analysts, Information Protection Investigators, and Organization Management role groups. You can add the members of Security Administrators to those role groups, or you can create a new role group with with the Audit Logs role assigned.
URL clicks view in Threat Explorer
The URL clicks view in Threat Explorer shows all user clicks on URLs in email, in supported Office files in SharePoint and OneDrive, and in Microsoft Teams.
To open the URL clicks view on the Explorer page in the Defender portal at https://security.microsoft.com, go to Email & collaboration > Explorer > URL clicks tab. Or, go directly to the Explorer page using https://security.microsoft.com/threatexplorerv3, and then select the URL clicks tab.
Filterable properties in the URL clicks view in Threat Explorer
By default, no property filters are applied to the data. The steps to create filters (queries) are described in the Filters in Threat Explorer and Real-time detections section later in this article.
The filterable properties that are available in the Recipients box in the URL clicks view in Threat Explorer are described in the following table:
| Property | Type |
|---|---|
| Basic | |
| Recipients | Text. Separate multiple values by commas. |
| Tags | Text. Separate multiple values by commas. For more information about user tags, see User tags. |
| Network message ID | Text. Separate multiple values by commas. A GUID value that's available in the X-MS-Exchange-Organization-Network-Message-Id header field in the message header. |
| URL | Text. Separate multiple values by commas. |
| Click action | Select one or more values:
|
| Threat type | Select one or more values:
|
| Detection technology | Select one or more values:
|
| Click ID | Text. Separate multiple values by commas. |
| Client IP | Text. Separate multiple values by commas. |
Pivots for the chart in the URL clicks view in Threat Explorer
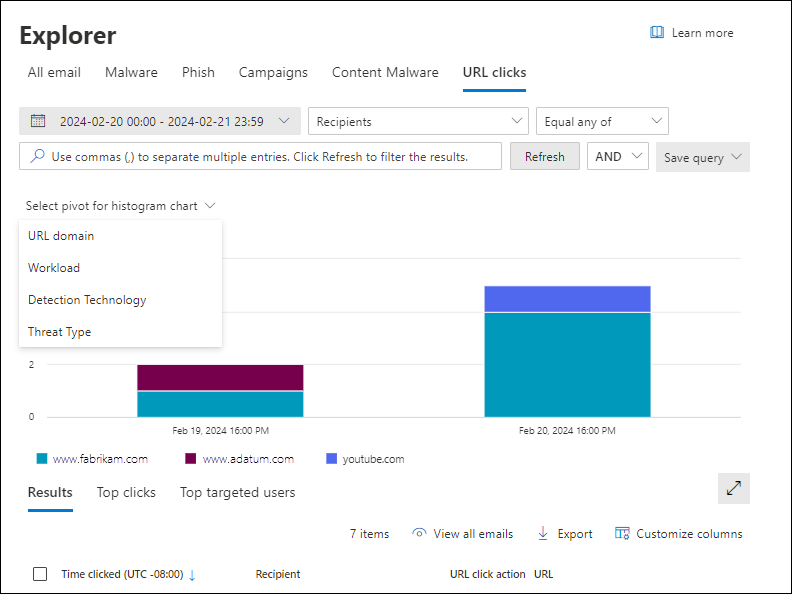
The chart has a default view, but you can select a value from Select pivot for histogram chart to change how the filtered or unfiltered chart data is organized and displayed.
The available chart pivots are described in the following subsections.
URL domain chart pivot in the URL clicks view in Threat Explorer
Although this pivot doesn't look selected by default, URL domain is the default chart pivot in the URL clicks view.
The URL domain pivot organizes the chart by the domains in URLs that users clicked in email, Office files, or Microsoft Teams for the specified date/time range and property filters.
Hovering over a data point in the chart shows the count for each URL domain.
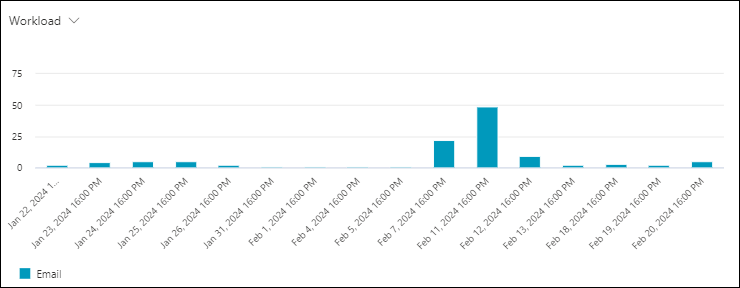
Workload chart pivot in the URL clicks view in Threat Explorer
The Workload pivot organizes the chart by the location of the clicked URL (email, Office files, or Microsoft Teams) for the specified date/time range and property filters.
Hovering over a data point in the chart shows the count for each workload.
Detection technology chart pivot in the URL clicks view in Threat Explorer
The Detection technology pivot organizes the chart by the feature that identified the URL clicks in email, Office files, or Microsoft Teams for the specified date/time range and property filters.
Hovering over a data point in the chart shows the count for each detection technology.
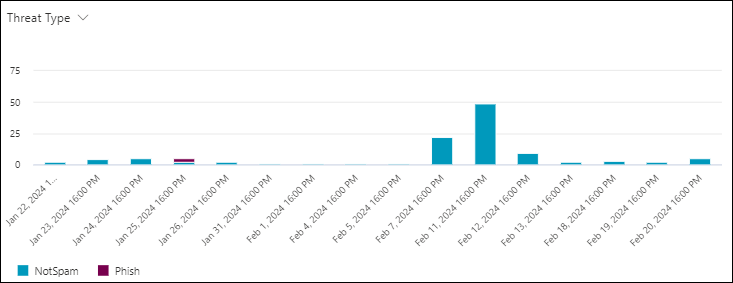
Threat type chart pivot in the URL clicks view in Threat Explorer
The Threat type pivot organizes the chart by the results for clicked URLs in email, Office files, or Microsoft Teams for the specified date/time range and property filters.
Hovering over a data point in the chart shows the count for each threat type technology.
Views for the details area of the URL clicks view in Threat Explorer
The available views (tabs) in the details area of the URL clicks view are described in the following subsections.
Results view for the details area of the URL clicks view in Threat Explorer
Results is the default view for the details area in the URL clicks view.
The Results view shows a details table. You can sort the entries by clicking on an available column header. Select ![]() Customize columns to change the columns that are shown. By default, all columns are selected:
Customize columns to change the columns that are shown. By default, all columns are selected:
- Time clicked
- Recipient
- URL click action
- URL
- Tags
- Network message ID
- Click ID
- Client IP
- URL chain
- Threat type
- Detection technology
Tip
To see all columns, you likely need to do one or more of the following steps:
- Horizontally scroll in your web browser.
- Narrow the width of appropriate columns.
- Remove columns from the view.
- Zoom out in your web browser.
Customized column settings are saved per user. Customized column settings in Incognito or InPrivate browsing mode are saved until you close the web browser.
Select one or entries by selecting the check box next to the first column in the row, and then select ![]() View all emails to open Threat Explorer in All email view in a new tab filtered by the Network message ID values of the selected messages.
View all emails to open Threat Explorer in All email view in a new tab filtered by the Network message ID values of the selected messages.
Top clicks view for the details area of the URL clicks view in Threat Explorer
The Top clicks view shows a details table. You can sort the entries by clicking on an available column header:
- URL
- Blocked
- Allowed
- Block overridden
- Pending verdict
- Pending verdict bypassed
- None
- Error page
- Failure
Tip
All available columns are selected. If you select ![]() Customize columns, you can't deselect any columns.
Customize columns, you can't deselect any columns.
To see all columns, you likely need to do one or more of the following steps:
- Horizontally scroll in your web browser.
- Narrow the width of appropriate columns.
- Zoom out in your web browser.
Select an entry by selecting the check box next to the first column in the row, and then select ![]() View all clicks to open Threat Explorer in a new tab in URL clicks view.
View all clicks to open Threat Explorer in a new tab in URL clicks view.
When you select an entry by clicking anywhere in the row other than the check box next to the first column, a details flyout opens. The information in the flyout is the same as described in Top URLs details for the All email view.
Top targeted users view for the details area of the URL clicks view in Threat Explorer
The Top targeted users view organizes the data into a table of the top five recipients who clicked on URLs. The table shows:
Top targeted users: The email address of the top targeted user. If you select an email address, a details flyout opens. The information in the flyout is the same as described in Top targeted users view for the details area of the All email view in Threat Explorer.
The number of attempts: If you select the number of attempts, Threat Explorer opens in a new tab filtered by the malware family name.
Tip
Use ![]() Export to export the list of up to 3000 users and the corresponding attempts.
Export to export the list of up to 3000 users and the corresponding attempts.
Property filters in Threat Explorer and Real-time detections
The basic syntax of a property filter/query is:
Condition = <Filter property> <Filter operator> <Property value or values>
Multiple conditions use the following syntax:
<Condition1> <AND | OR> <Condition2> <AND | OR> <Condition3>... <AND | OR> <ConditionN>
Tip
Wildcard searches (**** or ?) aren't supported in text or integer values. The Subject property uses partial text matching, and yields results similar to a wildcard search.
The steps to create property filter/query conditions are the same in all views in Threat Explorer and Real-time detections:
Identify the filter property using the tables in the preview view description sections earlier in this article.
Select an available filter operator. The available filter operators depend on the property type as described in the following table:
Filter operator Property type Equal any of Text
Integer
Discreet valuesEqual none of Text
Discreet valuesGreater than Integer Less than Integer Enter or select one or more property values. For text values and integers, you can enter multiple values separated by commas.
Multiple values in the property value use the OR logical operator. For example, Sender address > Equal any of >
bob@fabrikam.com,cindy@fabrikam.commeans Sender address > Equal any of >bob@fabrikam.comORcindy@fabrikam.com.After you enter or select one or more property values, the completed filter condition appears below the filter creation boxes.
Tip
For properties that require you to select one or more available values, using the property in the filter condition with all values selected has the same result as not using the property in the filter condition.
To add another condition, repeat the previous three steps.
The conditions below the filter creation boxes are separated by the logical operator that was selected at the time you created the second or subsequent conditions. The default value is AND, but you can also select OR.
The same logical operator is used between all conditions: they're all AND or they're all OR. To change the existing logical operators, select the logical operator box, and then select AND or OR.
To edit an existing condition, double-click on it to bring the selected property, filter operator, and values back into the corresponding boxes.
To remove an existing condition, select
 on the condition.
To apply the filter to the chart and the details table, select Refresh
Saved queries in Threat Explorer
Tip
Save query is part of Threat trackers and isn't available in Real-time detections. Saved queries and Threat trackers are available only in Defender for Office 365 Plan 2.
Save query isn't available in the Content malware view.
Most views in Threat Explorer allow you to save filters (queries) for later use. Saved queries are available on the Threat tracker page in the Defender portal at https://security.microsoft.com/threattrackerv2. For more information about Threat trackers, see Threat trackers in Microsoft Defender for Office 365 Plan 2.
To save queries in Threat Explorer, do the following steps:
After you create the filter/query as previously described, select Save query >
 Save query.
In the Save query flyout that opens, configure the following options:
- Query name: Enter a unique name for the query.
- Select one of the following options:
- Exact dates: Select a start date and end date in the boxes. The oldest start date that you can select is 30 days before today. The newest end date that you can select is today.
- Relative dates: Select the number of days in the Show last nn days when search is run. The default value is 7, but you can select 1 to 30.
- Track query: By default, this option isn't selected. This option affects whether the query runs automatically:
- Track query not selected: The query is available for you to run manually in Threat Explorer. The query is saved on the Saved queries tab on the Threat tracker page with the Tracked query property value No.
- Track query selected: The query periodically runs in the background. The query is available on the Saved queries tab on the Threat tracker page with the Tracked query property value Yes. The periodic results of the query are shown on the Tracked queries tab on the Threat tracker page.
When you're finished in the Save query flyout, select Save, and then select OK in the confirmation dialog.
On the Saved query or Tracked query tabs on the Threat tracker page in the Defender portal at https://security.microsoft.com/threattrackerv2, you can select Explore in the Actions column to open and use the query in Threat Explorer.
When you open the query by selecting Explore from the Threat tracker page, ![]() Save query as and
Save query as and ![]() Saved query settings are now available in Save query on the Explorer page:
Saved query settings are now available in Save query on the Explorer page:
If you select
 Save query as, the Save query flyout opens with all previously selected settings. If you make changes, select Save, and then select OK in the Success dialog, the updated query is saved as a new query on the Threat tracker page (you might need to select
  Refresh to see it).
If you select
 Saved query settings, the Saved query settings flyout opens where you can update the date and Track query settings of the existing query.
More information
- Threat Explorer collect email details on the Email entity page
- Find and investigate malicious email that was delivered
- View malicious files detected in SharePoint Online, OneDrive, and Microsoft Teams
- Threat protection status report
- Automated investigation and response in Microsoft Threat Protection
