.NET 中的網路計量
指標 是隨時間報告的數值度量。 它們通常用來監視應用程式的健康情況,並產生警示。
從 .NET 8 開始,System.Net.Http 和 System.Net.NameResolution 元件將被添置儀器,以便使用 .NET 的新 System.Diagnostics.Metrics API發佈計量。
這些計量是與 OpenTelemetry 合作設計的,以確保它們與標準保持一致,並與 Prometheus 和 Grafana等熱門工具搭配使用。
它們也會 多維度,這表示度量與稱為標籤的索引鍵/值組相關聯(也稱為屬性或標籤)。 標籤可讓測量分類以協助分析。
提示
如需所有內建工具及其屬性的完整清單,請參閱 System.Net 計量。
收集 System.Net 指標
若要利用內建計量檢測,必須設定 .NET 應用程式以收集這些計量。 這通常意味著將它們轉換為外部存儲與分析,例如,用於監控系統。
有數種方式可在 .NET 中收集網路計量。
- 如需使用簡單獨立範例的快速概觀,請參閱 使用 dotnet-counters 收集度量。
- 針對 生產時的 指標收集和監控,您可以使用 Grafana 搭配 OpenTelemetry 和 Prometheus 或 使用 Azure 監控服務 Application Insights。 不過,這些工具在開發階段可能會因為複雜度而不便使用。
- 如需 開發時間 度量收集和疑難排解,建議您使用 .NET Aspire,它提供了一種簡單但可擴展的方法,能在應用程式中啟動度量和分散式追蹤,並在本地診斷問題。
- 您也可以 在沒有 Aspire 協調流程的情況下重複使用 Aspire 服務預設值 專案,這是將 OpenTelemetry 追蹤和計量設定 API 引入 ASP.NET 專案中的便利方式。
使用 dotnet-counters 收集指標
dotnet-counters 是一種跨平臺命令列工具,用於臨時檢查 .NET 指標和初步效能分析。
為了進行本教學課程,請建立應用程式,以平行方式將 HTTP 要求傳送至各種端點。
dotnet new console -o HelloBuiltinMetrics
cd ..\HelloBuiltinMetrics
使用下列範例程式代碼取代 Program.cs 的內容:
using System.Net;

string[] uris = ["http://example.com", "http://httpbin.org/get", "https://example.com", "https://httpbin.org/get"];
using HttpClient client = new()
{
    DefaultRequestVersion = HttpVersion.Version20
};

Console.WriteLine("Press any key to start.");
Console.ReadKey();

while (!Console.KeyAvailable)
{
    await Parallel.ForAsync(0, Random.Shared.Next(20), async (_, ct) =>
    {
        string uri = uris[Random.Shared.Next(uris.Length)];
        try
        {
            byte[] bytes = await client.GetByteArrayAsync(uri, ct);
            await Console.Out.WriteLineAsync($"{uri} - received {bytes.Length} bytes.");
        }
        catch { await Console.Out.WriteLineAsync($"{uri} - failed."); }
    });
}
請確定已安裝 dotnet-counters:
dotnet tool install --global dotnet-counters
啟動 HelloBuiltinMetrics 應用程式。
dotnet run -c Release
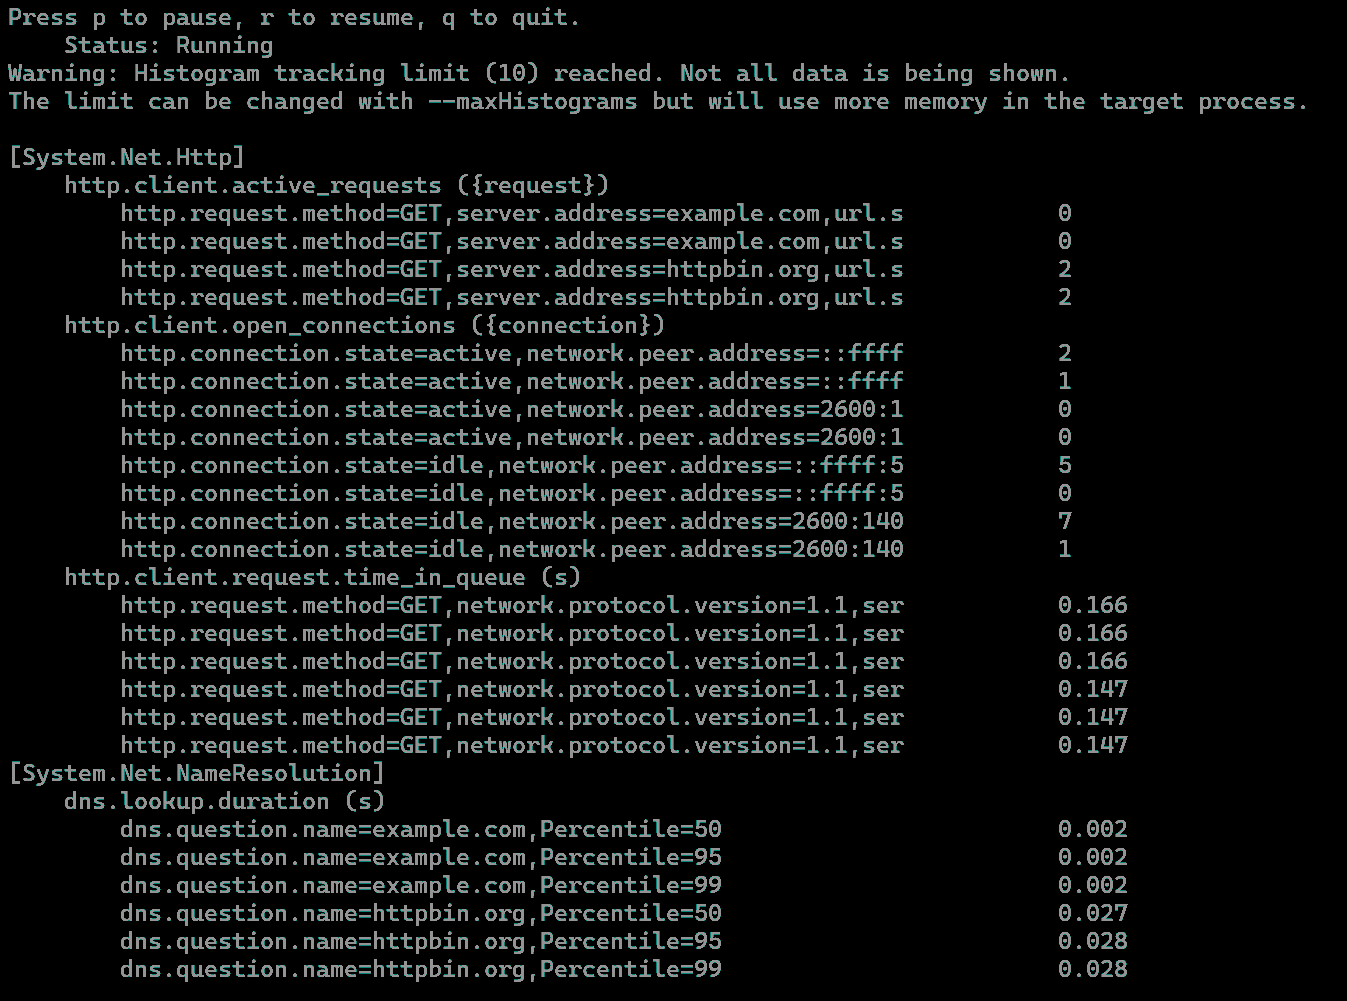
在個別的 CLI 視窗中啟動 dotnet-counters,並指定要監看的進程名稱和計量,然後按 HelloBuiltinMetrics 應用程式中的按鍵,以便開始傳送要求。 一旦測量開始登陸,dotnet-counters 會以最新的數字持續重新整理主控台:
dotnet-counters monitor --counters System.Net.Http,System.Net.NameResolution -n HelloBuiltinMetrics
使用 .NET Aspire 收集計量
在 ASP.NET 應用程式中收集追蹤和計量的簡單方法是使用 .NET Aspire。 .NET Aspire 是 .NET 的一組延伸模組,可讓您輕鬆地建立及使用分散式應用程式。 使用 .NET Aspire 的優點之一,就是使用適用於 .NET 的 OpenTelemetry 連結庫來內建遙測。
.NET Aspire 的預設專案範本包含 ServiceDefaults 專案。 .NET Aspire 解決方案中的每個服務都有 Service Defaults 專案的參考。 服務會使用它來設定和配置 OTel。
服務預設值項目範本包含 OTel SDK、ASP.NET、HttpClient 和 Runtime Instrumentation 套件。 這些檢測元件是在 Extensions.cs 檔案中設定的。 為了支援 Aspire 儀錶板中的遙測視覺效果,服務預設值專案也預設包含 OTLP 導出工具。
Aspire 儀表板的設計目的是將遙測觀察融入到本地調試過程中,使開發人員能夠確保應用程式正在產生遙測數據。 遙測視覺效果也有助於在本機診斷這些應用程式。 能夠觀察服務之間的呼叫在除錯時與產品環境中一樣有用。 當您從 Visual Studio F5AppHost Project,或從命令列 dotnet runAppHost 專案時,.NET Aspire 儀錶板會自動啟動。
快速導覽
使用
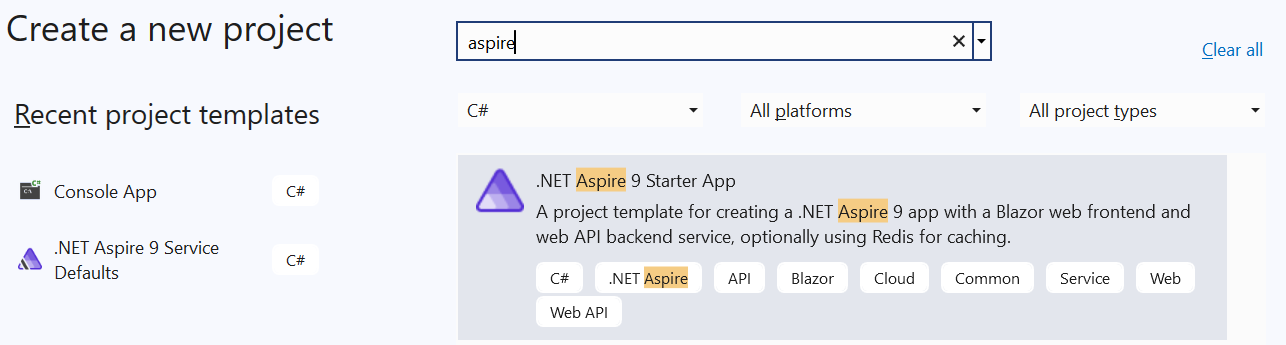
dotnet new建立 .NET Aspire 9 入門版應用程式:dotnet new aspire-starter-9 --output AspireDemo或在 Visual Studio 中建立新專案,然後選取 .NET Aspire 9 入門應用程式 範本:
在
ServiceDefaults項目中開啟Extensions.cs,然後捲動至ConfigureOpenTelemetry方法。 請注意AddHttpClientInstrumentation()呼叫訂閱網絡性能計量器。.WithMetrics(metrics => { metrics.AddAspNetCoreInstrumentation() .AddHttpClientInstrumentation() .AddRuntimeInstrumentation(); })請注意,在 .NET 8+ 上,
AddHttpClientInstrumentation()可由手動計量訂用帳戶取代:.WithMetrics(metrics => { metrics.AddAspNetCoreInstrumentation() .AddMeter("System.Net.Http") .AddMeter("System.Net.NameResolution") .AddRuntimeInstrumentation(); })執行
AppHost專案。 這應該會啟動 Aspire 儀錶板。導航至
webfrontend應用程式的 [天氣] 頁面,向apiservice發出HttpClient請求。 數次重新整理頁面以發送多個請求。返回儀錶板,流覽至 [計量] 頁面,然後選取
webfrontend資源。 向下捲動,您應該能夠瀏覽內建System.Net計量。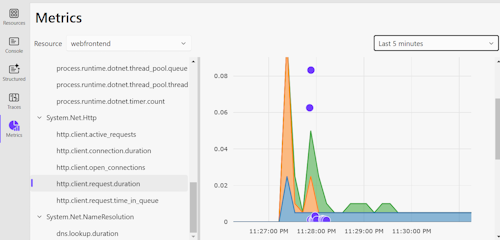

如需 .NET Aspire 的詳細資訊,請參閱:
重複使用服務預設值專案而不使用 .NET Aspire 編排
Aspire Service Defaults 專案提供簡單的方法來設定 ASP.NET 專案的 OTel,即使不使用其他 .NET Aspire,例如 AppHost 來進行協調流程。 服務預設值專案可透過Visual Studio或 dotnet new作為專案範本。 它會設定 OTel 並啟用 OTLP 匯出工具。 然後,您可以使用 OTel 環境變數 來設定 OTLP 端點來傳送遙測,並提供應用程式的資源屬性。
在 .NET Aspire 外部使用 ServiceDefaults 的步驟如下:
使用 Visual Studio 中的 [新增專案] 將 ServiceDefaults 專案新增至方案,或使用
dotnet new:dotnet new aspire-servicedefaults --output ServiceDefaults從 ASP.NET 應用程式引用 ServiceDefaults 專案。 在 Visual Studio 中,選取 新增>專案參考,然後選取 ServiceDefaults 專案。
呼叫 OpenTelemetry 安裝程式函式
ConfigureOpenTelemetry()作為應用程式建立器初始化的一部分。var builder = WebApplication.CreateBuilder(args) builder.ConfigureOpenTelemetry(); // Extension method from ServiceDefaults. var app = builder.Build(); app.MapGet("/", () => "Hello World!"); app.Run();
如需完整逐步解說,請參閱 Example: 使用 OpenTelemetry 搭配 OTLP 和獨立 Aspire 儀表板。
使用 OpenTelemetry 和 Prometheus 檢視 Grafana 中的計量
若要瞭解如何使用 Prometheus 和 Grafana 連接範例應用程式,請遵循 使用 OpenTelemetry 搭配 Prometheus、Grafana 和 Jaeger中的逐步解說。
若要藉由將平行要求傳送至各種端點來強調 HttpClient,請使用下列端點擴充範例應用程式:
app.MapGet("/ClientStress", async Task<string> (ILogger<Program> logger, HttpClient client) =>
{
    string[] uris = ["http://example.com", "http://httpbin.org/get", "https://example.com", "https://httpbin.org/get"];
    await Parallel.ForAsync(0, 50, async (_, ct) =>
    {
        string uri = uris[Random.Shared.Next(uris.Length)];

        try
        {
            await client.GetAsync(uri, ct);
            logger.LogInformation($"{uri} - done.");
        }
        catch { logger.LogInformation($"{uri} - failed."); }
    });
    return "Sent 50 requests to example.com and httpbin.org.";
});
選取頂端工具列上的 + 圖示,然後選取 [儀錶板],以建立 Grafana 儀錶板。 在顯示的儀錶板編輯器中,於 [標題] 方塊中輸入 [開啟 HTTP/1.1 連線],並在 [PromQL 表達式] 欄位中輸入下列查詢:
sum by(http_connection_state) (http_client_open_connections{network_protocol_version="1.1"})
選取 ,然後套用,以儲存並檢視新的儀錶板。 它會顯示集區中作用中與閑置 HTTP/1.1 連線的數目。
 中的 HTTP/1.1 連線
富 集
擴充 是將自定義標籤(也稱為屬性或標籤)新增至計量。 如果應用程式想要將自定義分類新增至使用計量建置的儀錶板或警示,這會很有用。
http.client.request.duration 設備通過向 HttpMetricsEnrichmentContext註冊回呼來支持功能擴充。
請注意,這是低階 API,而且每個 HttpRequestMessage都需要個別的回調函數註冊。
在單一位置執行回呼註冊的簡單方法是實作自定義 DelegatingHandler。 這可讓您在要求轉送至內部處理程式並傳送至伺服器之前攔截和修改要求:
using System.Net.Http.Metrics;

using HttpClient client = new(new EnrichmentHandler() { InnerHandler = new HttpClientHandler() });

await client.GetStringAsync("https://httpbin.org/response-headers?Enrichment-Value=A");
await client.GetStringAsync("https://httpbin.org/response-headers?Enrichment-Value=B");

sealed class EnrichmentHandler : DelegatingHandler
{
    protected override Task<HttpResponseMessage> SendAsync(HttpRequestMessage request, CancellationToken cancellationToken)
    {
        HttpMetricsEnrichmentContext.AddCallback(request, static context =>
        {
            if (context.Response is not null) // Response is null when an exception occurs.
            {
                // Use any information available on the request or the response to emit custom tags.
                string? value = context.Response.Headers.GetValues("Enrichment-Value").FirstOrDefault();
                if (value != null)
                {
                    context.AddCustomTag("enrichment_value", value);
                }
            }
        });
        return base.SendAsync(request, cancellationToken);
    }
}
如果您使用 IHttpClientFactory,您可以使用 AddHttpMessageHandler 來註冊 EnrichmentHandler:
using Microsoft.Extensions.DependencyInjection;
using Microsoft.Extensions.Options;
using System.Net.Http.Metrics;

ServiceCollection services = new();
services.AddHttpClient(Options.DefaultName).AddHttpMessageHandler(() => new EnrichmentHandler());

ServiceProvider serviceProvider = services.BuildServiceProvider();
HttpClient client = serviceProvider.GetRequiredService<HttpClient>();

await client.GetStringAsync("https://httpbin.org/response-headers?Enrichment-Value=A");
await client.GetStringAsync("https://httpbin.org/response-headers?Enrichment-Value=B");
注意
基於效能考量,只有在啟用 http.client.request.duration 工具時才會調用增強回呼,這表示應該收集度量。
這可以是 dotnet-monitor、Prometheus 匯出工具、MeterListener或 MetricCollector<T>。
IMeterFactory 和 IHttpClientFactory 整合
HTTP 計量的設計考慮了隔離和可測試性。 使用 IMeterFactory支援這些層面,讓自定義 Meter 實例能發佈度量標準,以便將計量彼此隔離。
根據預設,全域 Meter 會用來發出所有計量。
Meter 是屬於 System.Net.Http 連結庫的內部。 要覆蓋此行為,可以將自定義的 IMeterFactory 實例指派給 SocketsHttpHandler.MeterFactory 或 HttpClientHandler.MeterFactory。
注意
Meter.Name 是 System.Net.Http 給所有由 HttpClientHandler 和 SocketsHttpHandler發出的計量。
使用 .NET 8+ 上的 Microsoft.Extensions.Http 和 IHttpClientFactory 時,預設 IHttpClientFactory 實作會自動挑選 IServiceCollection 中註冊的 IMeterFactory 實例,並將它指派給它在內部建立的主要處理程式。
注意
從 .NET 8 開始,AddHttpClient 方法會自動呼叫 AddMetrics,以初始化計量服務,並使用 IServiceCollection註冊預設 IMeterFactory 實作。 默認 IMeterFactory 基於名稱快取 Meter 實例,意味著每個 IServiceCollection都有一個名稱為 System.Net.Http 的 Meter。
測試指標
下列範例示範如何使用 Microsoft.Extensions.Diagnostics.Testing NuGet 套件中的 xUnit、IHttpClientFactory和 MetricCollector<T>,在單元測試中驗證內建計量:
[Fact]
public async Task RequestDurationTest()
{
    // Arrange
    ServiceCollection services = new();
    services.AddHttpClient();
    ServiceProvider serviceProvider = services.BuildServiceProvider();
    var meterFactory = serviceProvider.GetService<IMeterFactory>();
    var collector = new MetricCollector<double>(meterFactory,
        "System.Net.Http", "http.client.request.duration");
    var client = serviceProvider.GetRequiredService<HttpClient>();

    // Act
    await client.GetStringAsync("http://example.com");

    // Assert
    await collector.WaitForMeasurementsAsync(minCount: 1).WaitAsync(TimeSpan.FromSeconds(5));
    Assert.Collection(collector.GetMeasurementSnapshot(),
        measurement =>
        {
            Assert.Equal("http", measurement.Tags["url.scheme"]);
            Assert.Equal("GET", measurement.Tags["http.request.method"]);
        });
}
計量與 EventCounters
計量比 EventCounters 功能豐富的,最明顯是因為其多維度本質。 此多維度可讓您在 Prometheus 之類的工具中建立複雜的查詢,並取得 EventCounters 無法達到的層級見解。
不過,從 .NET 8 起,只有 System.Net.Http 和 System.Net.NameResolutions 元件會使用計量來檢測,這表示如果您需要來自 System.Net.Sockets 或 System.Net.Security等堆棧較低層級的計數器,您必須使用 EventCounters。
此外,計量與其相符的 EventCounters 之間有一些語意差異。
例如,使用 HttpCompletionOption.ResponseContentRead時,current-requests EventCounter 會將要求視為作用中,直到讀取要求本文的最後一個字節為止。
其度量衡對應專案 http.client.active_requests 在計算活躍請求時,並不包括讀取回應本文所花費的時間。
需要更多計量嗎?
如果您有其他可透過計量顯示的實用信息建議,請在 dotnet/runtime 上建立第 號問題。