收集計量
本文適用於:✔️.NET Core 3.1 和更新版本 ✔️ .NET Framework 4.6.1 和更新版本
檢測的程式碼可以記錄數值度量,但度量通常需要經過彙總、傳輸和儲存,以建立實用的監視計量。 彙總、傳輸和儲存資料的此程序稱為收集。 本教學課程示範數個收集計量的範例:
- 使用 OpenTelemetry 和 Prometheus 填入 Grafana 中的計量。
- 使用
dotnet-counters即時檢視計量 - 使用基礎 .NET MeterListener API 建立自訂收集工具。
如需自訂計量檢測和選項的詳細資訊,請參閱比較計量 API。
必要條件
- .NET Core 3.1 SDK 或更新版本
建立範例應用程式
必須先產生一些度量,才能收集計量。 本教學課程會建立具有基本計量檢測的應用程式。 .NET 執行階段也內建各種計量。 如需使用 System.Diagnostics.Metrics.Meter API 建立新計量的詳細資訊,請參閱檢測教學課程。
dotnet new console -o metric-instr
cd metric-instr
dotnet add package System.Diagnostics.DiagnosticSource
以下列程式碼取代 Program.cs 的內容:
using System.Diagnostics.Metrics;

class Program
{
    static Meter s_meter = new("HatCo.HatStore", "1.0.0");
    static Counter<int> s_hatsSold = s_meter.CreateCounter<int>("hats-sold");

    static void Main(string[] args)
    {
        var rand = Random.Shared;
        Console.WriteLine("Press any key to exit");
        while (!Console.KeyAvailable)
        {
            //// Simulate hat selling transactions.
            Thread.Sleep(rand.Next(100, 2500));
            s_hatsSold.Add(rand.Next(0, 1000));
        }
    }
}
上述程式碼會以隨機間隔和隨機時間模擬銷售帽子。
使用 dotnet-counters 檢視計量
dotnet-counters 是命令列工具,可隨需檢視 .NET Core 應用程式的即時計量。 它不需要設定,因此適合臨機操作調查,或驗證計量檢測可正常運作。 其適用於 System.Diagnostics.Metrics 式 API 和 EventCounters。
如果未安裝 dotnet-counters 工具,請執行下列命令:
dotnet tool update -g dotnet-counters
範例應用程式執行中時,啟動 dotnet-counters。 下列命令顯示的 dotnet-counters 範例會監視來自 HatCo.HatStore 計量的所有計量。 計量 (meter) 名稱會區分大小寫。 我們的範例應用程式為 metric-instr.exe,請將其替換為您的範例應用程式名稱。
dotnet-counters monitor -n metric-instr HatCo.HatStore
會顯示類似下列的輸出:
Press p to pause, r to resume, q to quit.
    Status: Running

[HatCo.HatStore]
    hats-sold (Count / 1 sec)                          4
dotnet-counters 可以使用一組不同的計量來執行,以查看 .NET 執行階段的一些內建檢測:
dotnet-counters monitor -n metric-instr
會顯示類似下列的輸出:
Press p to pause, r to resume, q to quit.
    Status: Running

[System.Runtime]
    % Time in GC since last GC (%)                                 0
    Allocation Rate (B / 1 sec)                                8,168
    CPU Usage (%)                                                  0
    Exception Count (Count / 1 sec)                                0
    GC Heap Size (MB)                                              2
    Gen 0 GC Count (Count / 1 sec)                                 0
    Gen 0 Size (B)                                         2,216,256
    Gen 1 GC Count (Count / 1 sec)                                 0
    Gen 1 Size (B)                                           423,392
    Gen 2 GC Count (Count / 1 sec)                                 0
    Gen 2 Size (B)                                           203,248
    LOH Size (B)                                             933,216
    Monitor Lock Contention Count (Count / 1 sec)                  0
    Number of Active Timers                                        1
    Number of Assemblies Loaded                                   39
    ThreadPool Completed Work Item Count (Count / 1 sec)           0
    ThreadPool Queue Length                                        0
    ThreadPool Thread Count                                        3
    Working Set (MB)                                              30
如需詳細資訊,請參閱 dotnet-counters。 如需深入了解 .NET 中的計量,請參閱內建計量。
使用 OpenTelemetry 和 Prometheus 檢視 Grafana 中的計量
概觀
- 這是 Cloud Native Computing Foundation 支援的廠商中性開放原始碼專案。
- 將產生和收集雲端原生軟體的遙測標準化。
- 使用 .NET 計量 API 搭配 .NET 使用。
- 獲得 Azure 監視器和許多 APM 廠商認可。
本教學課程示範使用 OSS Prometheus 和 Grafana 專案的 OpenTelemetry 計量可用的其中一項整合。 計量資料流程:
.NET 計量 API 會記錄來自範例應用程式的度量。
在應用程式中執行的 OpenTelemetry 程式庫會彙總度量。
Prometheus 匯出工具程式庫會透過 HTTP 計量端點提供經彙總的資料。 「匯出工具」是 OpenTelemetry 呼叫的程式庫,可將遙測傳輸至廠商特定後端。
Prometheus 伺服器:
- 輪詢計量端點
- 讀取資料
- 將資料儲存在資料庫中供長期保存。 Prometheus 將讀取並儲存資料稱為抓取端點。
- 可以在不同的電腦上執行
Grafana 伺服器:
- 查詢儲存在 Prometheus 中的資料,並將其顯示在 Web 型監視儀表板上。
- 可以在不同的電腦上執行。
設定範例應用程式以使用 OpenTelemetry 的 Prometheus 匯出工具
將 OpenTelemetry Prometheus 匯出工具的參考新增至範例應用程式:
dotnet add package OpenTelemetry.Exporter.Prometheus.HttpListener --prerelease
注意
本教學課程會使用 OpenTelemetry 的 Prometheus 支援在本文撰寫時提供的發行前版本組建。
使用 OpenTelemetry 組態更新 Program.cs:
using OpenTelemetry;
using OpenTelemetry.Metrics;
using System.Diagnostics.Metrics;

class Program
{
    static Meter s_meter = new("HatCo.HatStore", "1.0.0");
    static Counter<int> s_hatsSold = s_meter.CreateCounter<int>(
        name: "hats-sold",
        unit: "Hats",
        description: "The number of hats sold in our store");

    static void Main(string[] args)
    {
        using MeterProvider meterProvider = Sdk.CreateMeterProviderBuilder()
                .AddMeter("HatCo.HatStore")
                .AddPrometheusHttpListener(options => options.UriPrefixes = new string[] { "http://localhost:9184/" })
                .Build();

        var rand = Random.Shared;
        Console.WriteLine("Press any key to exit");
        while (!Console.KeyAvailable)
        {
            //// Simulate hat selling transactions.
            Thread.Sleep(rand.Next(100, 2500));
            s_hatsSold.Add(rand.Next(0,1000));
        }
    }
}
在上述程式碼中:
AddMeter("HatCo.HatStore")會設定 OpenTelemetry,以傳輸應用程式中所定義計量 (meter) 收集的所有計量。AddPrometheusHttpListener將 OpenTelemetry 設定為:- 在連接埠
9184上公開 Prometheus 的計量端點 - 使用 HttpListener。
- 在連接埠
如需 OpenTelemetry 組態選項的詳細資訊,請參閱 OpenTelemetry 文件。 OpenTelemetry 文件顯示 ASP.NET 應用程式的裝載選項。
執行應用程式,讓應用程式保持在執行狀態以便收集度量:
dotnet run
設定 Prometheus
遵循 Prometheus first steps (英文) 來設定 Prometheus 伺服器,並確認其正常運作。
修改 prometheus.yml 設定檔,使得 Prometheus 會抓取範例應用程式公開的計量端點。 在 scrape_configs 區段中新增下列反白顯示的文字:
# my global config
global:
  scrape_interval: 15s # Set the scrape interval to every 15 seconds. Default is every 1 minute.
  evaluation_interval: 15s # Evaluate rules every 15 seconds. The default is every 1 minute.
  # scrape_timeout is set to the global default (10s).

# Alertmanager configuration
alerting:
  alertmanagers:
    - static_configs:
        - targets:
          # - alertmanager:9093

# Load rules once and periodically evaluate them according to the global 'evaluation_interval'.
rule_files:
  # - "first_rules.yml"
  # - "second_rules.yml"

# A scrape configuration containing exactly one endpoint to scrape:
# Here it's Prometheus itself.
scrape_configs:
  # The job name is added as a label `job=<job_name>` to any timeseries scraped from this config.
  - job_name: "prometheus"

    # metrics_path defaults to '/metrics'
    # scheme defaults to 'http'.

    static_configs:
      - targets: ["localhost:9090"]

  - job_name: 'OpenTelemetryTest'
    scrape_interval: 1s # poll very quickly for a more responsive demo
    static_configs:
      - targets: ['localhost:9184']
啟動 Prometheus
重新載入設定或重新啟動 Prometheus 伺服器。
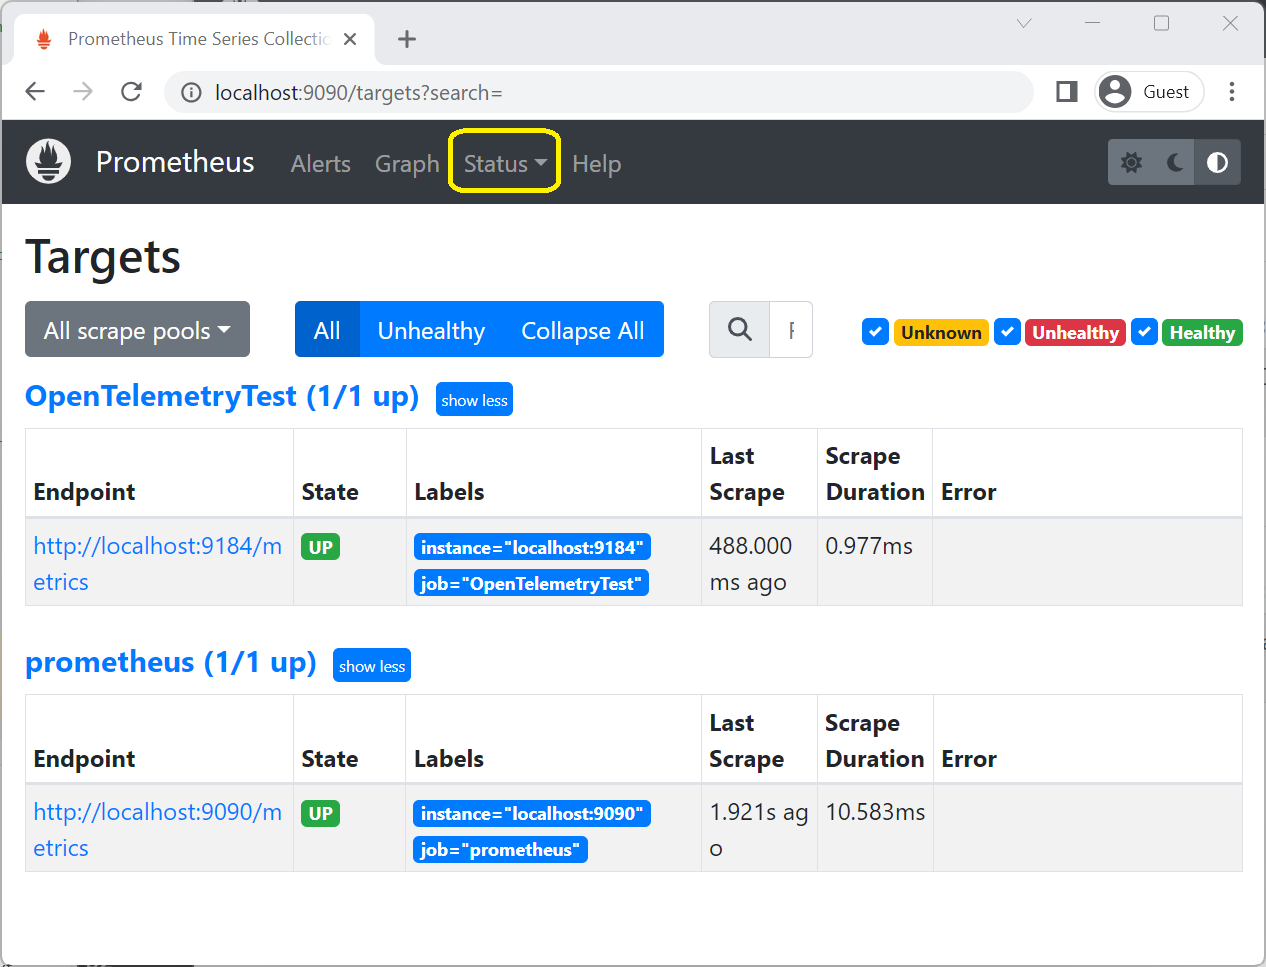
確認 OpenTelemetryTest 在 Prometheus 入口網站的 [狀態] > [目標] 頁面中處於運作中狀態。
在 Prometheus Web 入口網站的 [圖表] 頁面上,於運算式文字方塊中輸入
hats,然後在 [圖表] 索引標籤中選取hats_sold_Hats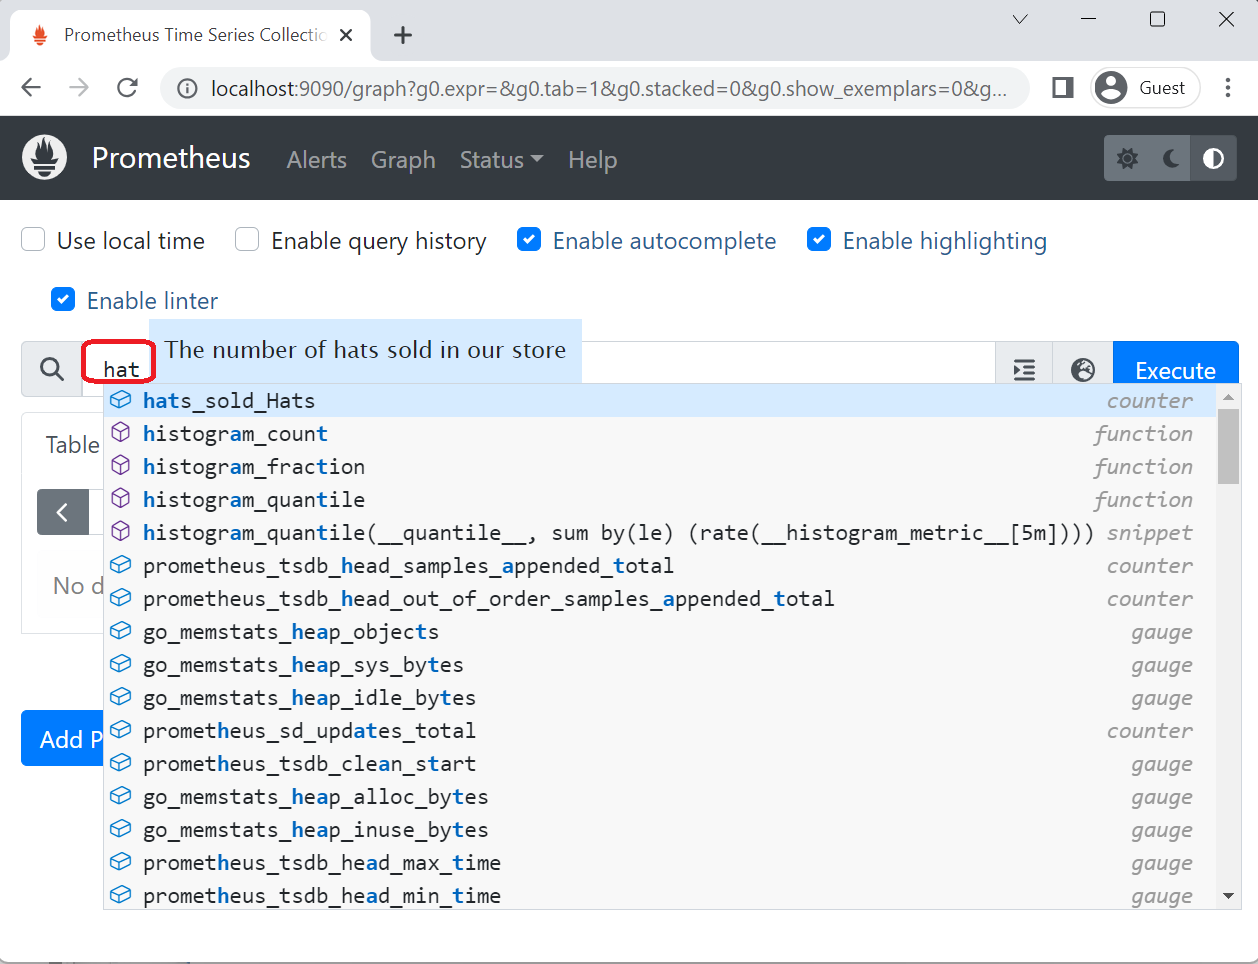 ,Prometheus 會顯示範例應用程式發出的「hats-sold」計數器值不斷增加。
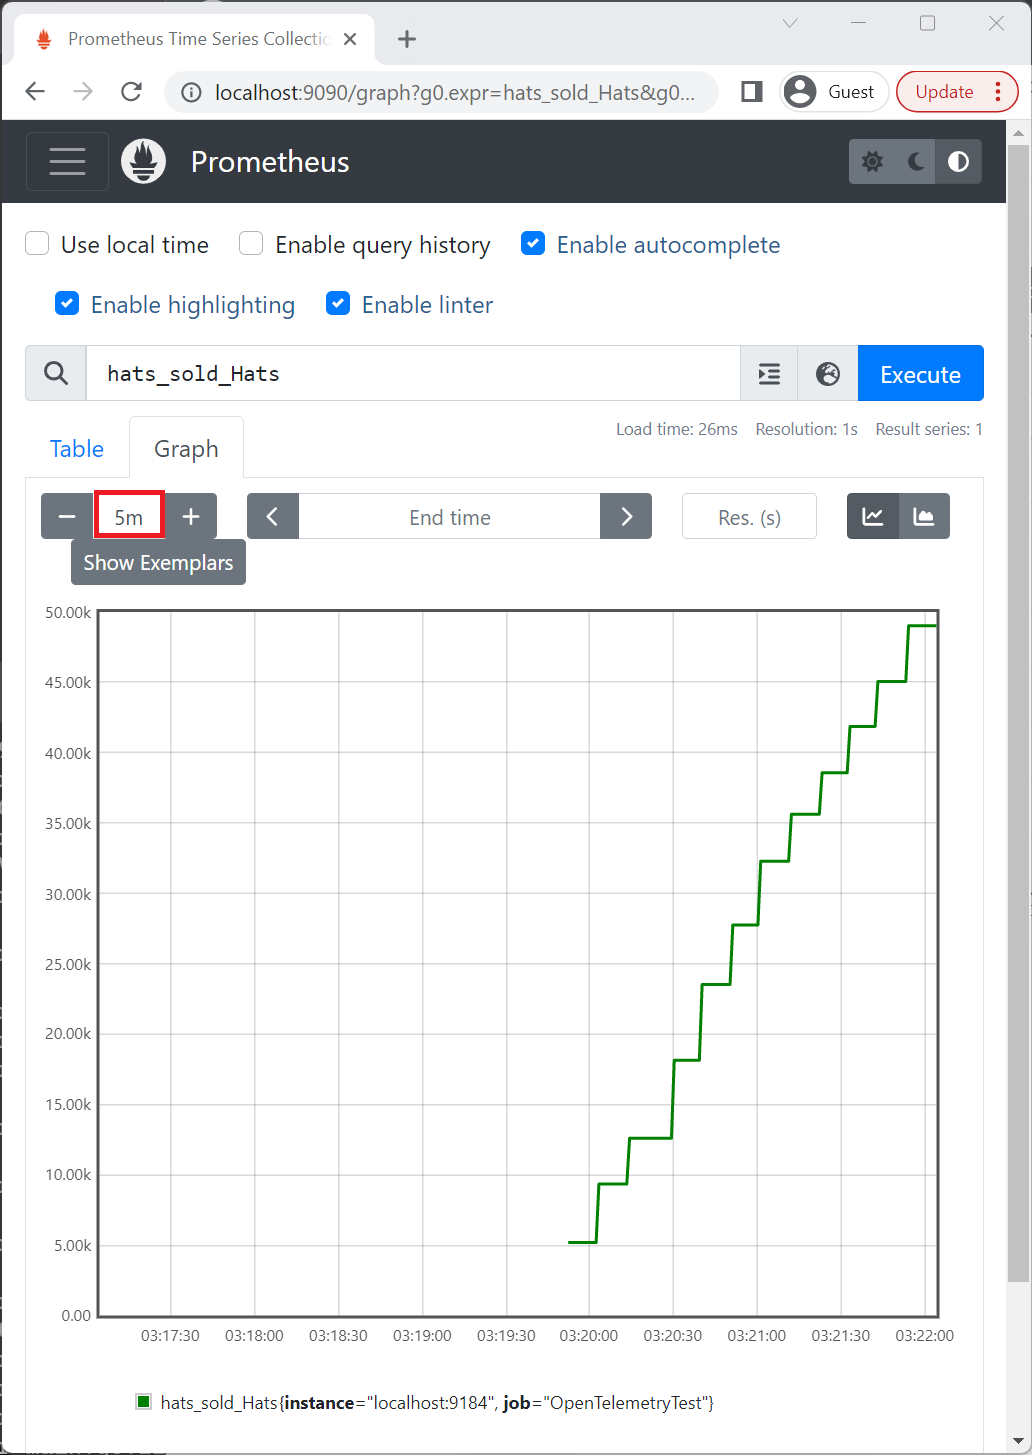
在上圖中,圖表時間會設定為 5m,也就是5分鐘。
如果 Prometheus 伺服器抓取範例應用程式的時間尚短,則您可能需要等候以累積資料。
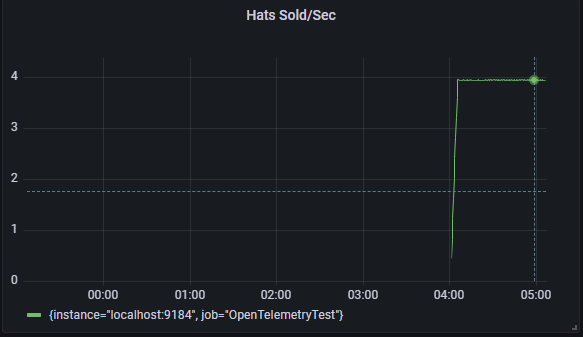
在 Grafana 儀表板上顯示計量
請遵循標準指示來安裝 Grafana,並將其連線至 Prometheus 資料來源。
請按一下 Grafana 入口網站左側工具列上的 + 圖示,然後選取 [Dashboard],以建立 Grafana 儀表板。 在隨即出現的儀表板編輯器中,在 [Title] 輸入方塊中輸入 Hats Sold/Sec,並在 PromQL 運算式欄位中輸入 rate(hats_sold[5m]):
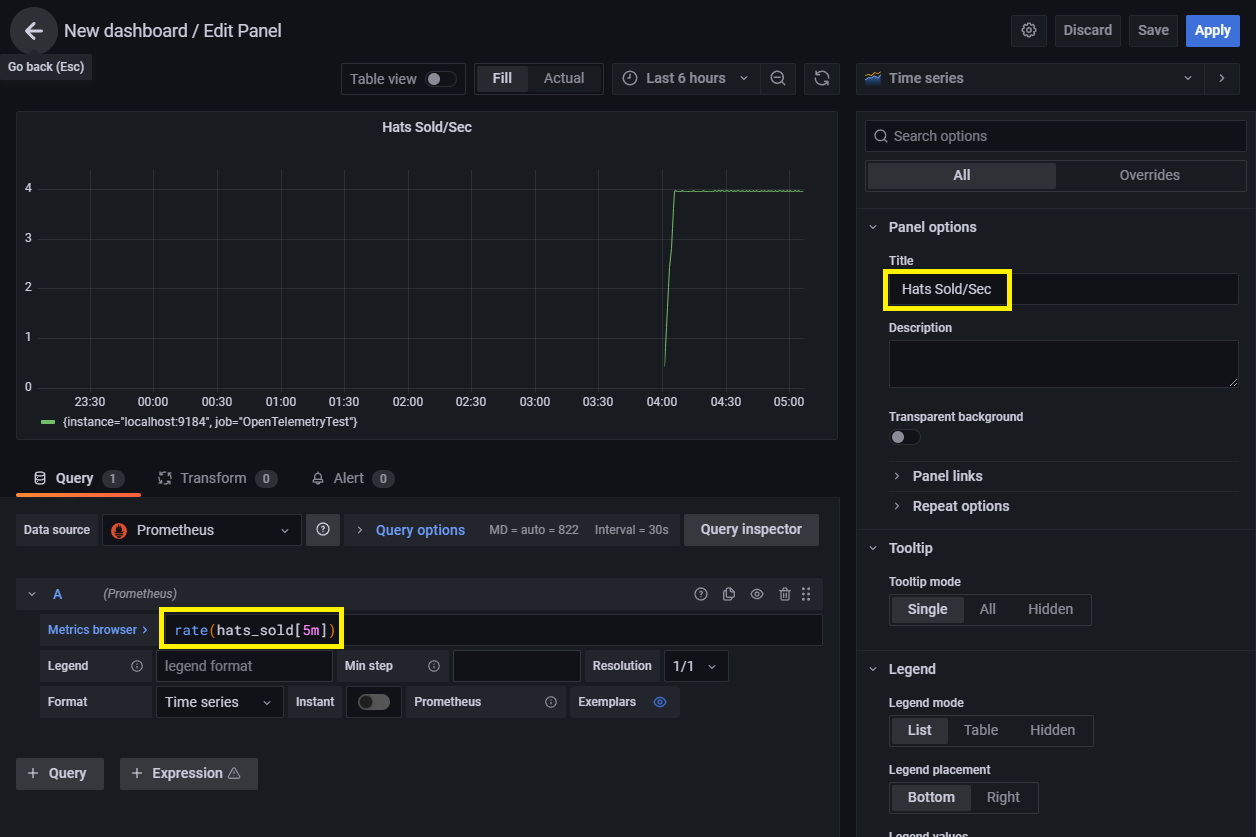
按一下 [Apply],以儲存並檢視新儀表板。
 ]
]
使用 .NET MeterListener API 建立自訂收集工具
.NET MeterListener API 可讓您建立自訂同處理序邏輯,以觀察 System.Diagnostics.Metrics.Meter 所記錄的度量。 如需建立與舊版 EventCounters 檢測相容的自訂邏輯指引,請參閱 EventCounters。
修改 Program.cs 的程式碼以使用 MeterListener:
using System.Diagnostics.Metrics;

class Program
{
    static Meter s_meter = new("HatCo.HatStore", "1.0.0");
    static Counter<int> s_hatsSold = s_meter.CreateCounter<int>(
        name: "hats-sold",
        unit: "Hats",
        description: "The number of hats sold in our store");

    static void Main(string[] args)
    {
        using MeterListener meterListener = new();
        meterListener.InstrumentPublished = (instrument, listener) =>
        {
            if (instrument.Meter.Name is "HatCo.HatStore")
            {
                listener.EnableMeasurementEvents(instrument);
            }
        };

        meterListener.SetMeasurementEventCallback<int>(OnMeasurementRecorded);
        // Start the meterListener, enabling InstrumentPublished callbacks.
        meterListener.Start();

        var rand = Random.Shared;
        Console.WriteLine("Press any key to exit");
        while (!Console.KeyAvailable)
        {
            //// Simulate hat selling transactions.
            Thread.Sleep(rand.Next(100, 2500));
            s_hatsSold.Add(rand.Next(0, 1000));
        }
    }

    static void OnMeasurementRecorded<T>(
        Instrument instrument,
        T measurement,
        ReadOnlySpan<KeyValuePair<string, object?>> tags,
        object? state)
    {
        Console.WriteLine($"{instrument.Name} recorded measurement {measurement}");
    }
}
下列輸出會顯示應用程式輸出,並針對每個度量使用自訂回呼:
> dotnet run
Press any key to exit
hats-sold recorded measurement 978
hats-sold recorded measurement 775
hats-sold recorded measurement 666
hats-sold recorded measurement 66
hats-sold recorded measurement 914
hats-sold recorded measurement 912
...
說明程式碼範例
本節中的程式碼片段來自上述範例。
在下列醒目提示的程式碼中,建立了 MeterListener 執行個體來接收度量。 using 關鍵字會在 meterListener 超出範圍時呼叫 Dispose。
using MeterListener meterListener = new();
meterListener.InstrumentPublished = (instrument, listener) =>
{
    if (instrument.Meter.Name is "HatCo.HatStore")
    {
        listener.EnableMeasurementEvents(instrument);
    }
};
下列醒目提示的程式碼會設定接聽程式從哪些檢測接收度量。 InstrumentPublished 是一項委派,會在應用程式內建立新檢測時叫用。
using MeterListener meterListener = new();
meterListener.InstrumentPublished = (instrument, listener) =>
{
    if (instrument.Meter.Name is "HatCo.HatStore")
    {
        listener.EnableMeasurementEvents(instrument);
    }
};
該委派可以檢查檢測,以決定是否要訂閱。 例如,委派可以檢查名稱、計量或任何其他公用屬性。 EnableMeasurementEvents 可接收來自指定檢測的度量。 透過另一種方法取得檢測參考的程式碼:
- 這並不常用。
- 隨時都可以使用參考來叫用
EnableMeasurementEvents()。
藉由呼叫 SetMeasurementEventCallback 來設定從檢測接收度量時叫用的委派:
    meterListener.SetMeasurementEventCallback<int>(OnMeasurementRecorded);
    // Start the meterListener, enabling InstrumentPublished callbacks.
    meterListener.Start();

    var rand = Random.Shared;
    Console.WriteLine("Press any key to exit");
    while (!Console.KeyAvailable)
    {
        //// Simulate hat selling transactions.
        Thread.Sleep(rand.Next(100, 2500));
        s_hatsSold.Add(rand.Next(0, 1000));
    }
}

static void OnMeasurementRecorded<T>(
    Instrument instrument,
    T measurement,
    ReadOnlySpan<KeyValuePair<string, object?>> tags,
    object? state)
{
    Console.WriteLine($"{instrument.Name} recorded measurement {measurement}");
}
泛型參數會控制回呼接收哪些資料類型的度量。 例如,Counter<int> 會產生 int 度量,而 Counter<double> 會產生 double 度量。 您可以使用 byte、short、int、long、float、double 和 decimal 類型來建立檢測。 除非您有案例特定的知識,否則建議您為每個資料類型註冊回呼,但並非所有資料類型都需要。 對具有不同泛型引數的 SetMeasurementEventCallback 進行重複呼叫,可能會顯得有點不尋常。 該 API 的設計方式是為了讓 MeterListener 能夠接收效能負載低的度量,其通常只有幾奈秒。
呼叫 MeterListener.EnableMeasurementEvents 時,可以提供 state 物件做為其中一個參數。 state 物件是任意的。 如果您在該呼叫中提供狀態物件,則會使用該檢測來儲存它,並將其當作回呼中的 state 參數傳回給您。 這既是為了方便,也是為了效能最佳化。 接聽程式通常需要:
- 為每個在記憶體中儲存度量的檢測建立物件。
- 讓程式碼對這些度量執行計算。
或者,建立從檢測對應到儲存物件的 Dictionary,並在每次度量時進行查找。 使用 Dictionary 的速度比從 state 存取慢得多。
meterListener.Start();
上述程式碼會啟動啟用回呼的 MeterListener。 程序中每個預先存在的檢測都會叫用 InstrumentPublished 委派。 新建立的檢測物件也會觸發 InstrumentPublished 被叫用。
using MeterListener meterListener = new MeterListener();
當應用程式完成接聽之後,處置接聽程式會停止回呼的流程,並釋放接聽程式物件的任何內部參考。 宣告 meterListener 時所使用的 using 關鍵字會造成變數超出範圍時呼叫 Dispose。 請注意,Dispose 只保證不會起始新的回呼。 因為回呼發生在不同的執行緒上,所以在對 Dispose 的呼叫傳回之後,可能仍有回呼正在進行。
為了保證回呼中某個區域的程式碼目前未執行,且未來也不會執行,則必須新增執行緒同步處理。 依預設,Dispose 不會包含同步處理,因為:
- 同步處理會在每個度量回呼中增加效能負載。
MeterListener設計為具有高效能意識的 API。