你当前正在访问 Microsoft Azure Global Edition 技术文档网站。 如果需要访问由世纪互联运营的 Microsoft Azure 中国技术文档网站,请访问 https://docs.azure.cn。
在 iOS SDK 中聚类点数据(预览版)
注意
Azure Maps iOS SDK 停用
适用于 iOS 的 Azure Maps 本机 SDK 现已弃用,将于 2025 年 3 月 31 日停用。 为了避免服务中断,请在 2025 年 3 月 31 日之前迁移到 Azure Maps Web SDK。 有关详细信息,请参阅 Azure Maps iOS SDK 迁移指南。
当在地图上显示许多数据点时,数据点可能彼此重叠。 重叠可能会导致地图不可读且难以使用。 聚类点数据是将相邻的点数据合并在一起,并在地图上将其作为单个聚类数据点进行呈现的过程。 当用户放大地图时,聚类的各个数据点将会分开。 处理大量数据点时,请使用聚类过程来改善用户体验。
先决条件
请务必完成快速入门:创建 iOS 应用文档中的步骤。 可将本文中的代码块插入到 ViewController 的 viewDidLoad 函数。
对数据源启用聚类
通过将 cluster 选项设置为 true,在 DataSource 类中启用聚类。 设置 clusterRadius 以选择附近的数据点,并将它们合并为聚类。 clusterRadius 的值以点为单位。 使用 clusterMaxZoom 指定禁用聚类逻辑的缩放级别。 下面是如何在数据源中启用聚类的示例。
// Create a data source and enable clustering.
let source = DataSource(options: [
    //Tell the data source to cluster point data.
    .cluster(true),

    //The radius in points to cluster data points together.
    .clusterRadius(45),

    //The maximum zoom level in which clustering occurs.
    //If you zoom in more than this, all points are rendered as symbols.
    .clusterMaxZoom(15)
])
注意
聚类仅适用于 Point 特征。 如果数据源包含其他几何类型的特征(如 Polyline 或 Polygon),则会发生错误。
提示
如果两个数据点在地面上紧挨着,则聚类可能永远不会分解,无论用户放大多少倍。 若要解决此情况,可以设置 clusterMaxZoom 选项以禁用聚类逻辑,只是显示所有内容。
DataSource 类还提供了以下与聚类有关的方法。
| 方法 | 返回类型 | 说明 |
|---|---|---|
children(of cluster: Feature) |
[Feature] |
在下一个缩放级别检索给定聚类的子级。 这些子级可以是特征和子聚类的组合。 子聚类成为具有与 ClusteredProperties 匹配的属性的特征。 |
zoomLevel(forExpanding cluster: Feature) |
Double |
计算聚类开始展开或分解的缩放级别。 |
leaves(of cluster: Feature, offset: UInt, limit: UInt) |
[Feature] |
检索聚类中的所有点。 设置 limit 可返回点的子集,使用 offset 可逐页呈现点。 |
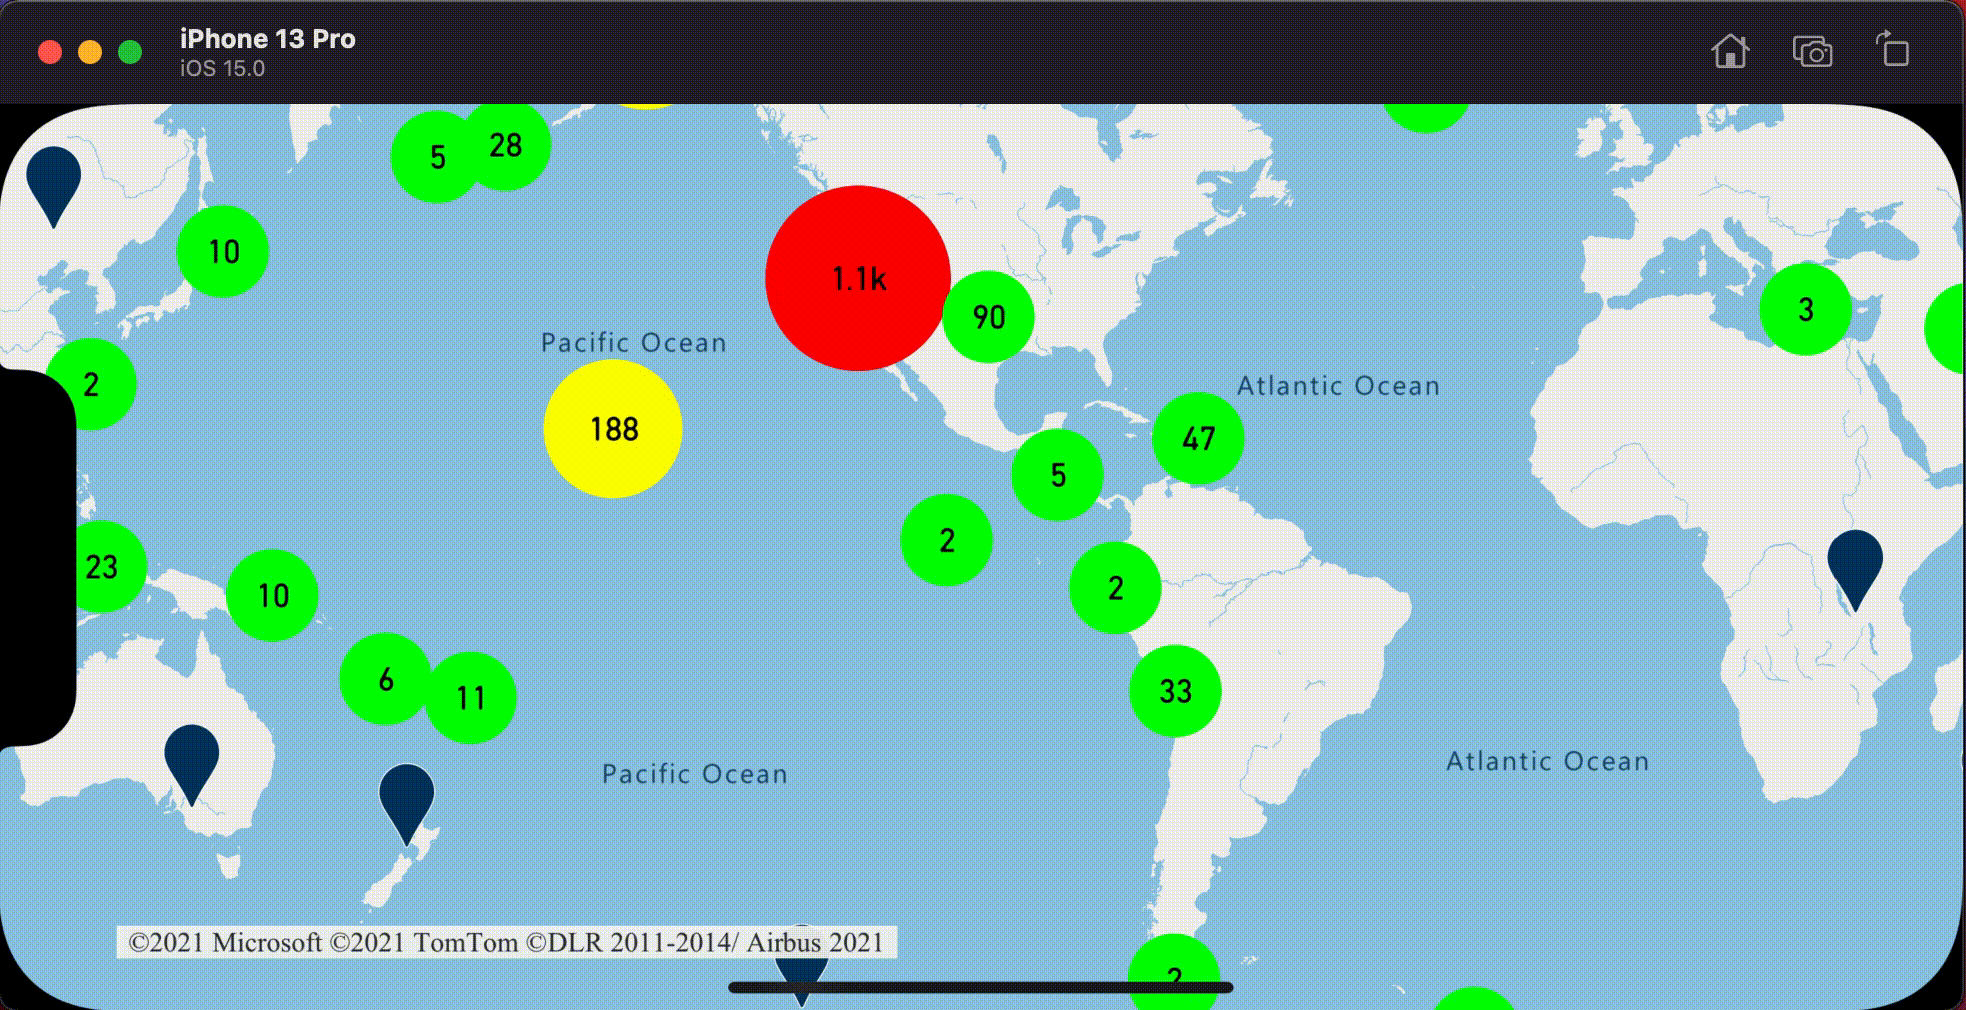
使用气泡层显示聚类
气泡层是呈现聚类点的好方法。 使用表达式可基于聚类中的点数来缩放半径并更改颜色。 如果使用气泡层显示聚类,则应使用单独的层来呈现非聚类数据点。
若要在气泡顶部显示聚类的大小,请将符号层与文本一起使用,而不要使用图标。
以下代码显示使用气泡层的聚类点,以及每个聚类中使用符号层的点数。 第二个符号层用于显示不在聚类内的各个点。
// Create a data source and enable clustering.
let source = DataSource(options: [
    // Tell the data source to cluster point data.
    .cluster(true),

    // The radius in points to cluster data points together.
    .clusterRadius(45),

    // The maximum zoom level in which clustering occurs.
    // If you zoom in more than this, all points are rendered as symbols.
    .clusterMaxZoom(15)
])

// Import the geojson data and add it to the data source.
let url = URL(string: "https://earthquake.usgs.gov/earthquakes/feed/v1.0/summary/all_week.geojson")!
source.importData(fromURL: url)

// Add data source to the map.
map.sources.add(source)

// Create a bubble layer for rendering clustered data points.
map.layers.addLayer(
    BubbleLayer(
        source: source,
        options: [
            // Scale the size of the clustered bubble based on the number of points in the cluster.
            .bubbleRadius(
                from: NSExpression(
                    forAZMStepping: NSExpression(forKeyPath: "point_count"),
                    // Default of 20 point radius.
                    from: NSExpression(forConstantValue: 20),
                    stops: NSExpression(forConstantValue: [

                        // If point_count >= 100, radius is 30 points.
                        100: 30,

                        // If point_count >= 750, radius is 40 points.
                        750: 40
                    ])
                )
            ),

            // Change the color of the cluster based on the value on the point_count property of the cluster.
            .bubbleColor(
                from: NSExpression(
                    forAZMStepping: NSExpression(forKeyPath: "point_count"),
                    // Default to green.
                    from: NSExpression(forConstantValue: UIColor.green),
                    stops: NSExpression(forConstantValue: [

                        // If the point_count >= 100, color is yellow.
                        100: UIColor.yellow,

                        // If the point_count >= 100, color is red.
                        750: UIColor.red
                    ])
                )
            ),
            .bubbleStrokeWidth(0),

            // Only rendered data points which have a point_count property, which clusters do.
            .filter(from: NSPredicate(format: "point_count != NIL"))
        ]
    )
)

// Create a symbol layer to render the count of locations in a cluster.
map.layers.addLayer(
    SymbolLayer(
        source: source,
        options: [
            // Hide the icon image.
            .iconImage(nil),

            // Display the point count as text.
            .textField(from: NSExpression(forKeyPath: "point_count")),
            .textOffset(CGVector(dx: 0, dy: 0.4)),
            .textAllowOverlap(true),

            // Allow clustered points in this layer.
            .filter(from: NSPredicate(format: "point_count != NIL"))
        ]
    )
)

// Create a layer to render the individual locations.
map.layers.addLayer(
    SymbolLayer(
        source: source,
        options: [
            // Filter out clustered points from this layer.
            .filter(from: NSPredicate(format: "point_count = NIL"))
        ]
    )
)
下图显示了上述代码,显示气泡层中的聚类点特征,这些特征根据聚类中的点数进行缩放和着色。 使用符号层呈现非聚类点。

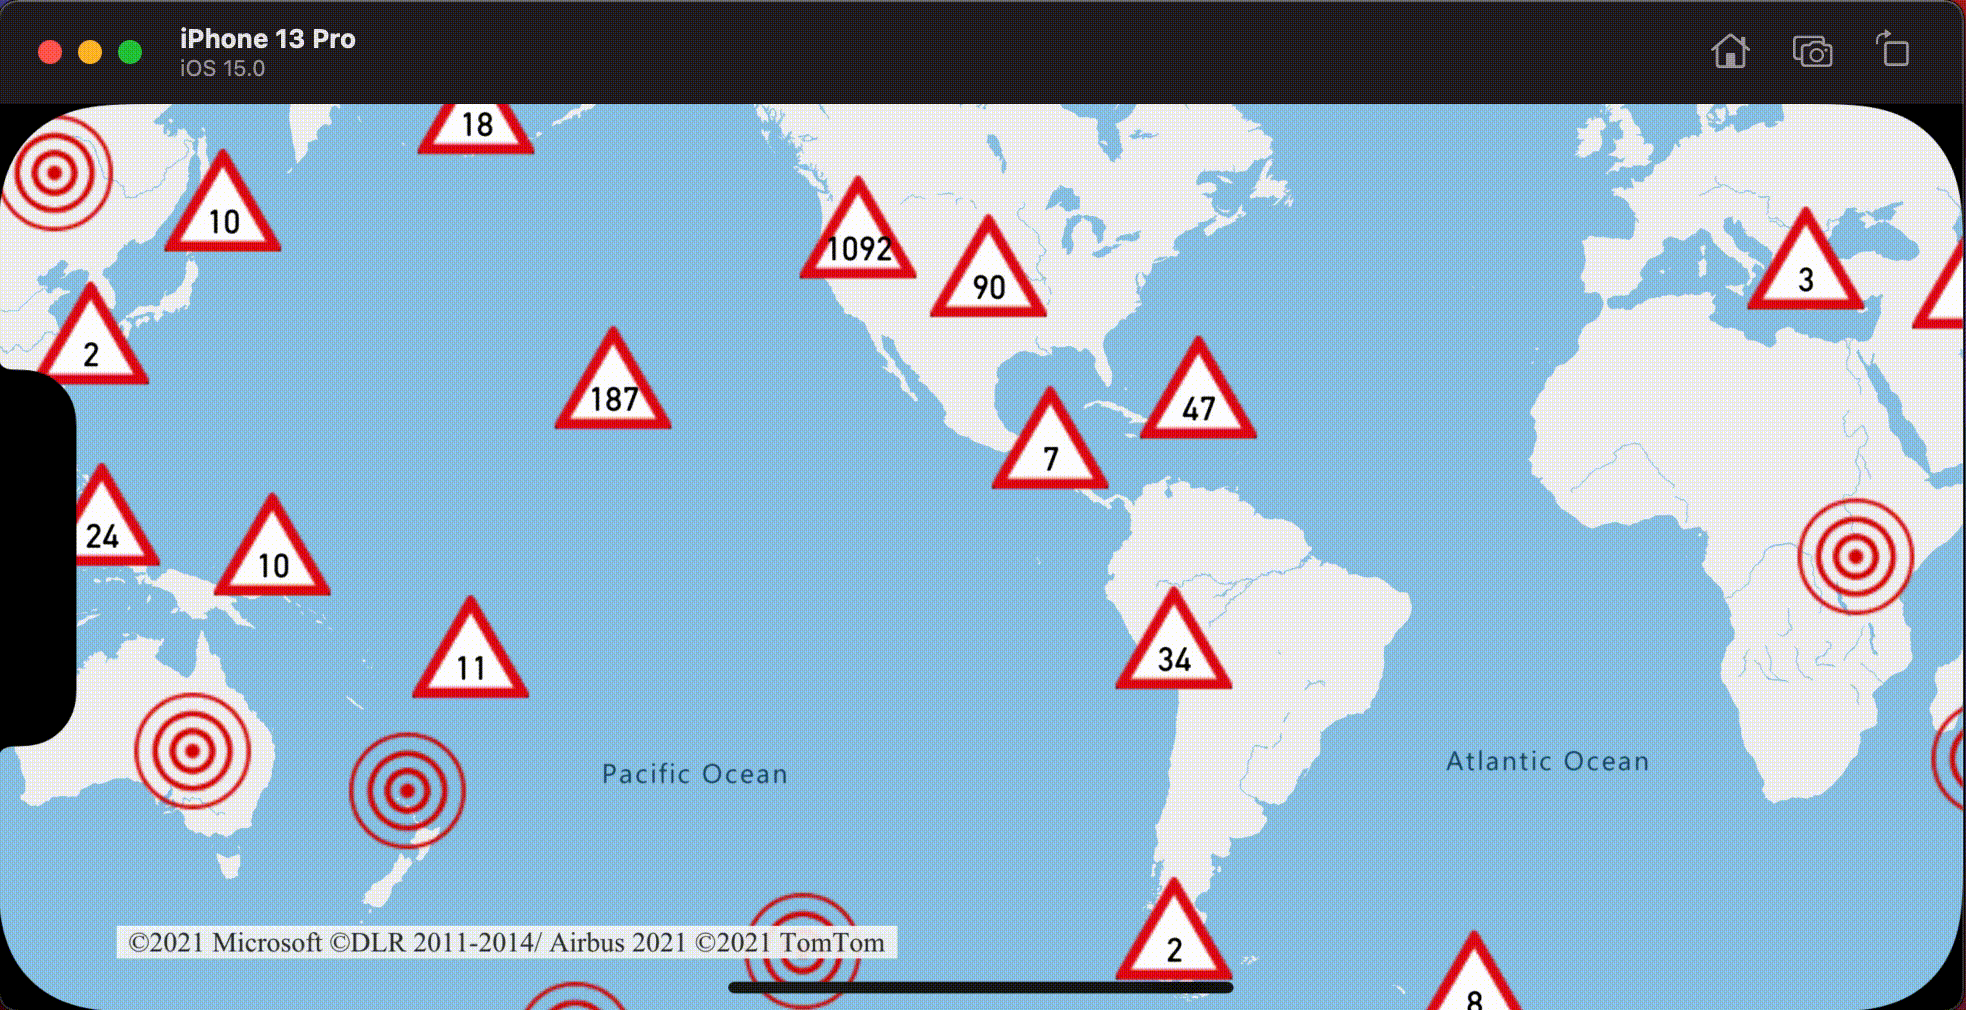
使用符号层显示聚类
显示数据点时,符号层会自动隐藏彼此重叠的符号,以确保更清晰的用户界面。 如果要在地图上显示数据点密度,则可能不需要此默认行为。 但是,可以更改这些设置。 若要显示所有符号,请将符号层的 iconAllowOverlap 选项设置为 true。
使用聚类显示数据点密度,同时保持整洁的用户界面。 下面的示例演示如何使用符号层添加自定义符号和表示聚类及各个数据点。
// Load all the custom image icons into the map resources.
map.images.add(UIImage(named: "earthquake_icon")!, withID: "earthquake_icon")
map.images.add(UIImage(named: "warning-triangle-icon")!, withID: "warning-triangle-icon")

// Create a data source and add it to the map.
let source = DataSource(options: [
    // Tell the data source to cluster point data.
    .cluster(true)
])

// Import the geojson data and add it to the data source.
let url = URL(string: "https://earthquake.usgs.gov/earthquakes/feed/v1.0/summary/all_week.geojson")!
source.importData(fromURL: url)

// Add data source to the map.
map.sources.add(source)

// Create a layer to render the individual locations.
map.layers.addLayer(
    SymbolLayer(
        source: source,
        options: [
            .iconImage("earthquake_icon"),

            // Filter out clustered points from this layer.
            .filter(from: NSPredicate(format: "point_count = NIL"))
        ]
    )
)

// Create a symbol layer to render the clusters.
map.layers.addLayer(
    SymbolLayer(
        source: source,
        options: [
            .iconImage("warning-triangle-icon"),
            .textField(from: NSExpression(forKeyPath: "point_count")),
            .textOffset(CGVector(dx: 0, dy: -0.4)),

            // Allow clustered points in this layer.
            .filter(from: NSPredicate(format: "point_count != NIL"))
        ]
    )
)
对于本示例,以下图像已加载到应用的资产文件夹中。
| earthquake-icon.png | warning-triangle-icon.png |
下图显示了上述代码,这些代码使用自定义图标呈现聚类点和非聚类点特征。
聚类和热度地图层
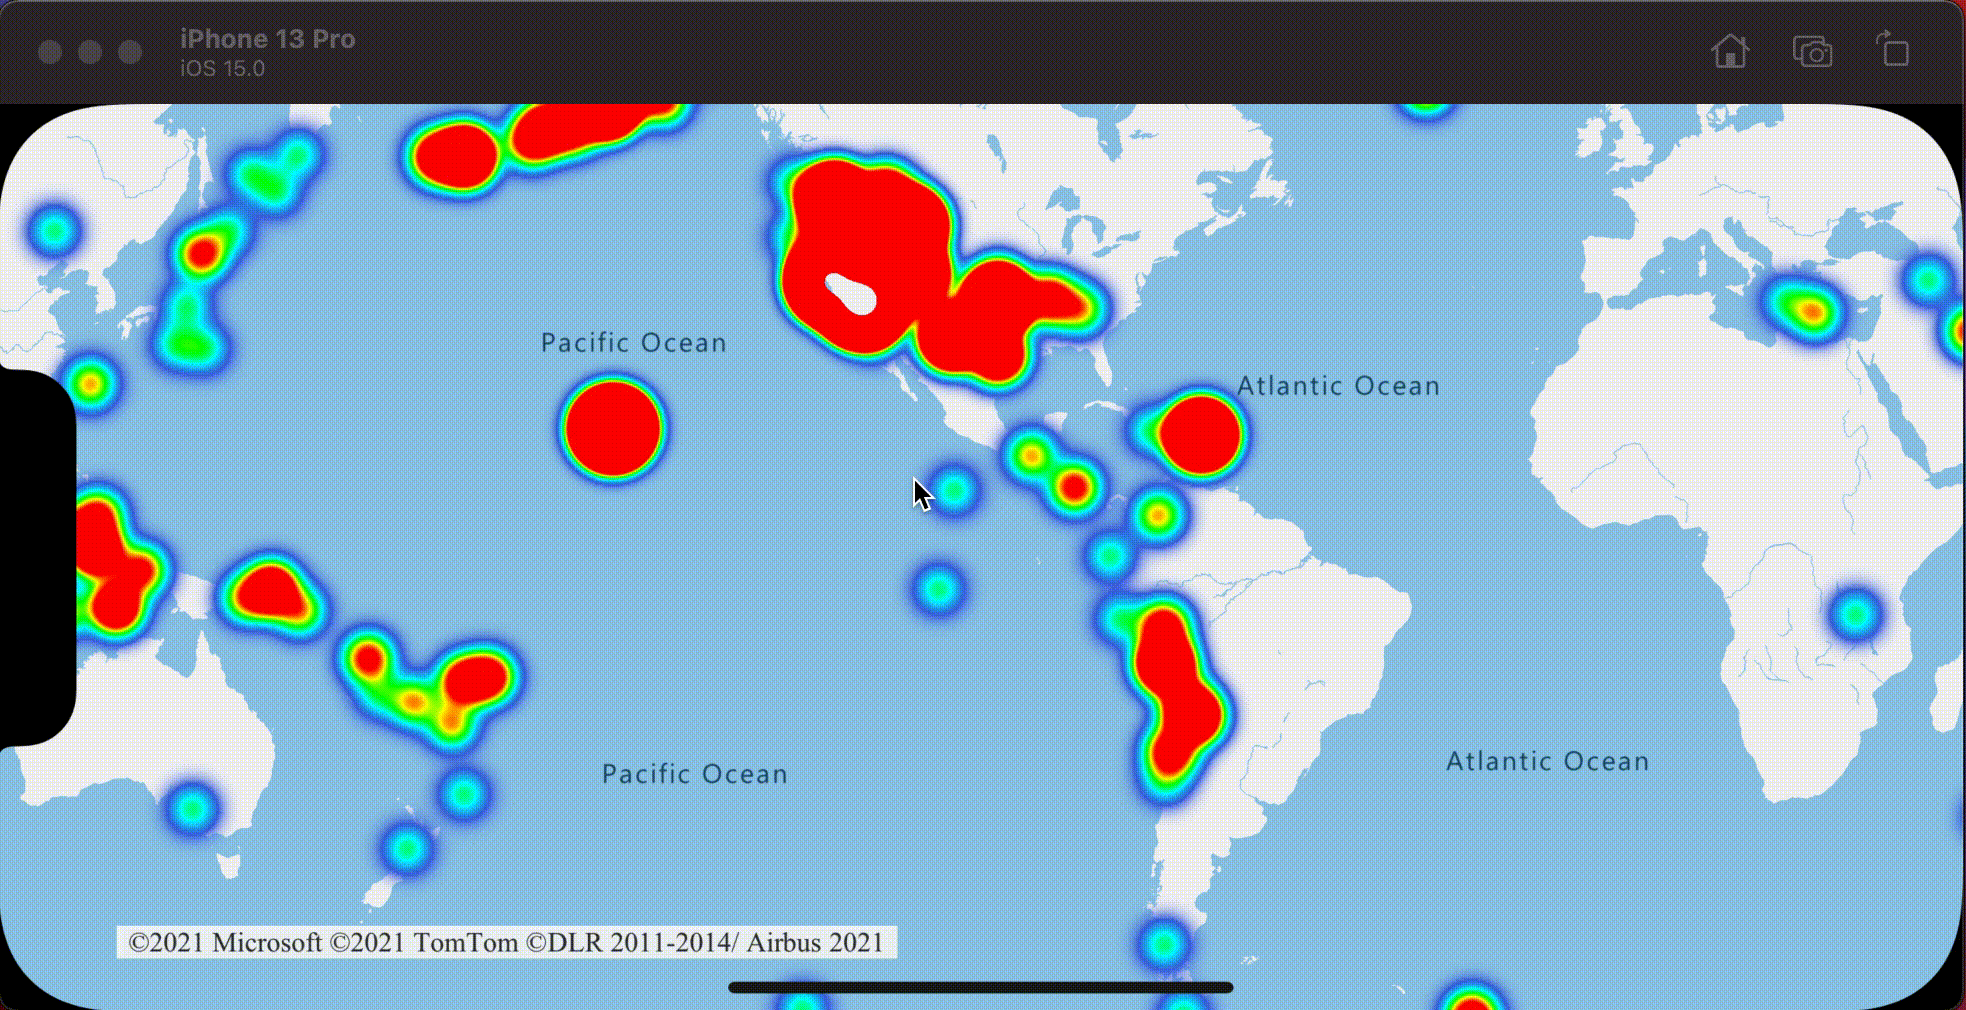
热度地图是在地图上显示数据密度的好方法。 此可视化方法可以自行处理大量数据点。 如果数据点进行了聚类,并且聚类大小用作热度地图的权重,则热度地图可以处理更多的数据。 若要实现此选项,请将热度地图层的 heatmapWeight 选项设置为 NSExpression(forKeyPath: "point_count")。 在聚类半径较小时,热度地图看起来几乎与使用非聚类数据点的热度地图完全相同,但性能会更好。 但是,聚类半径越小,热度地图便越精确,不过性能优势便越少。
// Create a data source and enable clustering.
let source = DataSource(options: [
    // Tell the data source to cluster point data.
    .cluster(true),

    // The radius in points to cluster points together.
    .clusterRadius(10)
])

// Import the geojson data and add it to the data source.
let url = URL(string: "https://earthquake.usgs.gov/earthquakes/feed/v1.0/summary/all_week.geojson")!
source.importData(fromURL: url)

// Add data source to the map.
map.sources.add(source)

// Create a heat map and add it to the map.
map.layers.insertLayer(
    HeatMapLayer(
        source: source,
        options: [
            // Set the weight to the point_count property of the data points.
            .heatmapWeight(from: NSExpression(forKeyPath: "point_count")),

            // Optionally adjust the radius of each heat point.
            .heatmapRadius(20)
        ]
    ),
    below: "labels"
)
下图显示了上述显示热度地图的代码,该地图通过使用聚类点特征和聚类计数作为热度地图中的权重进行了优化。
聚类数据点上的点击事件
当点击事件在包含聚类数据点的层上发生时,聚类数据点会作为 GeoJSON 点特征对象返回给事件。 此点特征具有以下属性:
| 属性名称 | 类型 | 说明 |
|---|---|---|
cluster |
boolean | 指示特征是否表示聚类。 |
point_count |
数字 | 聚类包含的点数。 |
point_count_abbreviated |
字符串 | 用于缩写过长的 point_count 值的字符串。 (例如,将 4,000 缩写为 4K) |
此示例采用一个呈现聚类点并添加点击事件的气泡层。 当点击事件触发时,代码会计算地图,并将它缩放到下一个缩放级别,聚类将在该缩放级别分解。 此功能是使用 DataSource 类的 zoomLevel(forExpanding:) 方法实现的。
// Create a data source and enable clustering.
let source = DataSource(options: [
    // Tell the data source to cluster point data.
    .cluster(true),

    // The radius in points to cluster data points together.
    .clusterRadius(45),

    // The maximum zoom level in which clustering occurs.
    // If you zoom in more than this, all points are rendered as symbols.
    .clusterMaxZoom(15)
])

// Set data source to the class property to use in events handling later.
self.source = source

// Import the geojson data and add it to the data source.
let url = URL(string: "https://earthquake.usgs.gov/earthquakes/feed/v1.0/summary/all_week.geojson")!
source.importData(fromURL: url)

// Add data source to the map.
map.sources.add(source)

// Create a bubble layer for rendering clustered data points.
let clusterBubbleLayer = BubbleLayer(
    source: source,
    options: [
        // Scale the size of the clustered bubble based on the number of points in the cluster.
        .bubbleRadius(
            from: NSExpression(
                forAZMStepping: NSExpression(forKeyPath: "point_count"),
                // Default of 20 point radius.
                from: NSExpression(forConstantValue: 20),
                stops: NSExpression(forConstantValue: [
                    // If point_count >= 100, radius is 30 points.
                    100: 30,

                    // If point_count >= 750, radius is 40 points.
                    750: 40
                ])
            )
        ),

        // Change the color of the cluster based on the value on the point_count property of the cluster.
        .bubbleColor(
            from: NSExpression(
                forAZMStepping: NSExpression(forKeyPath: "point_count"),
                // Default to green.
                from: NSExpression(forConstantValue: UIColor.green),
                stops: NSExpression(forConstantValue: [
                    // If the point_count >= 100, color is yellow.
                    100: UIColor.yellow,

                    // If the point_count >= 100, color is red.
                    750: UIColor.red
                ])
            )
        ),
        .bubbleStrokeWidth(0),

        // Only rendered data points which have a point_count property, which clusters do.
        .filter(from: NSPredicate(format: "point_count != NIL"))
    ]
)

// Add the clusterBubbleLayer to the map.
map.layers.addLayer(clusterBubbleLayer)

// Create a symbol layer to render the count of locations in a cluster.
map.layers.addLayer(
    SymbolLayer(
        source: source,
        options: [
            // Hide the icon image.
            .iconImage(nil),

            // Display the point count as text.
            .textField(from: NSExpression(forKeyPath: "point_count_abbreviated")),

            // Offset the text position so that it's centered nicely.
            .textOffset(CGVector(dx: 0, dy: 0.4)),

            // Allow text overlapping so text is visible anyway
            .textAllowOverlap(true),

            // Allow clustered points in this layer.
            .filter(from: NSPredicate(format: "point_count != NIL"))
        ]
    )
)

// Create a layer to render the individual locations.
map.layers.addLayer(
    SymbolLayer(
        source: source,
        options: [
            // Filter out clustered points from this layer.
            .filter(from: NSPredicate(format: "point_count = NIL"))
        ]
    )
)

// Add the delegate to handle taps on the clusterBubbleLayer only.
map.events.addDelegate(self, for: [clusterBubbleLayer.id])
func azureMap(_ map: AzureMap, didTapOn features: [Feature]) {
    guard let source = source, let cluster = features.first else {
        // Data source have been released or no features provided
        return
    }

    // Get the cluster expansion zoom level. This is the zoom level at which the cluster starts to break apart.
    let expansionZoom = source.zoomLevel(forExpanding: cluster)

    // Update the map camera to be centered over the cluster.
    map.setCameraOptions([
        // Center the map over the cluster points location.
        .center(cluster.coordinate),

        // Zoom to the clusters expansion zoom level.
        .zoom(expansionZoom),

        // Animate the movement of the camera to the new position.
        .animationType(.ease),
        .animationDuration(200)
    ])
}
下图显示了上述在地图上显示聚类点的代码,点击地图时,可放大到聚类开始分解和扩展的下一缩放级别。
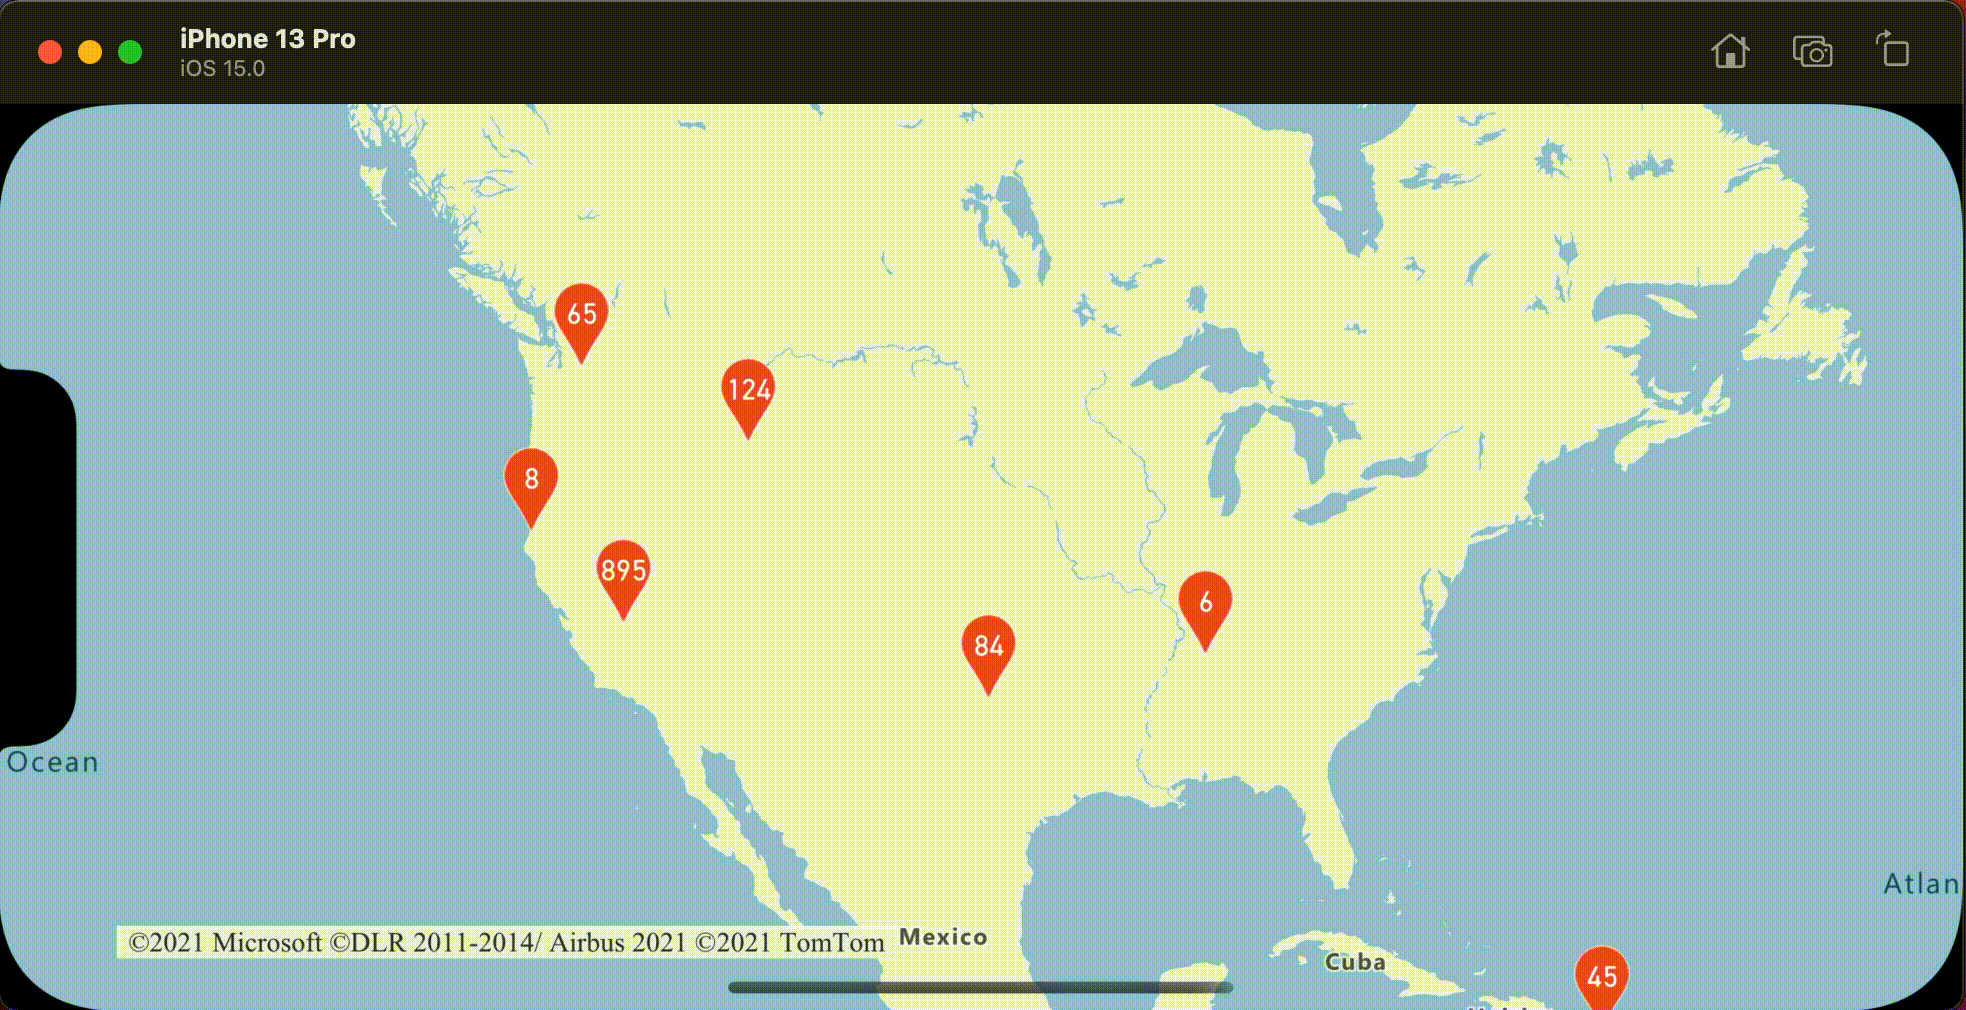
显示聚类区域
聚类表示的点数据会分散在某个区域。 在此示例中,当点击聚类时,会发生两个主要行为。 首先,聚类中包含的各个数据点用于计算凸包。 然后,凸包会显示在地图上以显示一个区域。 凸包是一种多边形,用于包装一组点(如松紧带),可以使用 convexHull(from:) 方法进行计算。 可以使用 leaves(of:offset:limit:) 方法从数据源中检索包含在聚类中的所有点。
// Create a data source and enable clustering.
let source = DataSource(options: [
    // Tell the data source to cluster point data.
    .cluster(true)
])

// Set data source to the class property to use in events handling later.
self.source = source

// Import the geojson data and add it to the data source.
let url = URL(string: "https://earthquake.usgs.gov/earthquakes/feed/v1.0/summary/all_week.geojson")!
source.importData(fromURL: url)

// Add data source to the map.
map.sources.add(source)

// Create a data source for the convex hull polygon.
// Since this will be updated frequently it is more efficient to separate this into its own data source.
let polygonDataSource = DataSource()

// Set polygon data source to the class property to use in events handling later.
self.polygonDataSource = polygonDataSource

// Add data source to the map.
map.sources.add(polygonDataSource)

// Add a polygon layer and a line layer to display the convex hull.
map.layers.addLayer(PolygonLayer(source: polygonDataSource))
map.layers.addLayer(LineLayer(source: polygonDataSource))

// Load an icon into the image sprite of the map.
map.images.add(.azm_markerRed, withID: "marker-red")

// Create a symbol layer to render the clusters.
let clusterLayer = SymbolLayer(
    source: source,
    options: [
        .iconImage("marker-red"),
        .textField(from: NSExpression(forKeyPath: "point_count_abbreviated")),
        .textOffset(CGVector(dx: 0, dy: -1.2)),
        .textColor(.white),
        .textSize(14),

        // Only rendered data points which have a point_count property, which clusters do.
        .filter(from: NSPredicate(format: "point_count != NIL"))
    ]
)

// Add the clusterLayer to the map.
map.layers.addLayer(clusterLayer)

// Create a layer to render the individual locations.
map.layers.addLayer(
    SymbolLayer(
        source: source,
        options: [
            // Filter out clustered points from this layer.
            .filter(from: NSPredicate(format: "point_count = NIL"))
        ]
    )
)

// Add the delegate to handle taps on the clusterLayer only
// and then calculate the convex hull of all the points within a cluster.
map.events.addDelegate(self, for: [clusterLayer.id])
func azureMap(_ map: AzureMap, didTapOn features: [Feature]) {
    guard let source = source, let polygonDataSource = polygonDataSource, let cluster = features.first else {
        // Data source have been released or no features provided
        return
    }

    // Get all points in the cluster. Set the offset to 0 and the max int value to return all points.
    let featureLeaves = source.leaves(of: cluster, offset: 0, limit: .max)

    // When only two points in a cluster. Render a line.
    if featureLeaves.count == 2 {

        // Extract the locations from the feature leaves.
        let locations = featureLeaves.map(\.coordinate)

        // Create a line from the points.
        polygonDataSource.set(geometry: Polyline(locations))

        return
    }

    // When more than two points in a cluster. Render a polygon.
    if let hullPolygon = Math.convexHull(from: featureLeaves) {

        // Overwrite all data in the polygon data source with the newly calculated convex hull polygon.
        polygonDataSource.set(geometry: hullPolygon)
    }
}
下图显示了上述代码,该代码显示被点击聚类内所有点的区域。
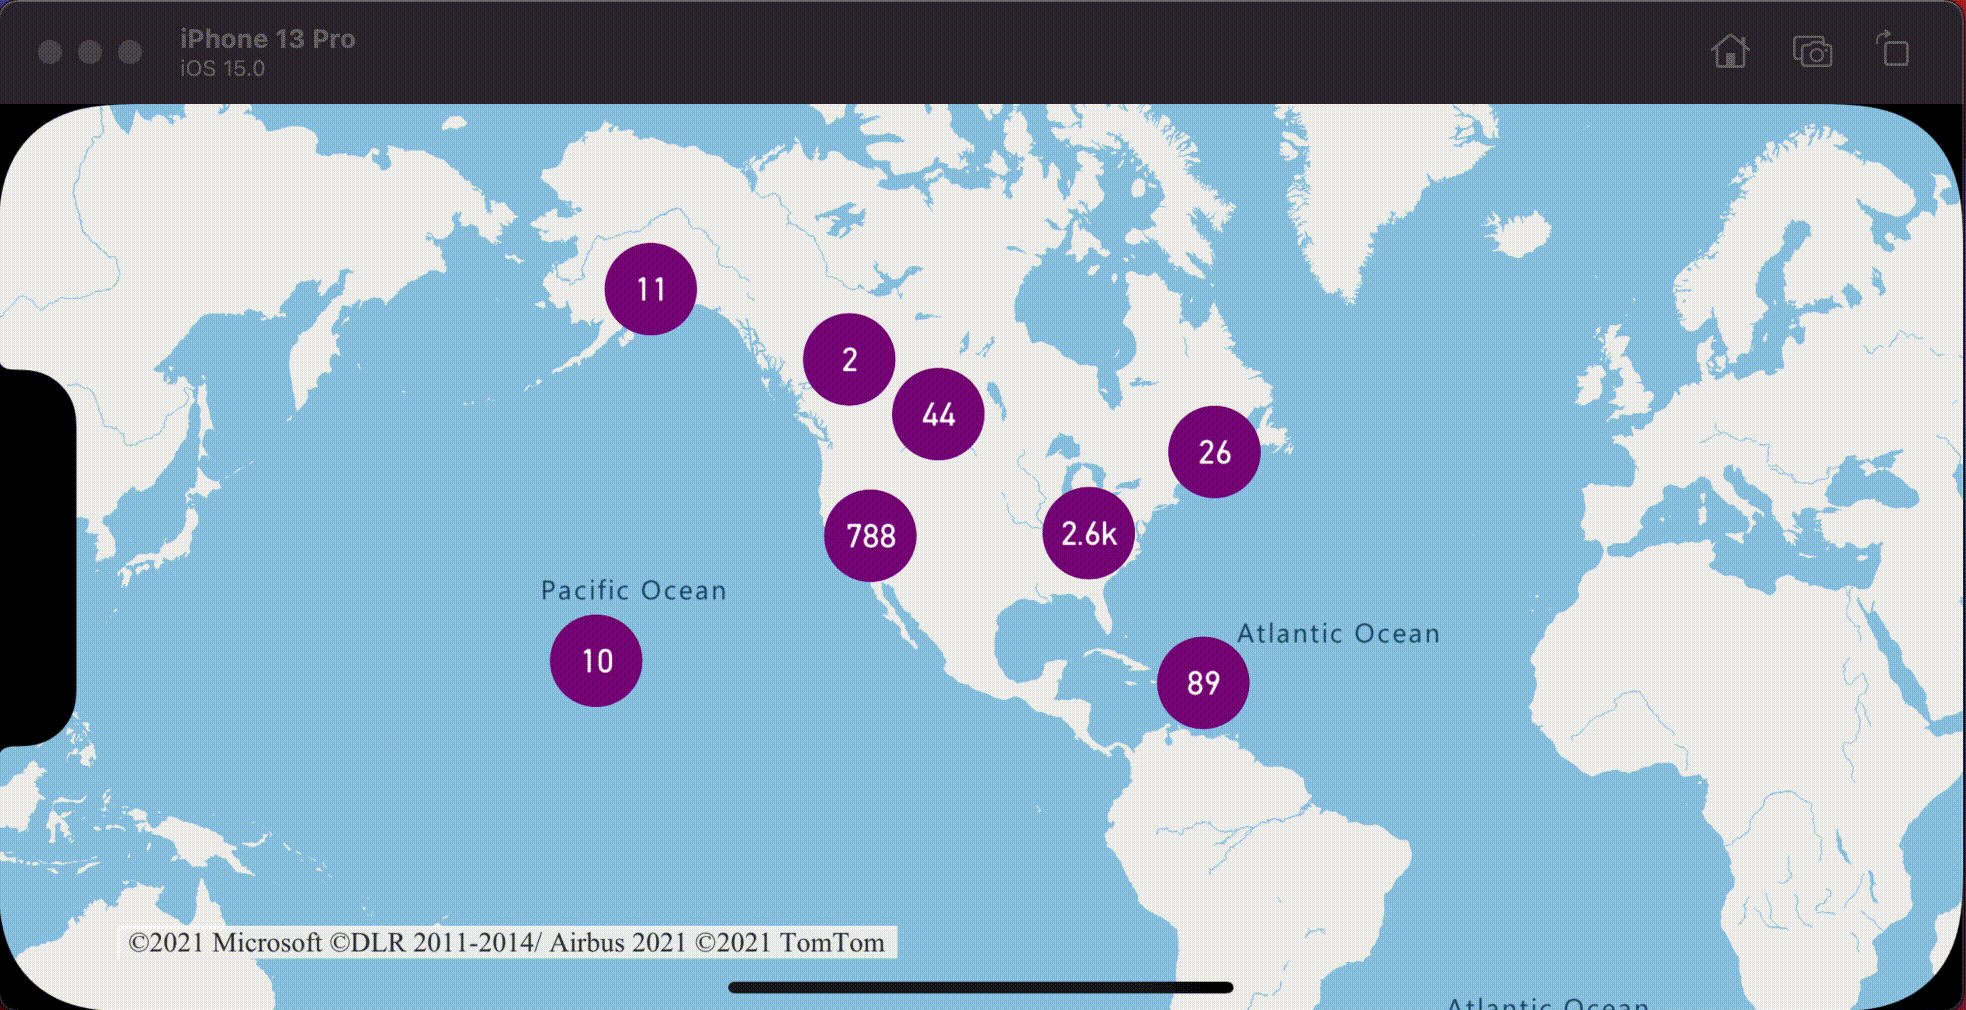
聚合聚类中的数据
通常使用符号以及聚类中的点数来表示聚类。 但有时需要使用其他指标自定义聚类样式。 使用聚类属性,可以创建自定义属性,这相当于基于聚类中每个点的属性进行计算。 可以在 DataSource 的 clusterProperties 选项中定义聚类属性。
以下代码基于聚类中每个数据点的实体类型属性计算计数。 当用户点击某个聚类时,将显示一个弹出窗口,其中包含有关该聚类的其他信息。
// Create a popup and add it to the map.
let popup = Popup()
map.popups.add(popup)

// Set popup to the class property to use in events handling later.
self.popup = popup

// Close the popup initially.
popup.close()

// Create a data source and enable clustering.
let source = DataSource(options: [
    // Tell the data source to cluster point data.
    .cluster(true),

    // The radius in points to cluster data points together.
    .clusterRadius(50),

    // Calculate counts for each entity type in a cluster as custom aggregate properties.
    .clusterProperties(self.entityTypes.map { entityType in
        ClusterProperty(
            name: entityType,
            operator: NSExpression(
                forFunction: "sum:",
                arguments: [
                    NSExpression.featureAccumulatedAZMVariable,
                    NSExpression(forKeyPath: entityType)
                ]
            ),
            map: NSExpression(
                forConditional: NSPredicate(format: "EntityType = '\(entityType)'"),
                trueExpression: NSExpression(forConstantValue: 1),
                falseExpression: NSExpression(forConstantValue: 0)
            )
        )
    })
])

// Import the geojson data and add it to the data source.
let url = URL(string: "https://samples.azuremaps.com/data/geojson/SamplePoiDataSet.json")!
source.importData(fromURL: url)

// Add data source to the map.
map.sources.add(source)

// Create a bubble layer for rendering clustered data points.
let clusterBubbleLayer = BubbleLayer(
    source: source,
    options: [
        .bubbleRadius(20),
        .bubbleColor(.purple),
        .bubbleStrokeWidth(0),

        // Only rendered data points which have a point_count property, which clusters do.
        .filter(from: NSPredicate(format: "point_count != NIL"))
    ]
)

// Add the clusterBubbleLayer to the map.
map.layers.addLayer(clusterBubbleLayer)

// Create a symbol layer to render the count of locations in a cluster.
map.layers.addLayer(
    SymbolLayer(
        source: source,
        options: [
            // Hide the icon image.
            .iconImage(nil),

            // Display the 'point_count_abbreviated' property value.
            .textField(from: NSExpression(forKeyPath: "point_count_abbreviated")),

            .textColor(.white),
            .textOffset(CGVector(dx: 0, dy: 0.4)),

            // Allow text overlapping so text is visible anyway
            .textAllowOverlap(true),

            // Only rendered data points which have a point_count property, which clusters do.
            .filter(from: NSPredicate(format: "point_count != NIL"))
        ]
    )
)

// Create a layer to render the individual locations.
map.layers.addLayer(
    SymbolLayer(
        source: source,
        options: [
            // Filter out clustered points from this layer.
            SymbolLayerOptions.filter(from: NSPredicate(format: "point_count = NIL"))
        ]
    )
)

// Add the delegate to handle taps on the clusterBubbleLayer only
// and display the aggregate details of the cluster.
map.events.addDelegate(self, for: [clusterBubbleLayer.id])
func azureMap(_ map: AzureMap, didTapOn features: [Feature]) {
    guard let popup = popup, let cluster = features.first else {
        // Popup has been released or no features provided
        return
    }

    // Create a number formatter that removes decimal places.
    let nf = NumberFormatter()
    nf.maximumFractionDigits = 0

    // Create the popup's content.
    var text = ""

    let pointCount = cluster.properties["point_count"] as! Int
    let pointCountString = nf.string(from: pointCount as NSNumber)!

    text.append("Cluster size: \(pointCountString) entities\n")

    entityTypes.forEach { entityType in
        text.append("\n")
        text.append("\(entityType): ")

        // Get the aggregated entity type count from the properties of the cluster by name.
        let aggregatedCount = cluster.properties[entityType] as! Int
        let aggregatedCountString = nf.string(from: aggregatedCount as NSNumber)!

        text.append(aggregatedCountString)
    }

    // Create the custom view for the popup.
    let customView = PopupTextView()

    // Set the text to the custom view.
    customView.setText(text)

    // Get the position of the cluster.
    let position = Math.positions(from: cluster).first!

    // Set the options on the popup.
    popup.setOptions([
        // Set the popups position.
        .position(position),

        // Set the anchor point of the popup content.
        .anchor(.bottom),

        // Set the content of the popup.
        .content(customView)
    ])

    // Open the popup.
    popup.open()
}
弹出窗口遵循显示弹出窗口文档中列出的步骤。
下图显示了上述代码,该代码显示一个弹出窗口,其中包含被点击聚类点中所有点的每个实体值类型的聚合计数。
其他信息
要将更多数据添加到地图,请执行以下操作: