Een polygoon-extrusielaag toevoegen aan de kaart (Android SDK)
In dit artikel leest u hoe u de polygoon-extrusielaag gebruikt om gebieden van Polygon en MultiPolygon functiegeometrieën weer te geven als geëxtrudeerde vormen.
Notitie
Buitengebruikstelling van Azure Maps Android SDK
De Systeemeigen SDK van Azure Maps voor Android is nu afgeschaft en wordt buiten gebruik gesteld op 3-31-25. Om serviceonderbrekingen te voorkomen, migreert u tegen 3-31-25 naar de Azure Maps-web-SDK. Zie de migratiehandleiding voor De Android SDK voor Azure Maps voor meer informatie.
Een polygoonextrusielaag gebruiken
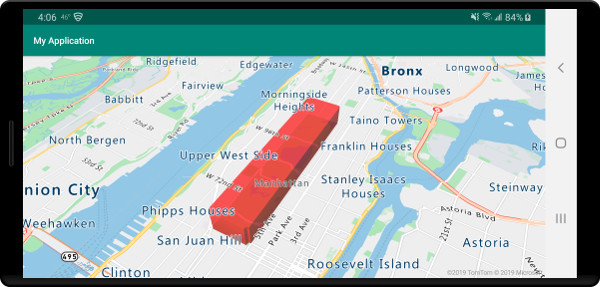
Verbind de polygoon-extrusielaag met een gegevensbron. Vervolgens geladen op de kaart. De polygoonextrusielaag geeft de gebieden van een Polygon en MultiPolygon kenmerken weer als geëxtrudeerde vormen. De height eigenschappen van base de polygoon-extrusielaag definiëren de basisafstand van de grond en hoogte van de geëxtrudeerde vorm in meters. De volgende code laat zien hoe u een veelhoek maakt, deze toevoegt aan een gegevensbron en deze weergeeft met behulp van de klasse Polygon-extrusielaag.
Notitie
De base waarde die is gedefinieerd in de extrusielaag van de polygoon moet kleiner zijn dan of gelijk zijn aan die van de height.
//Create a data source and add it to the map.
DataSource source = new DataSource();
map.sources.add(source);

//Create a polygon.
source.add(Polygon.fromLngLats(
    Arrays.asList(
        Arrays.asList(
            Point.fromLngLat(-73.958383, 40.800279),
            Point.fromLngLat(-73.981547, 40.768459),
            Point.fromLngLat(-73.981246, 40.767761),
            Point.fromLngLat(-73.973618, 40.764616),
            Point.fromLngLat(-73.973060, 40.765128),
            Point.fromLngLat(-73.972599, 40.764908),
            Point.fromLngLat(-73.949446, 40.796584),
            Point.fromLngLat(-73.949661, 40.797088),
            Point.fromLngLat(-73.957815, 40.800523),
            Point.fromLngLat(-73.958383, 40.800279)
        )
    )
));

//Create and add a polygon extrusion layer to the map below the labels so that they are still readable.
PolygonExtrusionLayer layer = new PolygonExtrusionLayer(source,
    fillColor("#fc0303"),
    fillOpacity(0.7f),
    height(500f)
);

//Create and add a polygon extrusion layer to the map below the labels so that they are still readable.
map.layers.add(layer, "labels");
//Create a data source and add it to the map.
val source = DataSource()
map.sources.add(source)

//Create a polygon.
source.add(
    Polygon.fromLngLats(
        Arrays.asList(
            Arrays.asList(
                Point.fromLngLat(-73.958383, 40.800279),
                Point.fromLngLat(-73.981547, 40.768459),
                Point.fromLngLat(-73.981246, 40.767761),
                Point.fromLngLat(-73.973618, 40.764616),
                Point.fromLngLat(-73.973060, 40.765128),
                Point.fromLngLat(-73.972599, 40.764908),
                Point.fromLngLat(-73.949446, 40.796584),
                Point.fromLngLat(-73.949661, 40.797088),
                Point.fromLngLat(-73.957815, 40.800523),
                Point.fromLngLat(-73.958383, 40.800279)
            )
        )
    )
)

//Create and add a polygon extrusion layer to the map below the labels so that they are still readable.
val layer = PolygonExtrusionLayer(
    source,
    fillColor("#fc0303"),
    fillOpacity(0.7f),
    height(500f)
)

//Create and add a polygon extrusion layer to the map below the labels so that they are still readable.
map.layers.add(layer, "labels")
In de volgende schermopname ziet u de bovenstaande code, waarbij een veelhoek verticaal wordt uitgerekt met behulp van een extrusielaag voor veelhoeken.
Gegevensgestuurde veelhoeken toevoegen
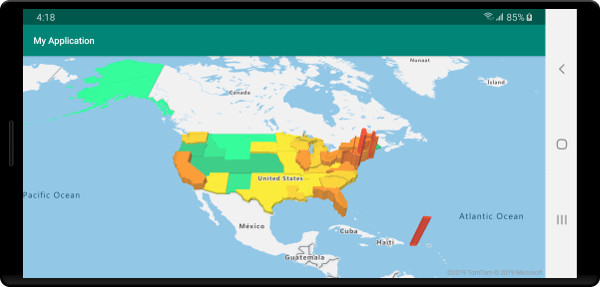
Een choropletenkaart kan worden weergegeven met behulp van de polygoonextrusielaag. Stel de height en fillColor eigenschappen van de extrusielaag in op de meting van de statistische variabele in de Polygon en MultiPolygon functiegeometrieën. In het volgende codevoorbeeld ziet u een geëxtrudeerde choroplethkaart van de Verenigde Staten op basis van de meting van de bevolkingsdichtheid per staat.
//Create a data source and add it to the map.
DataSource source = new DataSource();

//Import the geojson data and add it to the data source.
source.importDataFromUrl("https://samples.azuremaps.com/data/geojson/US_States_Population_Density.json");

//Add data source to the map.
map.sources.add(source);

//Create and add a polygon extrusion layer to the map below the labels so that they are still readable.
PolygonExtrusionLayer layer = new PolygonExtrusionLayer(source,
    fillOpacity(0.7f),
    fillColor(
        step(
            get("density"),
            literal("rgba(0, 255, 128, 1)"),
            stop(10, "rgba(9, 224, 118, 1)"),
            stop(20, "rgba(11, 191, 103, 1)"),
            stop(50, "rgba(247, 227, 5, 1)"),
            stop(100, "rgba(247, 199, 7, 1)"),
            stop(200, "rgba(247, 130, 5, 1)"),
            stop(500, "rgba(247, 94, 5, 1)"),
            stop(1000, "rgba(247, 37, 5, 1)")
        )
    ),
    height(
        interpolate(
            linear(),
            get("density"),
            stop(0, 100),
            stop(1200, 960000)
        )
    )
);

//Create and add a polygon extrusion layer to the map below the labels so that they are still readable.
map.layers.add(layer, "labels");
//Create a data source and add it to the map.
val source = DataSource()

//Import the geojson data and add it to the data source.
source.importDataFromUrl("https://samples.azuremaps.com/data/geojson/US_States_Population_Density.json")

//Add data source to the map.
map.sources.add(source)

//Create and add a polygon extrusion layer to the map below the labels so that they are still readable.
val layer = PolygonExtrusionLayer(
    source,
    fillOpacity(0.7f),
    fillColor(
        step(
            get("density"),
            literal("rgba(0, 255, 128, 1)"),
            stop(10, "rgba(9, 224, 118, 1)"),
            stop(20, "rgba(11, 191, 103, 1)"),
            stop(50, "rgba(247, 227, 5, 1)"),
            stop(100, "rgba(247, 199, 7, 1)"),
            stop(200, "rgba(247, 130, 5, 1)"),
            stop(500, "rgba(247, 94, 5, 1)"),
            stop(1000, "rgba(247, 37, 5, 1)")
        )
    ),
    height(
        interpolate(
            linear(),
            get("density"),
            stop(0, 100),
            stop(1200, 960000)
        )
    )
)

//Create and add a polygon extrusion layer to the map below the labels so that they are still readable.
map.layers.add(layer, "labels")
In de volgende schermopname ziet u een choroplethkaart van amerikaanse staten die gekleurd en verticaal zijn uitgerekt als geëxtrudeerde veelhoeken op basis van bevolkingsdichtheid.
Volgende stappen
Zie de volgende artikelen voor meer codevoorbeelden die u aan uw kaarten kunt toevoegen: