Create custom metrics
Important
Some or all of this functionality is available as part of a preview release. The content and the functionality are subject to change.
You can extend the capability for defining and computing custom metrics by following the same pattern that is used for prebuilt metrics.
Generate aggregate tables
Based on the metric that you want to compute, either of following scenarios mentioned are applicable. Follow the steps for the scenario that is applicable for you.
Scenario 1
The prebuilt aggregate table supports the required measurement data at the required set of dimensions, so you don't need to make changes in the aggregate table.
Generate the prebuilt aggregate table as explained in Generate aggregates tables.
Refresh the DatasetForMetricsMeasures_DTST semantic model.
Scenario 2
The Prebuilt aggregate tables support the required measurement data, but the required dimension is missing.
Add the required dimension to the prebuilt aggregate table by updating the computation logic in the notebook that contains the aggregate table’s computation logic. For example, if the EmissionsAggregate table’s computation logic needs to be updated, then update the logic in CreateAggregateForEmissionsMetrics_INTB.
Run the notebook with updated computation logic to generate the aggregate table.
Note
Don't delete any existing dimension from the prebuilt aggregate able to avoid affecting the prebuilt metric computation.
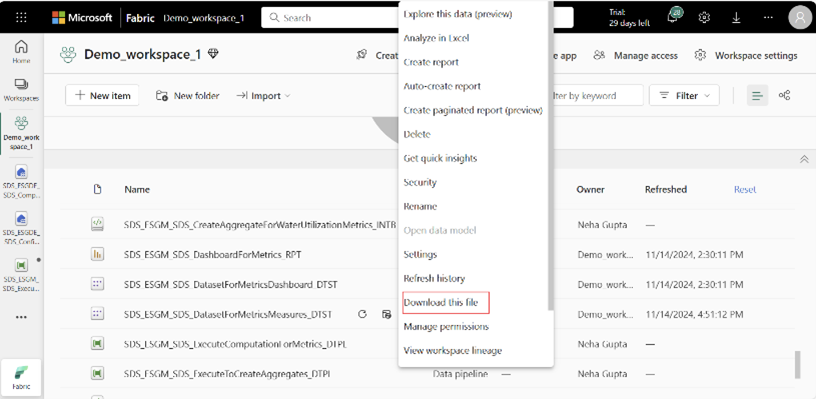
Update the aggregate table in the DatasetForMetricsMeasures_DTST semantic model:
Download the DatasetForMetricsMeasures_DTST semantic model from workspace page and open the model in Power BI Desktop.
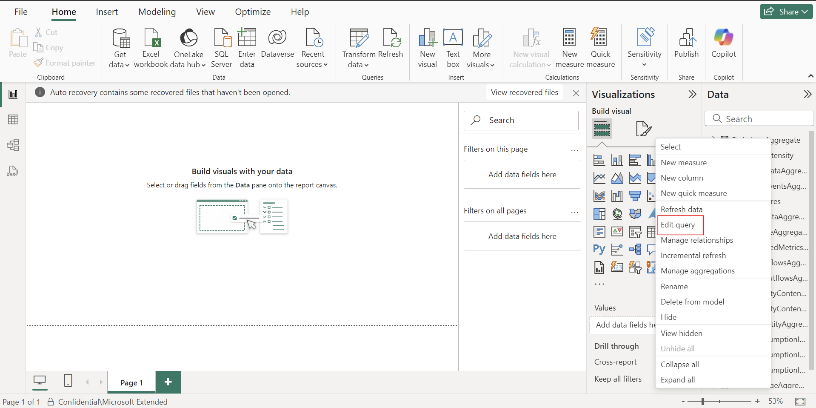
In Power BI Desktop, right-click the updated aggregate table and select Edit Query to open the Power Query editor.
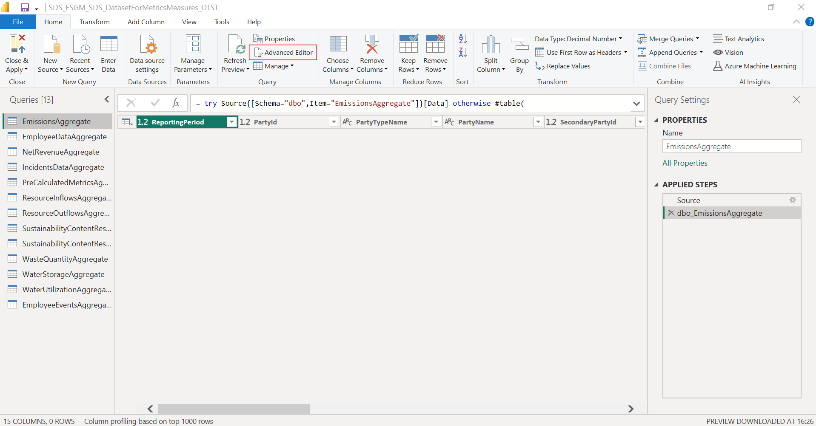
In the Power Query Editor, open the Advanced Editor by selecting Advanced Editor on the ribbon.
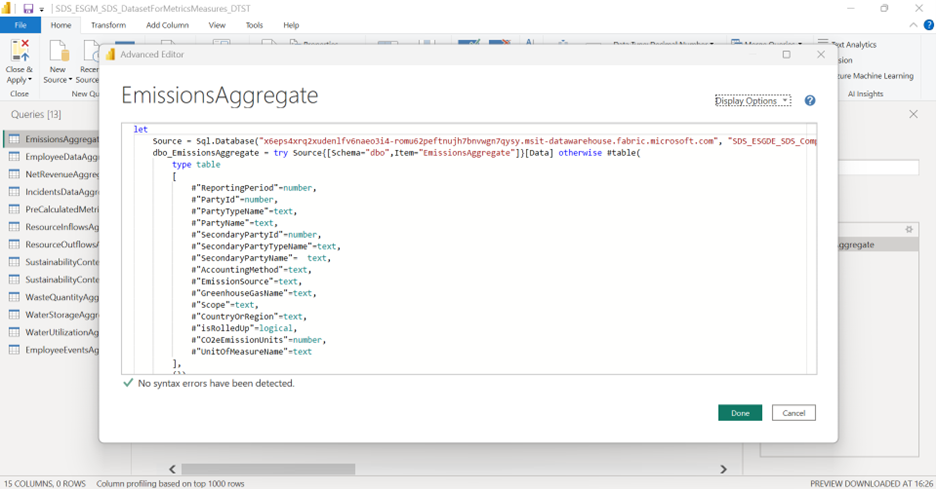
Update the query code to include the new column in any steps where columns are referenced, adjusting any error handling as needed for the new column. Select Done.
Select Refresh Preview to view the updated data. After confirming, select Close & Apply to apply the changes to the data model.
Save the updated Power BI file with the added measures and schema changes. Publish the updated semantic model to the target workspace in the Power BI service, overwriting the previous version in the workspace.


Scenario 3
Prebuilt aggregate tables don't support the required measurement data:
Create a custom aggregate table by defining the computation logic (using similar patterns as used for prebuilt aggregate tables) in a notebook.
Run the notebook to generate the aggregate table in the computedESGMetrics_LH lakehouse.
Add the custom aggregate table to DatasetForMetricsMeasures_DTST:
Download the semantic model from the workspace page and open the model in Power BI Desktop.
In Power BI Desktop, Select OneLake data hub, select Lakehouses, and then in the popup select the ComputedESGMetrics lakehouse. Select the dropdown arrow on the Connect button, and then select Connect to SQL endpoint.
Select the custom aggregate tables to import in the semantic model. Select Load to bring the tables into Power BI Desktop.
In the window prompt, set the Connection Setting to Import mode to bring the data into the model and select OK.
When the tables load in the Data pane, right-click on the newly added tables and select Edit Query to open the Power Query Editor.
Open the Advanced Editor in the Query Editor pane to review the query code. Add necessary error handling code to manage any unexpected data issues.
By default, this code appears in the query editor pane:
let
   Source = Sql.Database("x6eps4xrq2xudenlfv6naeo3i4-lzqqwvhquhb2e7afwzp3ge4.msit-datawarehouse.fabric.microsoft.com", "SDS_ESGDE_ems_ComputedESGMetrics_LH"),
   <Table Name>= Source{[Schema="dbo",Item="<Table Name from the Lakehouse>"]}[Data]
in
<Table Name>
Replace this query with the following code, making necessary changes based on the table and columns present in your custom aggregate table:
let
   Source = Sql.Database("x6eps4xrq2xudenlfv6naeo3i4-lzqqwvhquhb2e7afwzp3ge4.msit-datawarehouse.fabric.microsoft.com", "SDS_ESGDE_ems_ComputedESGMetrics_LH"),
   dbo_EmissionsAggregate = try Source{[Schema="dbo",Item="EmissionsAggregate"]}[Data] otherwise #table(
       type table
       [
           #"ReportingPeriod"=number,
           #"PartyId"=number,
           #"PartyTypeName"=text,
           #"PartyName"=text,
           #"SecondaryPartyId"=number,
           #"SecondaryPartyTypeName"=text,
           #"SecondaryPartyName"=text,
           #"EmissionSource"=text,
#"isRolledUp"=logical,
           #"CO2eEmissionUnits"=number,
           #"UnitOfMeasureName"=text
       ],
       {})
in
   dbo_EmissionsAggregate
To save the changes, select Done.
To apply the changes, select Close & Apply in Power Query Editor.
In the Model view, add relationships between the newly added tables if required.
Save the updated Power BI Desktop file. Publish the model to the workspace in the Power BI service by selecting File > Publish > Publish to Power BI and choosing the target workspace. This action overwrites the existing semantic model in the workspace without changing the model’s ID.
Create another Power BI measure for calculating the custom metric
As mentioned in Compute and store metrics data, ESG metrics computation is specified in terms of Power BI measure, filters, and dimensions.
You can go through the list of prebuilt measures and check if you can reuse any of the existing measures for computing the custom metric. If you can reuse an existing measure, you can skip this step.
If you can't use an existing measure, create another Power BI measure in the DatasetForMetricsMeasures_DTST.
Select the DatasetForMetricsMeasures_DTST semantic model item from the workspace list view.
Select Open data model from the semantic model page.
Note
If Open data model is grayed out, navigate to the Workspace setting. Open Power BI/General and turn on the Users can edit data models in the Power BI service (preview) setting.
Select ESG_Measures from the Data side panel, and then select New Measure to create a measure.
Update the measure name and then add the compute logic in form of Data Analysis Expressions (DAX) queries. To learn more about Power BI measures, Create measures for data analysis in Power BI Desktop in the Power BI documentation.

Create a metric definition
You can create the metric definition by using the create_metric_definition() prebuilt utility function. For more information about this function, go to create_metric_definition.
In the function parameter, specify the metric properties as a JSON file. For example, you might want to compute facility wise water consumption for facilities in high and extremely high water risk areas. The prebuilt metric only provides over all water consumption for water risk areas, but it doesn't provide facility wise breakup. You can create a Total water consumption in areas at water risk facility wise custom metric definition with the following code snippet.
%run SDS_ESGM_SDS_UtilitiesForMetrics_INTB
metrics_manager = MetricsManager()
metrics_manager.create_metric_definition(
    {
            "metric_name": "Total water consumption in areas at water risk facility wise",
            "measure_name": "WaterConsumption",
            "dimensions": [
                "WaterUtilizationAggregate[ReportingPeriod]",
                "WaterUtilizationAggregate[UnitOfMeasureName]",
                "WaterUtilizationAggregate[PartyName]",
                "WaterUtilizationAggregate[PartyTypeName]"
            ],
            "filters": {
                "WaterUtilizationAggregate[isRolledUp]": [
                    "False"
                ],
                "WaterUtilizationAggregate[WaterRiskIndexName]": [
                    "Extremely High",
                    "High"
                ],
                "WaterUtilizationAggregate[UnitOfMeasureName]": [
                    "Cubic metres"
                ]
            },
            "sustainability_area": "Water and marine resources",
            "labels": {
                "Reporting standard": [
                    "CSRD"
                ],
                "Disclosure datapoint": [
                    "E3-4_02"
                ]
            }
        })
When the function successfully runs, the metric definition is added as a row in the MetricsDefinitions table in the ComputedESGMetrics_LH lakehouse.
Note
The metric name for each metric needs to be unique. If you create a custom metric with a name that matches the name of an existing metric in the MetricsDefinitions table, the function will error out.
In the metric definition JSON file, you can skip specifying the filter and label properties if you don't need them for your custom metric.
Generate and store metrics data
Use the same steps as specified for prebuilt metrics for generating and storing metrics data. Specify the custom metric name that you created in the previous step in the metric_names parameter.
Consume metrics data
When the custom metrics data is available in ComputedESGMetrics table, you can consume the data for these scenarios:
Visualize and analyze custom metrics data
You can visualize and analyze custom metrics data in the prebuilt Power BI dashboard using the steps in Visualize and analyze metrics data.
If the custom metric has additional dimensions apart from Reporting period and unit of measure name, the prebuilt dashboard can handle visualization for one other dimension as a slicer and two other dimensions as a multiline filter.

You can specify the metric table’s dimensions to be considered for slicer and multi-line filter in the translate_metrics_output_for_report_config.json file.
For example, you create Disaggregation of GHG emissions – by country as a custom metric with these columns:
- Value
- Country
- Scope
- Accounting method
- Reporting period
- Unit of measure name
To visualize this metric on the prebuilt dashboard, you can specify the data in the configuration as follows:
{
         "metric_name": "Disaggregation of GHG emissions - by country",
         "dimensions_for_multiple_lines": [
             "Scope",
             "AccountingMethod"
         ],
         "dimension_for_slicer": "CountryOrRegion"
}
This snippet adds the CountryOrRegion dimension as a slicer on the dashboard. The Scope and AccountingMethod dimensions are concatenated with an underscore (_) and then added as basic filter (or multi line filter) on the dashboard.
After the configuration updates, you you can run the same steps as specified here for visualizing data of prebuilt metrics. TranslateOutputOfMetricsForReport_INTB notebook.
Refresh the DatasetForMetricsDashboard_DTST semantic model.
Open the DashboardForMetrics_RPT item. You should find the custom metric in one of the four tabs, based on the sustainability area mapped to the metric.
Note
If the sustainability area is specified as a value other than Climate Change, Social, Governance, Water and marine resources, or Resource use and circular economy, you need to customize the prebuilt Power BI report.
Publish metrics data for auditing metrics data in Compliance manager
For the custom metric, update the translate_metrics_output_for_CM_config.json by adding an object for the custom metric with these details:
metricName: Name of the metric.
metricExtractDataPath: Name of the metric folder to create in the ReportingData/year folder in the ComputedESGMetrics_LH lakehouse, containing the translated JSON file for the metric.
Note
Special characters or spaces aren't supported in metricExtractDataPath.
disclosureRequirements: Name of the disclosure requirement (improvement action) in the CSRD template Compliance Manager. Compliance Manager can read this value and map metric data to the right improvement action in the Compliance Manager CSRD assessment.
Columns: Column display name for each of the metric columns, which shows user friendly column names for metrics data in downstream applications.
When the configuration updates, run the TranslateOutputOfMetricsForCM_INTB notebook with these parameters:
metric_names: Name of the custom metric generated.
reporting_period: Reporting year for the metric data.
num_previous_years: Number of comparative years data that needs to be sent along with reporting_period data.
After the notebook runs, the metric data as JSON files is available in the ReportingData folder of the files section in ComputedESGMetrics.json. You can now ingest the published metric data in Compliance Manager using the Sustainability data connector.
