Generate and store metrics data
Important
Some or all of this functionality is available as part of a preview release. The content and the functionality are subject to change.
After the aggregate table generates, you can run the computation logic (aggregation or calculation) defined in the metric definition on top of the aggregate table dataset to generate the metric output data.
The computation logic of a metric is defined with:
Power BI measures: Contains computation logic in form of Data Analysis Expressions (DAX) formula language. Power BI measures are defined in the DatasetForMetricsMeasures_DTST prebuilt semantic model deployed as part of the capability. To learn more about Power BI measures, go to Create measures for data analysis in Power BI Desktop in the Power BI documentation.
Dimensions: Specifies the dimensions/columns required in the metric output. These dimensions can be from aggregate tables or the calculated tables in the DatasetForMetricsMeasures_DTST semantic model.
Filters: Specifies the values from the aggregate table dimensions that need to be filtered.
a sample prebuilt metric Scope 3 category wise emissions (GHG protocol).
Following is the metric definition of this metric from the metrics_definitions_config.json file:
{
      "metric_name": "Scope 3 GHG emissions by category (GHG Protocol)",
      "measure_name": "Emissions",
      "dimensions": [
        "EmissionsAggregate[EmissionSource]",
        "EmissionsAggregate[UnitOfMeasureName]",
        "EmissionsAggregate[ReportingPeriod]"
      ],
      "filters": {
        "EmissionsAggregate[isRolledUp]": [
          "False"
        ],
        "EmissionsAggregate[Scope]": [
          "Scope 3"
        ],
        "EmissionsAggregate[AccountingMethod]": [
          "Location based",
          null
        ],
        "EmissionsAggregate[UnitOfMeasureName]": [
          "mtCO2e"
        ]
      },
      "sustainability_area": "Climate Change",
      "labels": {
        "Reporting standard": [
          "CSRD"
        ],
        "Disclosure datapoint": [
          "E1-6_04"
        ]
      }
    }
Based on the metric definition, the metric output consists of:
- The columns specified as dimensions in the metric definition
- The value column that is computed by running the computation logic specified in the metric definition
For the sample metric, these output columns are:
- EmissionSource: Captures the scope 3 category name.
- Unit of measure name: Mentions the unit of measure of the emission value, such as mtCO2e.
- Reporting period: Specifies the reporting year.
- Value: Captures the emission value for a scope 3 category for a specific reporting period.
For this metric, you need to calculate the sum of the CO2eEmissionsUnits where Scope is Scope 3 and AccountingMethod is null or Location based at Emission source and Reporting period from the EmissionsAggregate table.
This calculation is performed as follows by the computation logic specified in the metric definition:
The Emissions measure performs the sum of CO2eEmissions from the EmissionsAggregate table and is defined in the DatasetForMetricsMeasures_DTST semantic model:
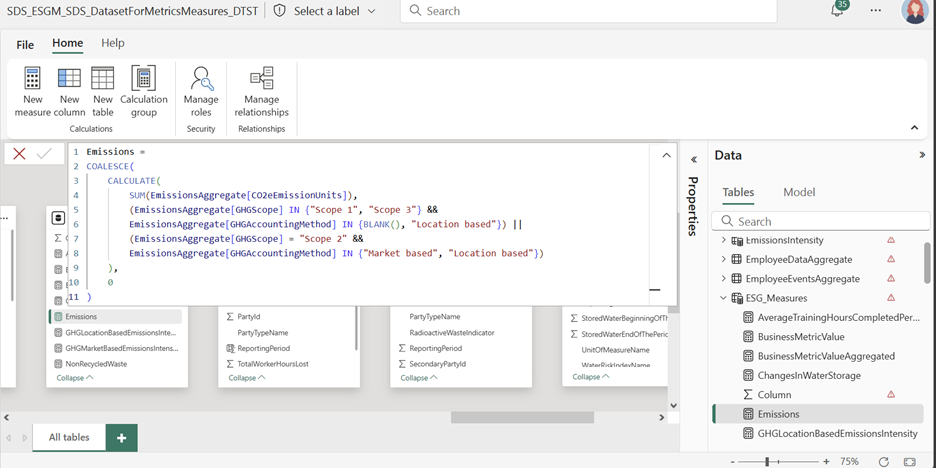
To view the prebuilt Power BI measures that are used to compute prebuilt metrics, following these steps:
- Open DatasetForMetricsMeasures_DTST from the workspace.
- Select Open data model.
- Select ESG_measures from the Data side panel.
If Open data model is greyed out, then navigate to Workspace setting. Open Power BI/General and turn on the Users can edit data models in the Power BI service (preview) setting.
The Dimensions measure performs the aggregation at the dimensions specified in the metric definition (reporting period), emission source, and unit of measure columns of the aggregate table. These columns form the dimensions of the metric output.
Filters specifies the required values for different columns of the EmissionsAggregate table to sum by the measure. In this example, rows where scope is scope 3, accounting method is null or location based, and unit of measure is mtCO2e.

To compute the metrics data with Power BI measures, dimensions, and filters, the prebuilt notebook uses the evaluate_measure function of the Python interface of semantic link's Python library, SemPy.
Prerequisites for generating metrics data
- The aggregate table required for generating the metric should already be present in the ComputedESGMetrics_LH lakehouse.
- Before you run the computation logic for a metric, ensure the metric definitions are loaded as tables in the ComputedESGMetrics lakehouse. Unless you update the metric definition, you don't need to reload the definitions. Run the Load metric definition notebook directly, or run the Load metric definition activity of the ExecuteComputationForMetrics pipeline.
Generate and store the metrics data
Run the Generate output for metrics activity in the ExecuteComputationOfMetrics_DTPL pipeline or directly run the GenerateOutputForMetrics_INTB notebook to run metric computation logic on the aggregate table dataset and to store the output data in the ComputedESGMetrics table in the ComputedESGMetrics_LH lakehouse.
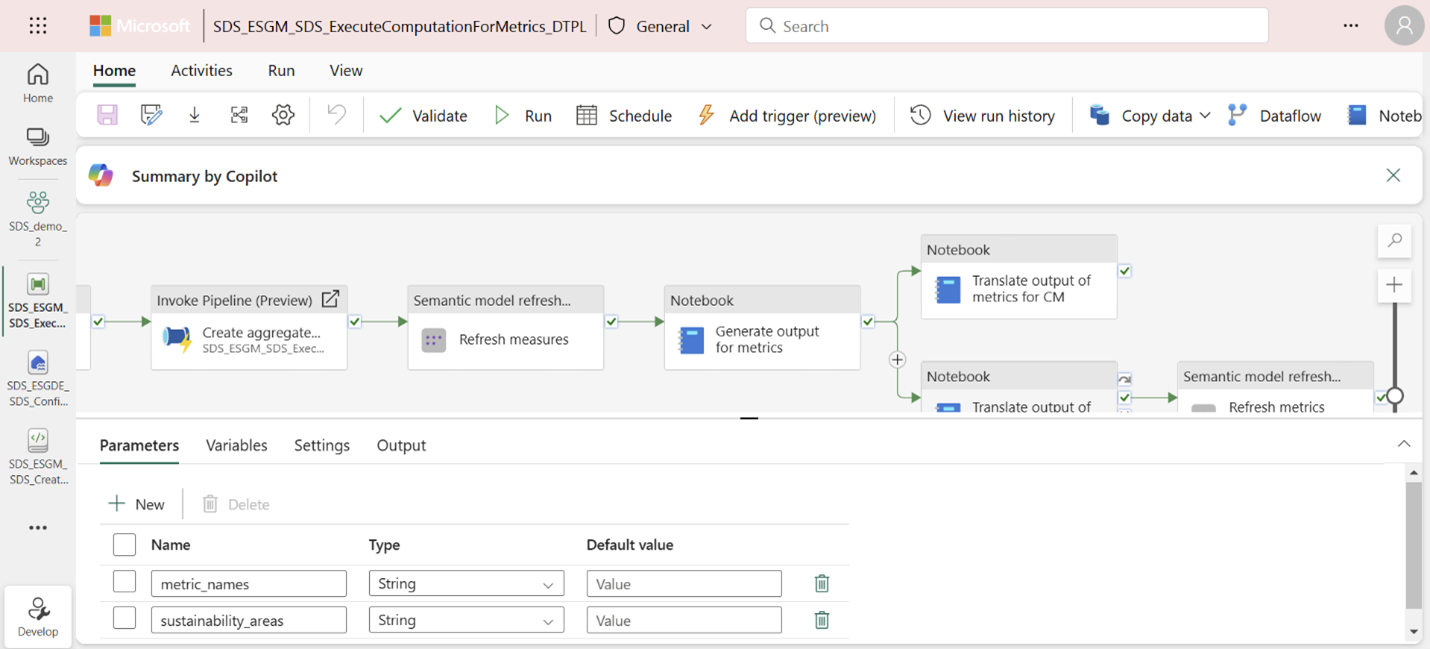
You can specify these parameters to generate outputs for a specific set of metrics. If you want to generate output for all the metric definitions loaded in the MetricsDefinitions table, then don't specify a parameter value in the pipeline and do set it as None in the notebook.
Note
The parameter values are case-sensitive.
metric_names: Specify a list of metric names. You can get the metrics name from Prebuilt metrics library or query the MetricsDefinitions table in the ComputedESGMetrics_LH lakehouse. For example, ["Scope 3 GHG emissions by category (GHG Protocol)","Total water consumption"].
sustainability_areas: Specify a list of sustainability areas. For example, ["Climate Change","Water and marine resources"]. All metrics mapped to the sustainability area specified in the parameter are considered for computation. You can find the sustainability area that is mapped to the metric from the Prebuilt metrics library or query the MetricsDefinitions table in the ComputedESGMetrics_LH lakehouse.
Note
If you specify both sustainability_areas and metric_names, then the metric_names parameter takes priority and is considered for computation.
After the notebook or the pipeline activity runs successfully, you can check the metric outputs in the ComputedESGMetrics table in the ComputedESGMetrics_LH lakehouse. ComputedESGMetrics is a single table that stores the output for all the metrics. This table shows the schema details for the table.
Column name Description MetricId The unique identifier of the metric. Denotes the metric for which data is generated. It's a foreign key to the MetricsDefinitions table. ReportingPeriod Denotes the reporting period (year) for which the metric value is generated. UnitOfMeasureName Represents the unit of measure for the metric value (such as mtCO2e for emission values). Value Denotes the metric’s value for the specific ReportingPeriod and DimensionValue. DimensionName If the metric output has another dimension apart from ReportingPeriod, this dimension name is specified in the DimensionName column. The corresponding value is in DimensionValue, and the data type is in DimensionType. DimensionValue Contains the specific value for the dimension specified in the DimensionName column. DimensionType Specifies the data type of the dimension in DimensionName. Index Index and MetricId uniquely identify a particular row of a metric. This column is helpful when retrieving a specific metric output with dimensions as separate columns from this single metric output table. If you want to store each metric’s data as a separate dataframe or table, you can use the get_metric_output_by_id function to get the metric output data frame.

