チュートリアル: R を使用してアボカドの価格を予測します
このチュートリアルでは、Microsoft Fabric の Synapse Data Science ワークフローのエンド ツー エンドの例について説明します。 これは、R を使用して、米国のアボカド価格を分析して視覚化し、将来のアボカド価格を予測する機械学習モデルを構築します。
このチュートリアルに含まれる手順は次のとおりです:
- 既定のライブラリを読み込みます
- データを読み込む
- データをカスタマイズする
- セッションに新しいパッケージを追加します
- データを分析および視覚化する
- モデルのトレーニング

前提条件
Microsoft Fabric サブスクリプションを取得します。 または、無料の Microsoft Fabric 試用版にサインアップします。
Microsoft Fabric にサインインします。
ホーム ページの左側の下にあるエクスペリエンス スイッチャーを使用して、Fabric に切り替えます。
![[エクスペリエンス スイッチャー メニュー] で Data Science を選択するところを示すスクリーンショット。](media/tutorial-data-science-prepare-system/switch-to-data-science.png)
ノートブックを開くか作成します。 方法については、「Microsoft Fabric ノートブックの使用方法」をご覧ください。
言語オプションを [SparkR (R)] に設定することで、主要言語を変更します。
ノートブックをレイクハウスにアタッチします。 左側にある [追加] を選択して、既存のレイクハウスを追加するか、レイクハウスを作成します。
ライブラリを読み込む
既定の R ランタイムからライブラリを使用します:
library(tidyverse)
library(lubridate)
library(hms)
データを読み込む
インターネットからダウンロードした .CSV ファイルからアボカドの価格を読み取ります:
df <- read.csv('https://synapseaisolutionsa.blob.core.windows.net/public/AvocadoPrice/avocado.csv', header = TRUE)
head(df,5)
データを操作します。
まず、より馴染みの良い列の名前をつけます。
# To use lowercase
names(df) <- tolower(names(df))

# To use snake case
avocado <- df %>%
  rename("av_index" = "x",
         "average_price" = "averageprice",
         "total_volume" = "total.volume",
         "total_bags" = "total.bags",
         "amount_from_small_bags" = "small.bags",
         "amount_from_large_bags" = "large.bags",
         "amount_from_xlarge_bags" = "xlarge.bags")

# Rename codes
avocado2 <- avocado %>%
  rename("PLU4046" = "x4046",
         "PLU4225" = "x4225",
         "PLU4770" = "x4770")

head(avocado2,5)
データ型を変更し、不要な列を削除し、合計消費量を追加します:
# Convert data
avocado2$year = as.factor(avocado2$year)
avocado2$date = as.Date(avocado2$date)
avocado2$month  = factor(months(avocado2$date), levels = month.name)
avocado2$average_price =as.numeric(avocado2$average_price)
avocado2$PLU4046 = as.double(avocado2$PLU4046)
avocado2$PLU4225 = as.double(avocado2$PLU4225)
avocado2$PLU4770 = as.double(avocado2$PLU4770)
avocado2$amount_from_small_bags = as.numeric(avocado2$amount_from_small_bags)
avocado2$amount_from_large_bags = as.numeric(avocado2$amount_from_large_bags)
avocado2$amount_from_xlarge_bags = as.numeric(avocado2$amount_from_xlarge_bags)


# Remove unwanted columns
avocado2 <- avocado2 %>%
  select(-av_index,-total_volume, -total_bags)

# Calculate total consumption
avocado2 <- avocado2 %>%
  mutate(total_consumption = PLU4046 + PLU4225 + PLU4770 + amount_from_small_bags + amount_from_large_bags + amount_from_xlarge_bags)
新しいパッケージのインストール
インライン パッケージ インストールを使用して、セッションに新しいパッケージを追加します:
install.packages(c("repr","gridExtra","fpp2"))
必要なライブラリを読み込みます。
library(tidyverse)
library(knitr)
library(repr)
library(gridExtra)
library(data.table)
データを分析および視覚化する
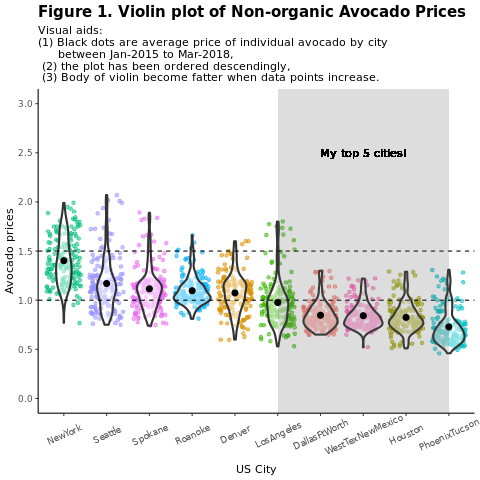
地域別に従来の (非有機の) アボカド価格を比較します:
options(repr.plot.width = 10, repr.plot.height =10)
# filter(mydata, gear %in% c(4,5))
avocado2 %>%
  filter(region %in% c("PhoenixTucson","Houston","WestTexNewMexico","DallasFtWorth","LosAngeles","Denver","Roanoke","Seattle","Spokane","NewYork")) %>%
  filter(type == "conventional") %>%
  select(date, region, average_price) %>%
  ggplot(aes(x = reorder(region, -average_price, na.rm = T), y = average_price)) +
  geom_jitter(aes(colour = region, alpha = 0.5)) +
  geom_violin(outlier.shape = NA, alpha = 0.5, size = 1) +
  geom_hline(yintercept = 1.5, linetype = 2) +
  geom_hline(yintercept = 1, linetype = 2) +
  annotate("rect", xmin = "LosAngeles", xmax = "PhoenixTucson", ymin = -Inf, ymax = Inf, alpha = 0.2) +
  geom_text(x = "WestTexNewMexico", y = 2.5, label = "My top 5 cities!", hjust = 0.5) +
  stat_summary(fun = "mean") +
  labs(x = "US city",
       y = "Avocado prices",
       title = "Figure 1. Violin plot of nonorganic avocado prices",
       subtitle = "Visual aids: \n(1) Black dots are average prices of individual avocados by city \n     between January 2015 and March 2018. \n(2) The plot is ordered descendingly.\n(3) The body of the violin becomes fatter when data points increase.") +
  theme_classic() +
  theme(legend.position = "none",
        axis.text.x = element_text(angle = 25, vjust = 0.65),
        plot.title = element_text(face = "bold", size = 15)) +
  scale_y_continuous(lim = c(0, 3), breaks = seq(0, 3, 0.5))

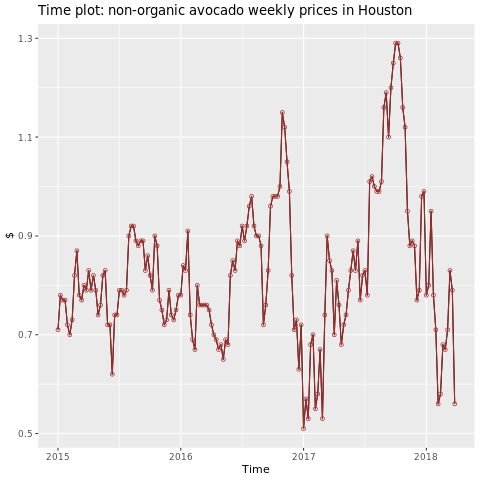
ヒューストン地域に焦点を当てます。
library(fpp2)
conv_houston <- avocado2 %>%
  filter(region == "Houston",
         type == "conventional") %>%
  group_by(date) %>%
  summarise(average_price = mean(average_price))

# Set up ts

conv_houston_ts <- ts(conv_houston$average_price,
                 start = c(2015, 1),
                 frequency = 52)
# Plot

autoplot(conv_houston_ts) +
  labs(title = "Time plot: nonorganic avocado weekly prices in Houston",
       y = "$") +
  geom_point(colour = "brown", shape = 21) +
  geom_path(colour = "brown")

機械学習モデルのトレーニング
自己回帰和分移動平均 (ARIMA) に基づいて、ヒューストン地域の価格予測モデルを構築します:
conv_houston_ts_arima <- auto.arima(conv_houston_ts,
                                    d = 1,
                                    approximation = F,
                                    stepwise = F,
                                    trace = T)
checkresiduals(conv_houston_ts_arima)

ヒューストン ARIMA モデルからの予測のグラフを表示します:
conv_houston_ts_arima_fc <- forecast(conv_houston_ts_arima, h = 208)

autoplot(conv_houston_ts_arima_fc) + labs(subtitle = "Prediction of weekly prices of nonorganic avocados in Houston",
       y = "$") +
  geom_hline(yintercept = 2.5, linetype = 2, colour = "blue")
