iOS SDK でマップに多角形浮き出しレイヤーを追加する (プレビュー)
この記事では、多角形浮き出しレイヤーを使用して、フィーチャー ジオメトリ Polygon および MultiPolygon の領域が浮き出るようにレンダリングする方法を紹介します。
Note
Azure Maps iOS SDK の廃止
iOS 用 Azure Maps Native SDK は非推奨となり、2025 年 3 月 31 日に廃止されます。 サービスの中断を回避するには、2025 年 3 月 31 日までに Azure Maps Web SDK に移行します。 詳細については、「Azure Maps iOS SDK 移行ガイド」を参照してください。
多角形浮き出しレイヤーを使用する
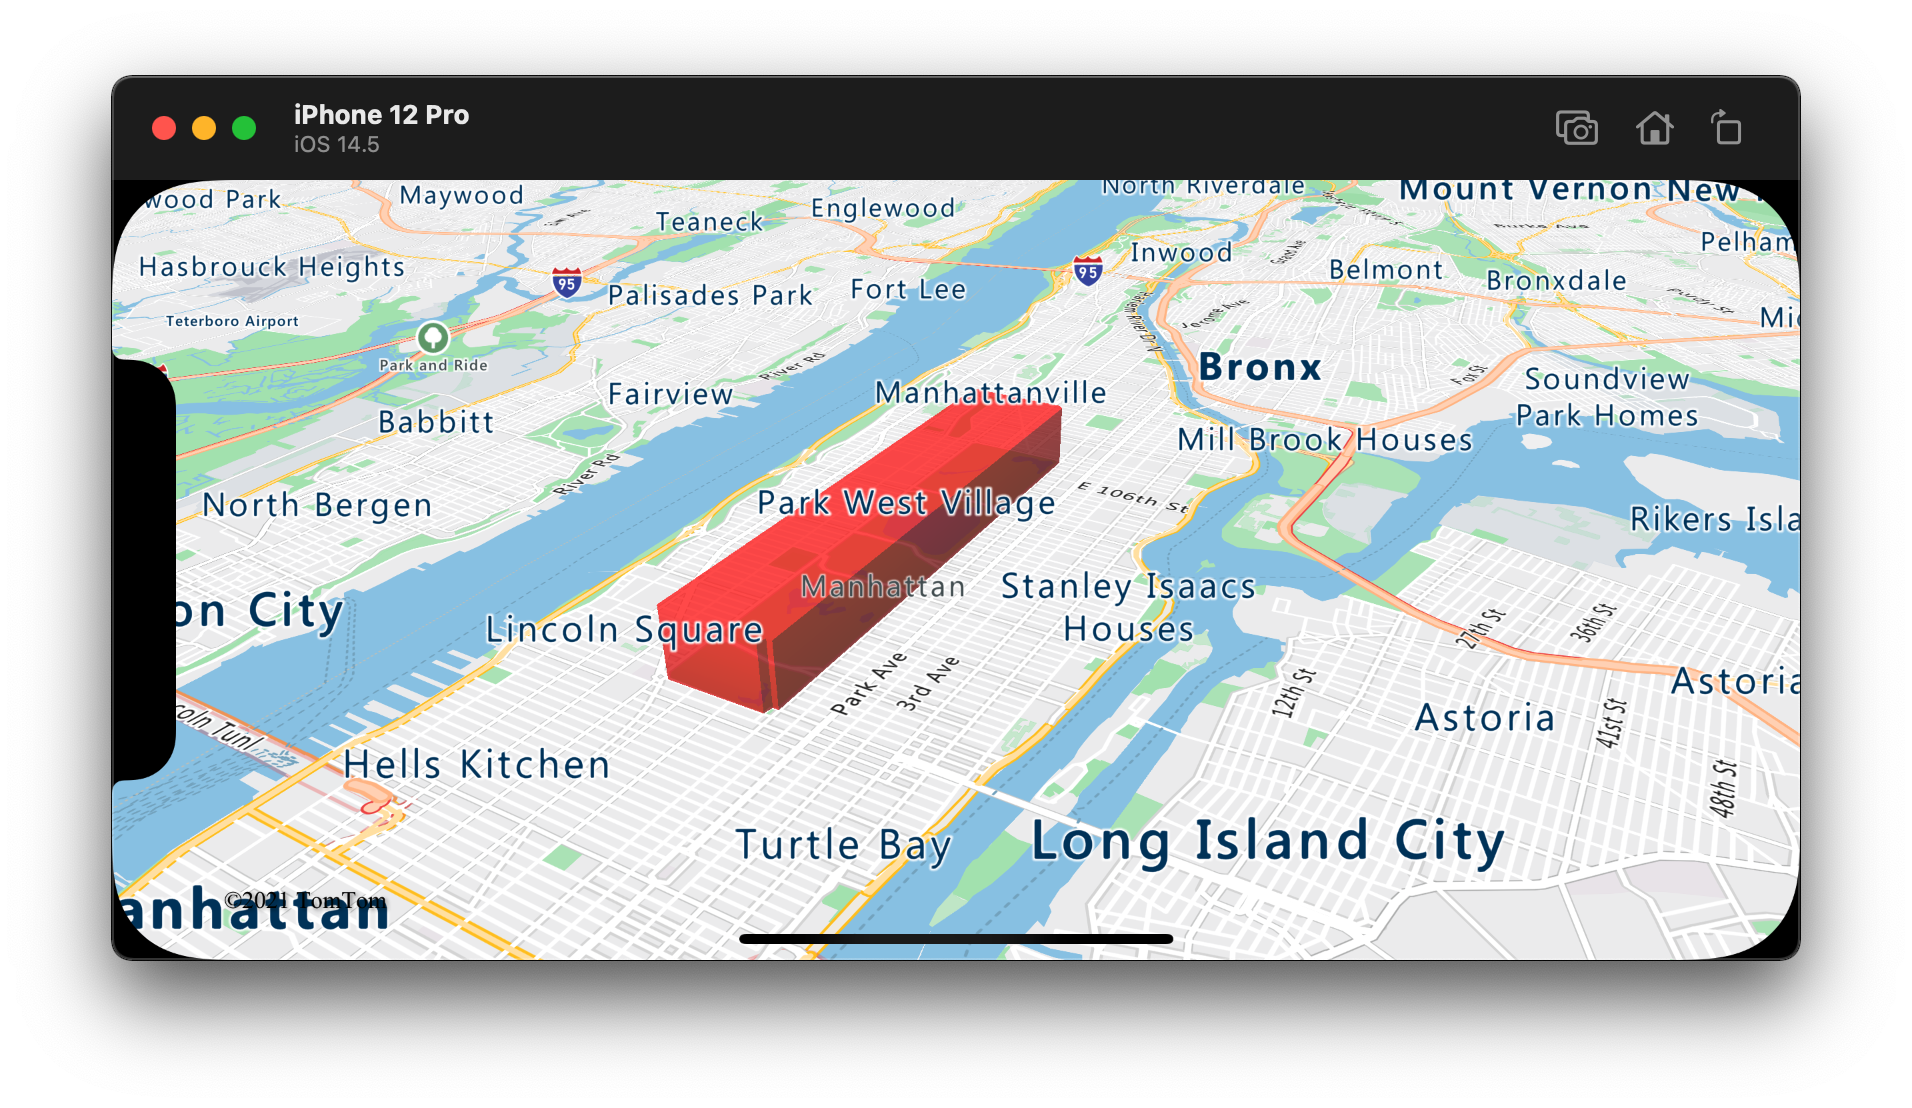
多角形浮き出しレイヤーをデータ ソースに接続します。 その後、マップに読み込まれます。 多角形浮き出しレイヤーでは、Polygon および MultiPolygon のフィーチャーの領域が浮き出るようにレンダリングされます。 多角形浮き出しレイヤーの height と base のプロパティにより、地面からの基本距離と浮き出し形状の高さがメートルで定義されます。 次のコードでは、多角形を作成してそれをデータ ソースに追加し、PolygonExtrusionLayer クラスを利用してレンダリングする方法を確認できます。
// Create a data source and add it to the map.
let source = DataSource()
map.sources.add(source)

// Create a rectangular polygon.
source.add(geometry: Polygon([
    CLLocationCoordinate2D(latitude: 40.800279, longitude: -73.958383),
    CLLocationCoordinate2D(latitude: 40.768459, longitude: -73.981547),
    CLLocationCoordinate2D(latitude: 40.767761, longitude: -73.981246),
    CLLocationCoordinate2D(latitude: 40.764616, longitude: -73.973618),
    CLLocationCoordinate2D(latitude: 40.765128, longitude: -73.973060),
    CLLocationCoordinate2D(latitude: 40.764908, longitude: -73.972599),
    CLLocationCoordinate2D(latitude: 40.796584, longitude: -73.949446),
    CLLocationCoordinate2D(latitude: 40.797088, longitude: -73.949661),
    CLLocationCoordinate2D(latitude: 40.800523, longitude: -73.957815),
    CLLocationCoordinate2D(latitude: 40.800279, longitude: -73.958383)
]))

// Create and add a polygon extrusion layer to the map below the labels so that they are still readable.
map.layers.insertLayer(
    PolygonExtrusionLayer(source: source, options: [
        .fillColor(.red),
        .fillOpacity(0.7),
        .height(500)
    ]),
    below: "labels"
)
次のスクリーンショットは、上記のコードによって、多角形浮き出しレイヤーを使用して垂直方向に拡大される多角形がレンダリングされている状態を示しています。
データ ドリブン ポリゴンを追加する
階級区分図は、多角形浮き出しレイヤーを使用してレンダリングできます。 浮き出しレイヤーの height および fillColor プロパティを、Polygon および MultiPolygon フィーチャー ジオメトリの統計変数の測定値に設定します。 次のコード サンプルは、州別の人口密度測定値を基準とする、米国の浮き出し階級区分図を示します。
// Create a data source and add it to the map.
let source = DataSource()

// Import the geojson data and add it to the data source.
source.importData(fromURL: Bundle.main.url(forResource: "US_States_Population_Density", withExtension: "json")!)

map.sources.add(source)

// Create and add a polygon extrusion layer to the map below the labels so that they are still readable.
let densityColorSteps: [Int: UIColor] = [
    0: UIColor(red: 0, green: 1, blue: 0.5, alpha: 1),
    10: UIColor(red: 9 / 255, green: 224 / 255, blue: 118 / 255, alpha: 1),
    20: UIColor(red: 11 / 255, green: 191 / 255, blue: 103 / 255, alpha: 1),
    50: UIColor(red: 247 / 255, green: 227 / 255, blue: 5 / 255, alpha: 1),
    100: UIColor(red: 247 / 255, green: 199 / 255, blue: 7 / 255, alpha: 1),
    200: UIColor(red: 247 / 255, green: 130 / 255, blue: 5 / 255, alpha: 1),
    500: UIColor(red: 247 / 255, green: 94 / 255, blue: 5 / 255, alpha: 1),
    1000: UIColor(red: 247 / 255, green: 37 / 255, blue: 5 / 255, alpha: 1)
]
let colorExpression = NSExpression(
    forAZMStepping: NSExpression(forKeyPath: "density"),
    from: NSExpression(forConstantValue: UIColor(red: 0, green: 1, blue: 0.5, alpha: 1)),
    stops: NSExpression(forConstantValue: densityColorSteps)
)

let densityHeightSteps: [Int: Int] = [
    0: 100,
    1200: 960_000
]
let heightExpression = NSExpression(
    forAZMInterpolating: NSExpression(forKeyPath: "density"),
    curveType: .linear,
    parameters: nil,
    stops: NSExpression(forConstantValue: densityHeightSteps)
)

map.layers.insertLayer(
    PolygonExtrusionLayer(source: source, options: [
        .fillOpacity(0.7),
        .fillColor(from: colorExpression),
        .height(from: heightExpression)
    ]),
    below: "labels"
)
次のスクリーンショットは、人口密度に基づいた、浮き出し多角形として色付けされ、垂直方向に拡大された米国の州の階級区分図を示しています。

関連情報
マップに追加できる他のコード サンプルについては、次の記事をご覧ください。