Tools to troubleshoot memory issues
Note
The Basic, Standard, and Enterprise plans will be deprecated starting from mid-March, 2025, with a 3 year retirement period. We recommend transitioning to Azure Container Apps. For more information, see the Azure Spring Apps retirement announcement.
The Standard consumption and dedicated plan will be deprecated starting September 30, 2024, with a complete shutdown after six months. We recommend transitioning to Azure Container Apps. For more information, see Migrate Azure Spring Apps Standard consumption and dedicated plan to Azure Container Apps.
This article applies to: ✅ Basic/Standard ✅ Enterprise
This article describes various tools that are useful for troubleshooting Java memory issues. You can use these tools in many scenarios not limited to memory issues, but this article focuses only on the topic of memory.
Alerts and diagnostics
The following sections describe resource health alerts and diagnostics available through the Azure portal.
Resource health
You can monitor app lifecycle events and set up alerts with Azure Activity log and Azure Service Health. For more information, see Monitor app lifecycle events using Azure Activity log and Azure Service Health.
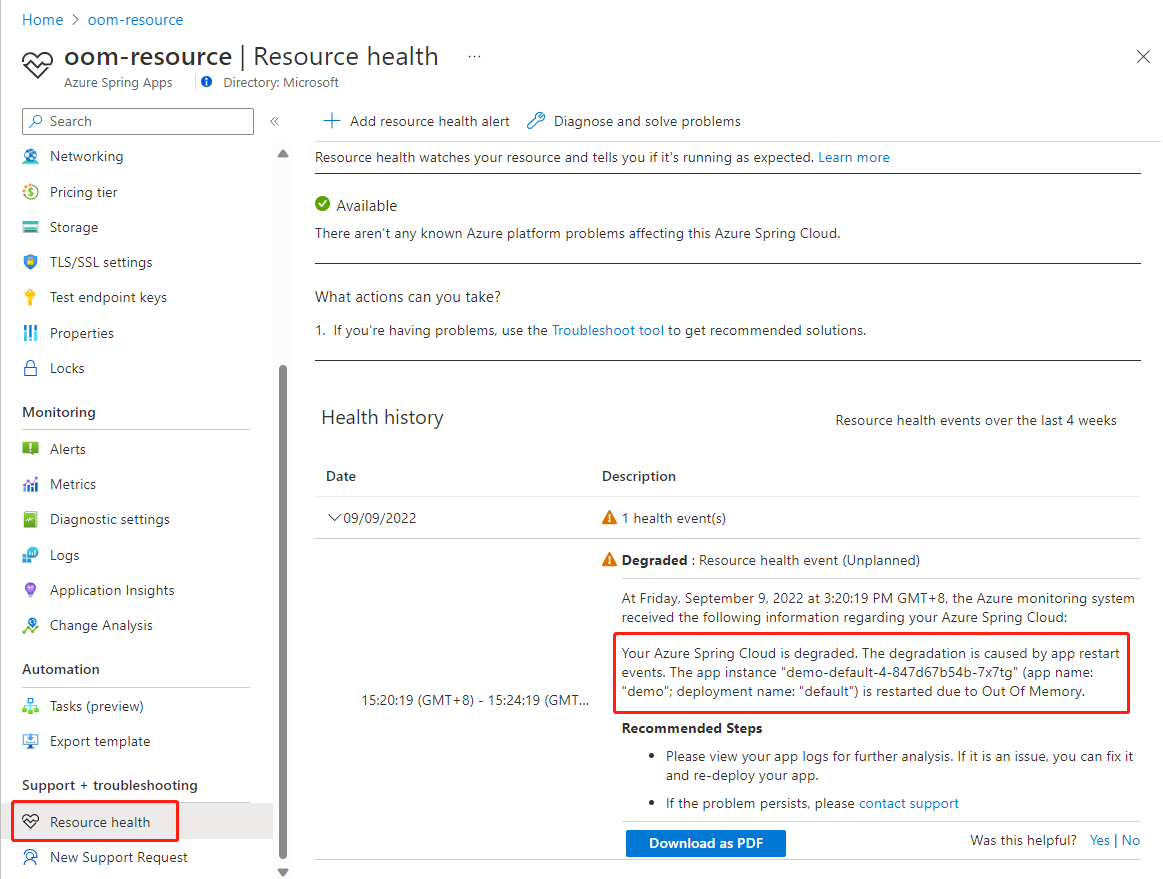
Resource health sends alerts about app restart events due to container out-of-memory (OOM) issues. For more information, see App restart issues caused by out-of-memory issues.
The following screenshot shows an app resource health alert indicating an OOM issue.
Diagnose and solve problems
Azure Spring Apps diagnostics is an interactive experience to troubleshoot your app without configuration. For more information, see Self-diagnose and solve problems in Azure Spring Apps.
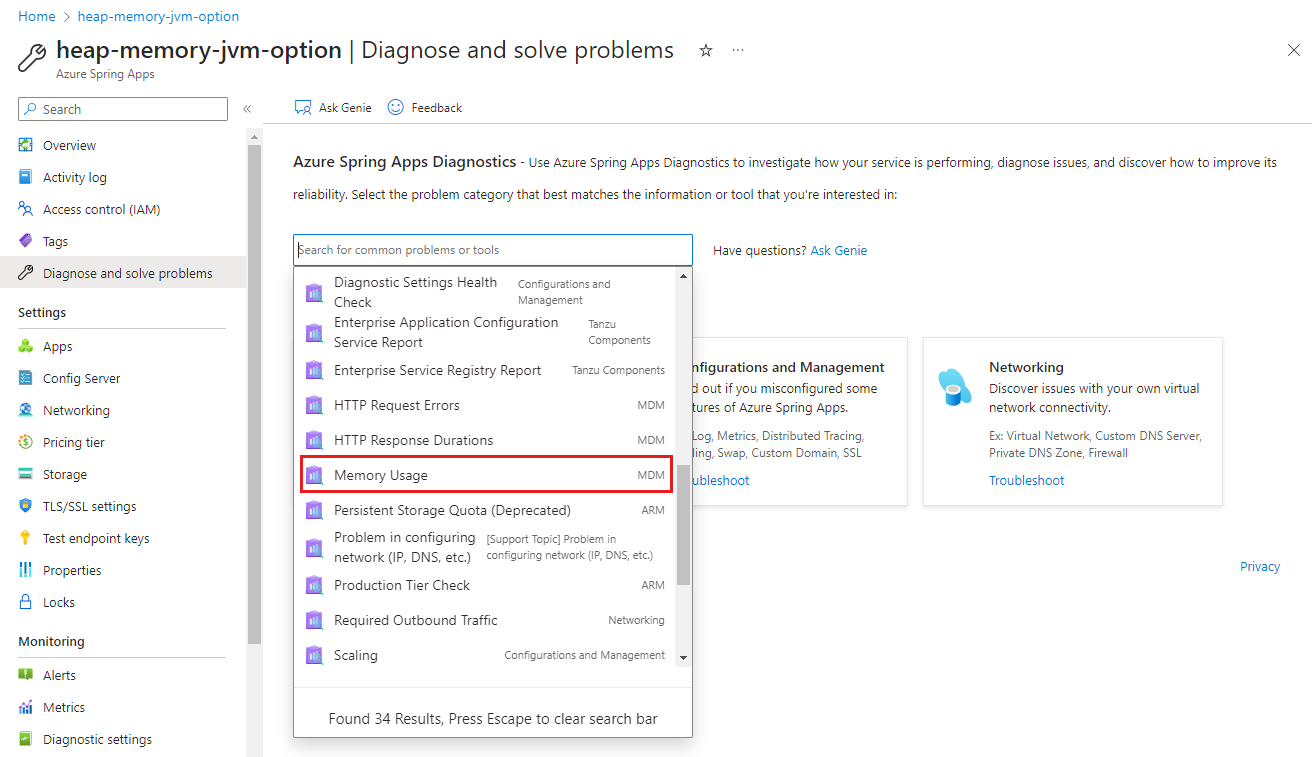
In the Azure portal, you can find Memory Usage under Diagnose and solve problems, as shown in the following screenshot.
Memory Usage provides a simple diagnosis for app memory usage, as shown in the following screenshot.
Metrics
The following sections describe metrics that cover issues including high memory usage, heap memory that's too large, and abnormal garbage collection abnormal (too frequent or not frequent enough). For more information, see Quickstart: Monitoring Azure Spring Apps apps with logs, metrics, and tracing.
App memory usage
App memory usage is a percentage equal to the app memory used divided by the app memory limit. This value shows the whole app memory.
jvm.memory.used/committed/max
For JVM memory, there are three metrics: jvm.memory.used, jvm.memory.committed, and jvm.memory.max, which are described in the following list.
"JVM memory" isn't a clearly defined concept. Here, jvm.memory is the sum of heap memory and former permGen part of non-heap memory. JVM memory doesn't include direct memory or other memory like the thread stack. Spring Boot Actuator gathers these three metrics and determines the scope of jvm.memory.
jvm.memory.usedis the amount of used JVM memory, including used heap memory and used former permGen in non-heap memory.jvm.memory.usedis a major reflection of the change of heap memory, because the former permGen part is usually stable.If you find
jvm.memory.usedtoo large, consider setting a smaller maximum heap memory size.jvm.memory.committedis the amount of memory committed for the JVM to use. The size ofjvm.memory.committedis basically the limit of usable JVM memory.jvm.memory.maxis the maximum amount of JVM memory, not to be confused with the real available amount.The value of
jvm.memory.maxcan sometimes be confusing because it can be much higher than the available app memory. To clarify,jvm.memory.maxis the sum of all maximum sizes of heap memory and the former permGen part of non-heap memory, regardless of the real available memory. For example, if an app is set with 1 GB of memory in the Azure Spring Apps portal, then the default heap memory size is 0.5 GB. For more information, see the Default maximum heap size section of Java memory management.If the default compressed class space size is 1 GB, then the value of
jvm.memory.maxis larger than 1.5 GB regardless of whether the app memory size 1 GB. For more information, see Java Platform, Standard Edition HotSpot Virtual Machine Garbage Collection Tuning Guide: Other Considerations in the Oracle documentation.
jvm.gc.memory.allocated/promoted
These two metrics are for observing Java garbage collection (GC). For more information, see the Java garbage collection section of Java memory management. The maximum heap size influences the frequency of minor GC and full GC. The maximum metaspace and maximum direct memory size influence full GC. If you want to adjust the frequency of garbage collection, consider modifying the following maximum memory sizes.
jvm.gc.memory.allocatedis the amount of increase in the size of the young generation memory pool after one GC and before the next. This value reflects minor GC.jvm.gc.memory.promotedis the amount of increase in the size of the old generation memory pool after GC. This value reflects full GC.
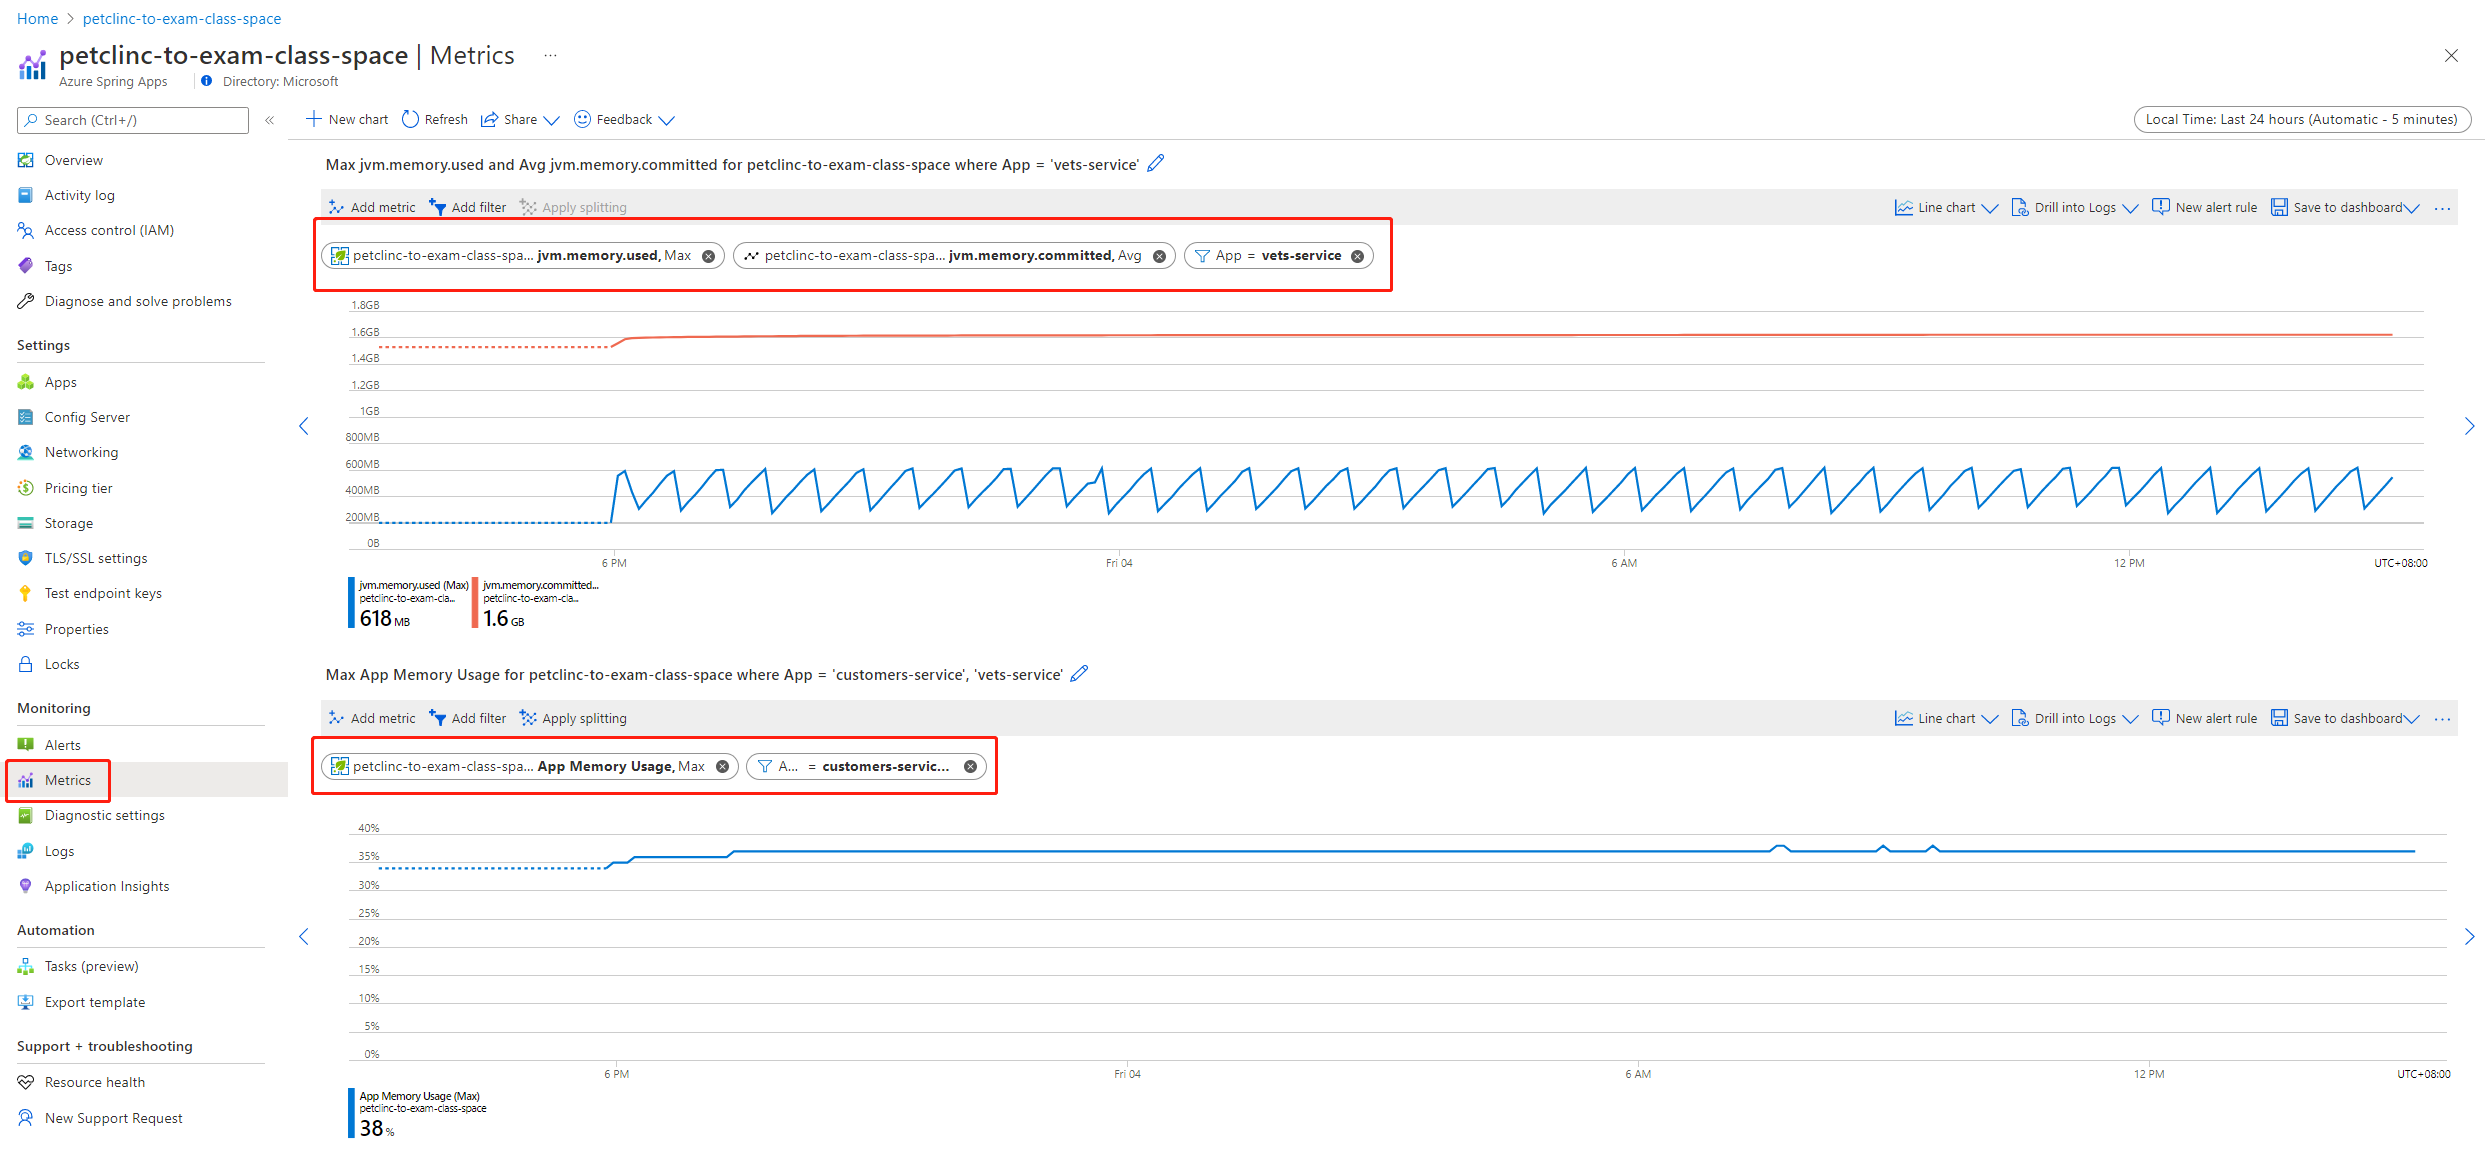
You can find this feature on the Azure portal, as shown in the following screenshot. You can choose specific metrics and add filters for a specific app, deployment, or instance. You can also apply splitting.
Further debugging
For further debugging, you can manually capture heap dumps and thread dumps, and use Java Flight Recorder (JFR). For more information, see Capture heap dump and thread dump manually and use Java Flight Recorder in Azure Spring Apps.
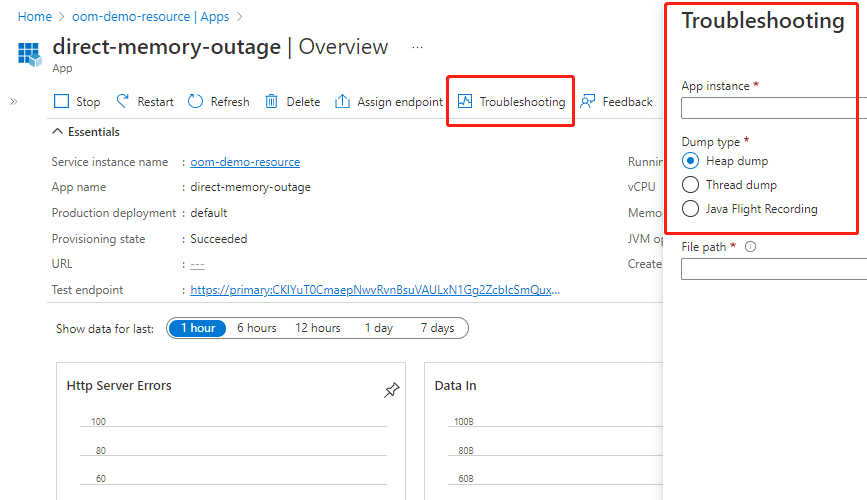
Heap dumps record the state of the Java heap memory. Thread dumps record the stacks of all live threads. These tools are available through the Azure CLI and on the app page of the Azure portal, as shown in the following screenshot.
For more information, see Capture heap dump and thread dump manually and use Java Flight Recorder in Azure Spring Apps. You can also use third party tools like Memory Analyzer to analyze heap dumps.
Modify configurations to fix problems
Some issues you might identify include container OOM, heap memory that's too large, and abnormal garbage collection. If you identify any of these issues, you may need to configure the maximum memory size in the JVM options. For more information, see the Important JVM options section of Java memory management.
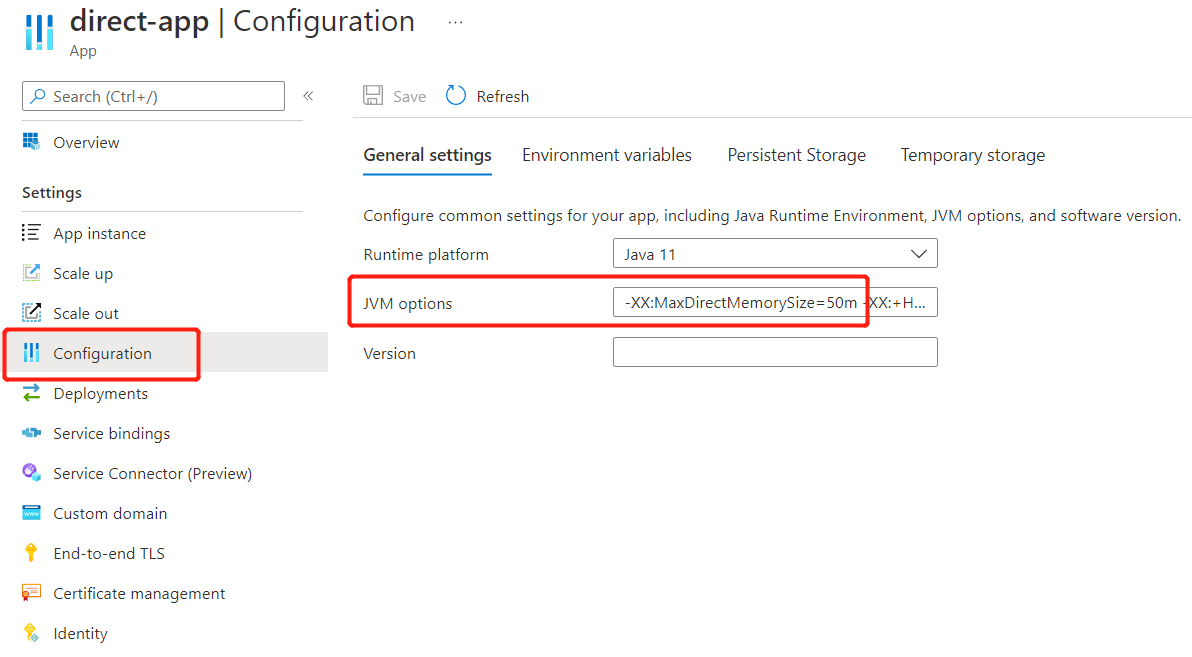
You can modify the JVM options by using the Azure portal or the Azure CLI.
In the Azure portal, navigate to your app, then select Configuration from the Settings section of the navigation menu. On the General Settings tab, update the JVM options field, as shown in the following screenshot:
