Capture heap dump and thread dump manually and use Java Flight Recorder in Azure Spring Apps
Note
The Basic, Standard, and Enterprise plans will be deprecated starting from mid-March, 2025, with a 3 year retirement period. We recommend transitioning to Azure Container Apps. For more information, see the Azure Spring Apps retirement announcement.
The Standard consumption and dedicated plan will be deprecated starting September 30, 2024, with a complete shutdown after six months. We recommend transitioning to Azure Container Apps. For more information, see Migrate Azure Spring Apps Standard consumption and dedicated plan to Azure Container Apps.
This article applies to: ✅ Basic/Standard ✅ Enterprise
This article describes how to manually generate a heap dump or thread dump, and how to start Java Flight Recorder (JFR).
Effective troubleshooting is critical to ensure you can fix issues in production environments and keep your business online. Azure Spring Apps provides application log streaming and query, rich metrics emitting, alerts, distributed tracing, and so forth. However, when you get alerts about requests with high latency, JVM heap leak, or high CPU usage, there's no last-mile solution. For this reason, we've enabled you to manually generate a heap dump, generate a thread dump, and start JFR.
Prerequisites
- A deployed Azure Spring Apps service instance. To get started, see Quickstart: Deploy your first application to Azure Spring Apps.
- At least one application already created in your service instance.
- Your own persistent storage as described in How to enable your own persistent storage in Azure Spring Apps. This storage is used to save generated diagnostic files. The paths you provide in the parameter values below should be under the mount path of the persistent storage bound to your app. If you want to use a path under the mount path, be sure to create the subpath beforehand.
Generate a heap dump
Use the following command to generate a heap dump of your app in Azure Spring Apps.
az spring app deployment generate-heap-dump \
    --resource-group <resource-group-name> \
    --service <Azure-Spring-Apps-instance-name> \
    --app <app-name> \
    --deployment <deployment-name> \
    --app-instance <app-instance name> \
    --file-path <your-target-file-path-in-your-persistent-storage-mount-path>
Generate a thread dump
Use the following command to generate a thread dump of your app in Azure Spring Apps.
az spring app deployment generate-thread-dump \
    --resource-group <resource-group-name> \
    --service <Azure-Spring-Apps-instance-name> \
    --app <app-name> \
    --deployment <deployment-name> \
    --app-instance <app-instance name> \
    --file-path <your-target-file-path-in-your-persistent-storage-mount-path>
Start JFR
Use the following command to start JFR for your app in Azure Spring Apps.
az spring app deployment start-jfr \
    --resource-group <resource-group-name> \
    --service <Azure-Spring-Apps-instance-name> \
    --app <app-name> \
    --deployment <deployment-name> \
    --app-instance <app-instance name> \
    --file-path <your-target-file-path-in-your-persistent-storage-mount-path> \
    --duration <duration-of-JFR>
The default value for duration is 60 seconds.
Generate a dump using the Azure portal
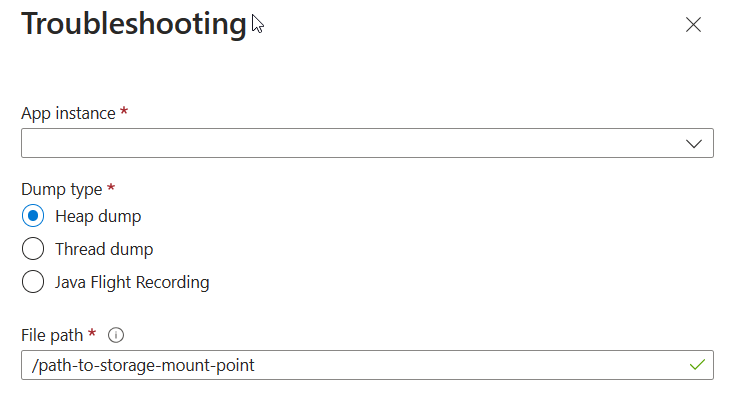
Use the following steps to generate a heap or thread dump of your app in Azure Spring Apps.
In the Azure portal, navigate to your target app, then select Troubleshooting.
In the Troubleshooting pane, select the app instance and the type of dump you'd like to collect.
In the File path field, specify the mount path of your persistent storage.
Select Collect.
Get your diagnostic files
Navigate to the target file path in your persistent storage and find your dump/JFR. From there, you can download them to your local machine. The name of the generated file will be similar to <app-instance>_heapdump_<time-stamp>.hprof for the heap dump, <app-instance>_threaddump_<time-stamp>.txt for the thread dump, and <app-instance>_JFR_<time-stamp>.jfr for the JFR file.

