App restart issues caused by out-of-memory issues
Note
The Basic, Standard, and Enterprise plans will be deprecated starting from mid-March, 2025, with a 3 year retirement period. We recommend transitioning to Azure Container Apps. For more information, see the Azure Spring Apps retirement announcement.
The Standard consumption and dedicated plan will be deprecated starting September 30, 2024, with a complete shutdown after six months. We recommend transitioning to Azure Container Apps. For more information, see Migrate Azure Spring Apps Standard consumption and dedicated plan to Azure Container Apps.
This article applies to: ✅ Basic/Standard ✅ Enterprise
This article describes out-of-memory (OOM) issues for Java applications in Azure Spring Apps.
Types of out-of-memory issues
There are two types of out-of-memory issues: container OOM and JVM OOM.
Container OOM, also called system OOM, occurs when the available app memory has run out. Container OOM issue causes app restart events, which are reported in the Resource Health section of the Azure portal. Normally, container OOM is caused by incorrect memory size configurations.
JVM OOM occurs when the amount of used memory has reached the maximum size set in JVM options. JVM OOM won't cause an app to restart. Normally, JVM OOM is a result of bad code, which you can find by looking for
java.lang.OutOfMemoryErrorexceptions in the application log. JVM OOM has a negative effect on application and Java Profiling tools, such as Java Flight Recorder.
This article focuses on how to fix container OOM issues. To fix JVM OOM issues, check tools such as heap dump, thread dump, and Java Flight Recorder. For more information, see Capture heap dump and thread dump manually and use Java Flight Recorder in Azure Spring Apps.
Fix app restart issues due to OOM
The following sections describe the tools, metrics, and JVM options that you can use to diagnose and fix container OOM issues.
View alerts on the Resource health page
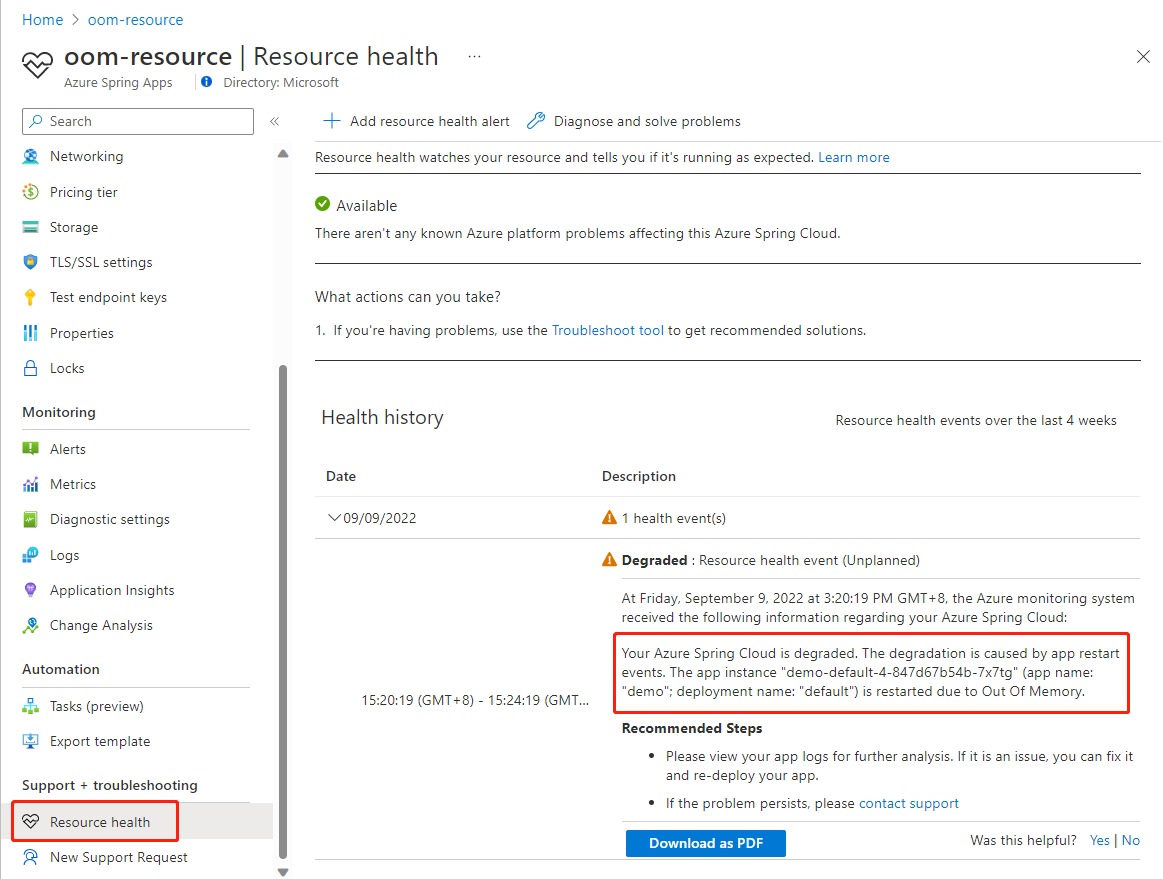
The Resource health page on the Azure portal shows app restart events due to container OOM, as shown in the following screenshot:
Configure memory size
The metrics App memory Usage, jvm.memory.used, and jvm.memory.committed provide a view of memory usage. For more information, see the Metrics section of Tools to troubleshoot memory issues. Configure the maximum memory sizes in JVM options to ensure that memory is under the limit.
The sum of the maximum memory sizes of all the parts in the Java memory model should be less than the real available app memory. To set your maximum memory sizes, see the typical memory layout described in the Memory usage layout section of Java memory management.
Find a balance when you set the maximum memory size. When you set the maximum memory size too high, there's a risk of container OOM. When you set the maximum memory size too low, there's a risk of JVM OOM, and garbage collection will be of and will slow down the app.
Control heap memory
You can set the maximum heap size by using the -Xms, -Xmx, -XX:InitialRAMPercentage, and -XX:MaxRAMPercentage JVM options.
You may need to adjust the maximum heap size settings when the value of jvm.memory.used is too high in the metrics. For more information, see the jvm.memory.used/committed/max section of Tools to troubleshoot memory issues.
Control direct memory
It's important to set the -XX:MaxDirectMemorySize JVM option for the following reasons:
- You may not notice when frameworks such as nio and gzip use direct memory.
- Garbage collection of direct memory is only handled during full garbage collection, and full garbage collection occurs only when the heap is near full.
Normally, you can set MaxDirectMemorySize to a value less than the app memory size minus the heap memory minus the non-heap memory.
Control metaspace
You can set the maximum metaspace size by setting the -XX:MaxMetaspaceSize JVM option. The -XX:MetaspaceSize option sets the threshold value to trigger full garbage collection.
Metaspace memory is usually stable.
