Azure Monitor Logs overview
Azure Monitor Logs is a centralized software as a service (SaaS) platform for collecting, analyzing, and acting on telemetry data generated by Azure and non-Azure resources and applications.
You can collect logs, manage log data and costs, and consume different types of data in one Log Analytics workspace, the primary Azure Monitor Logs resource. This means you never have to move data or manage other storage, and you can retain different data types for as long or as little as you need.
This article provides an overview of how Azure Monitor Logs works and explains how it addresses the needs and skills of different personas in an organization.
Note
Azure Monitor Logs is one half of the data platform that supports Azure Monitor. The other is Azure Monitor Metrics, which stores numeric data in a time-series database.
How Azure Monitor Logs works
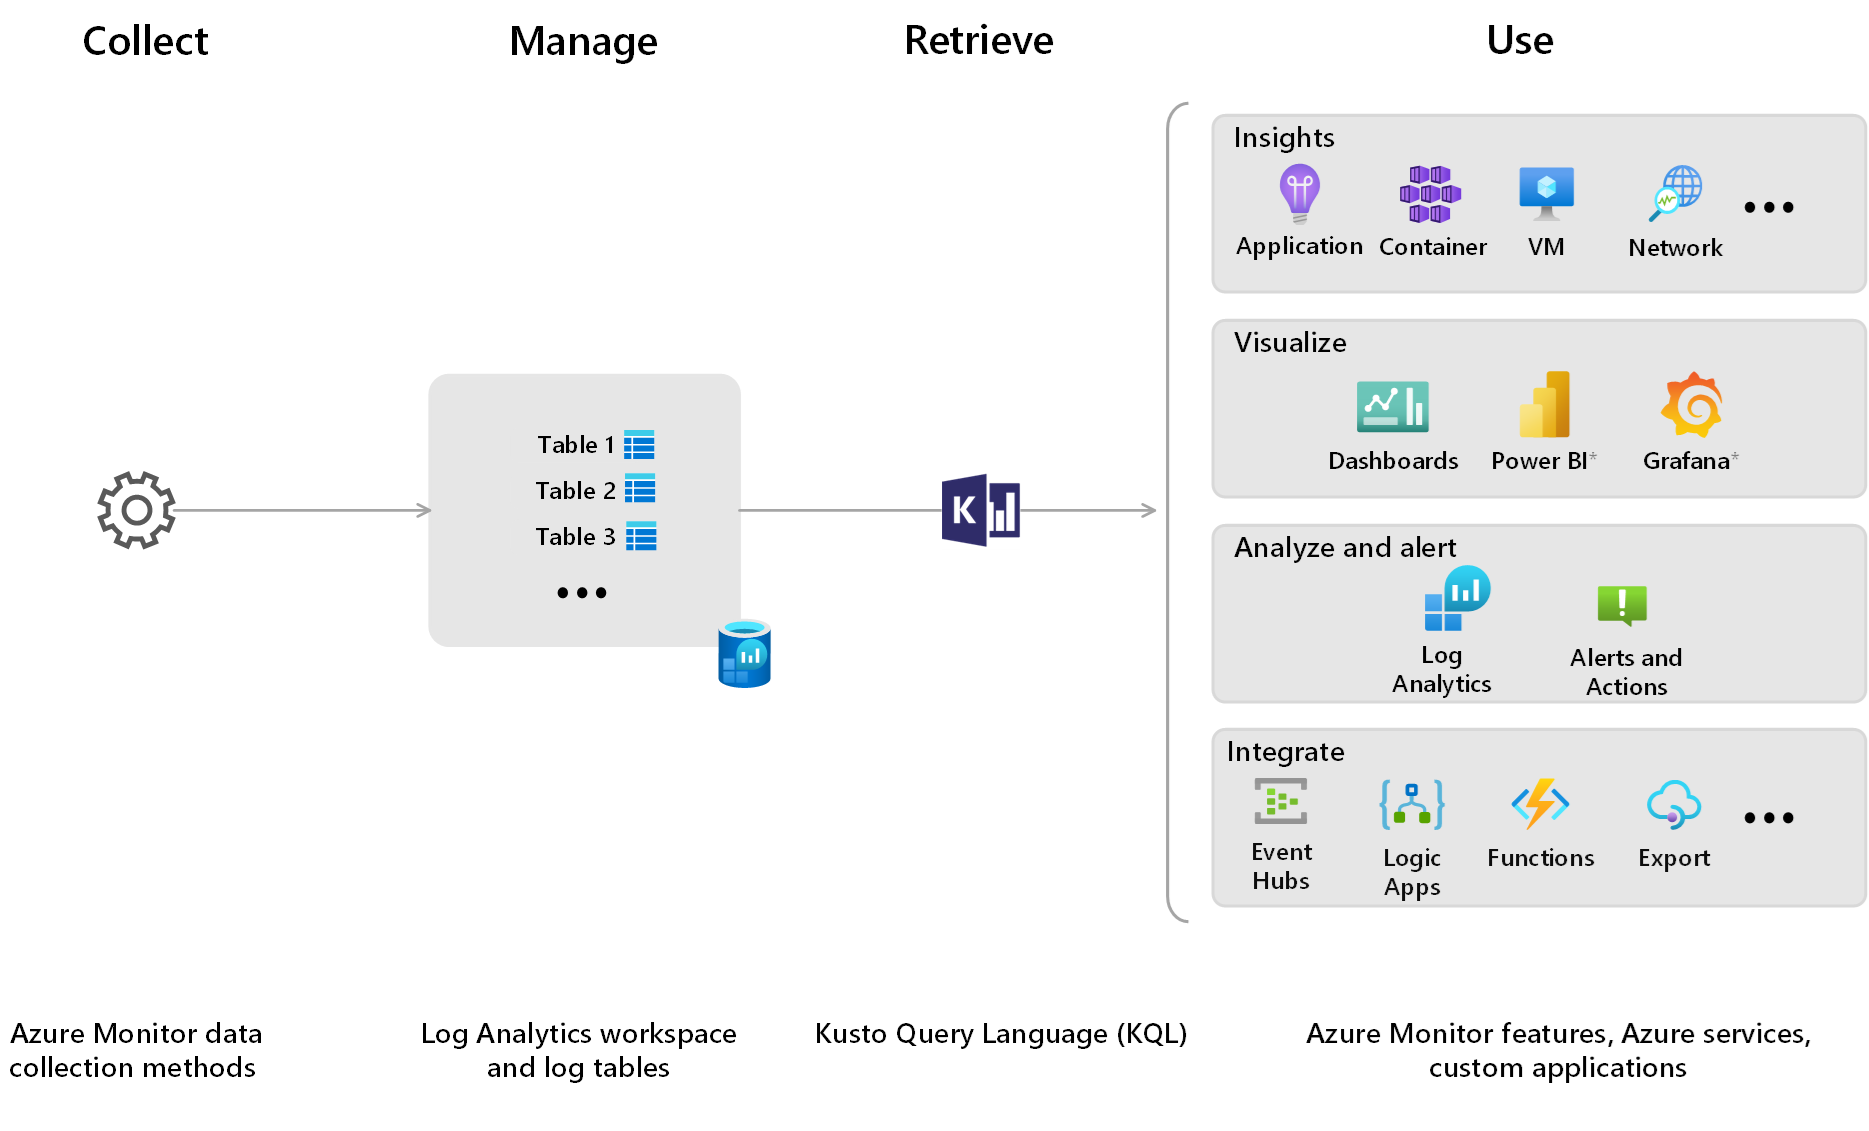
Azure Monitor Logs provides you with the tools to:
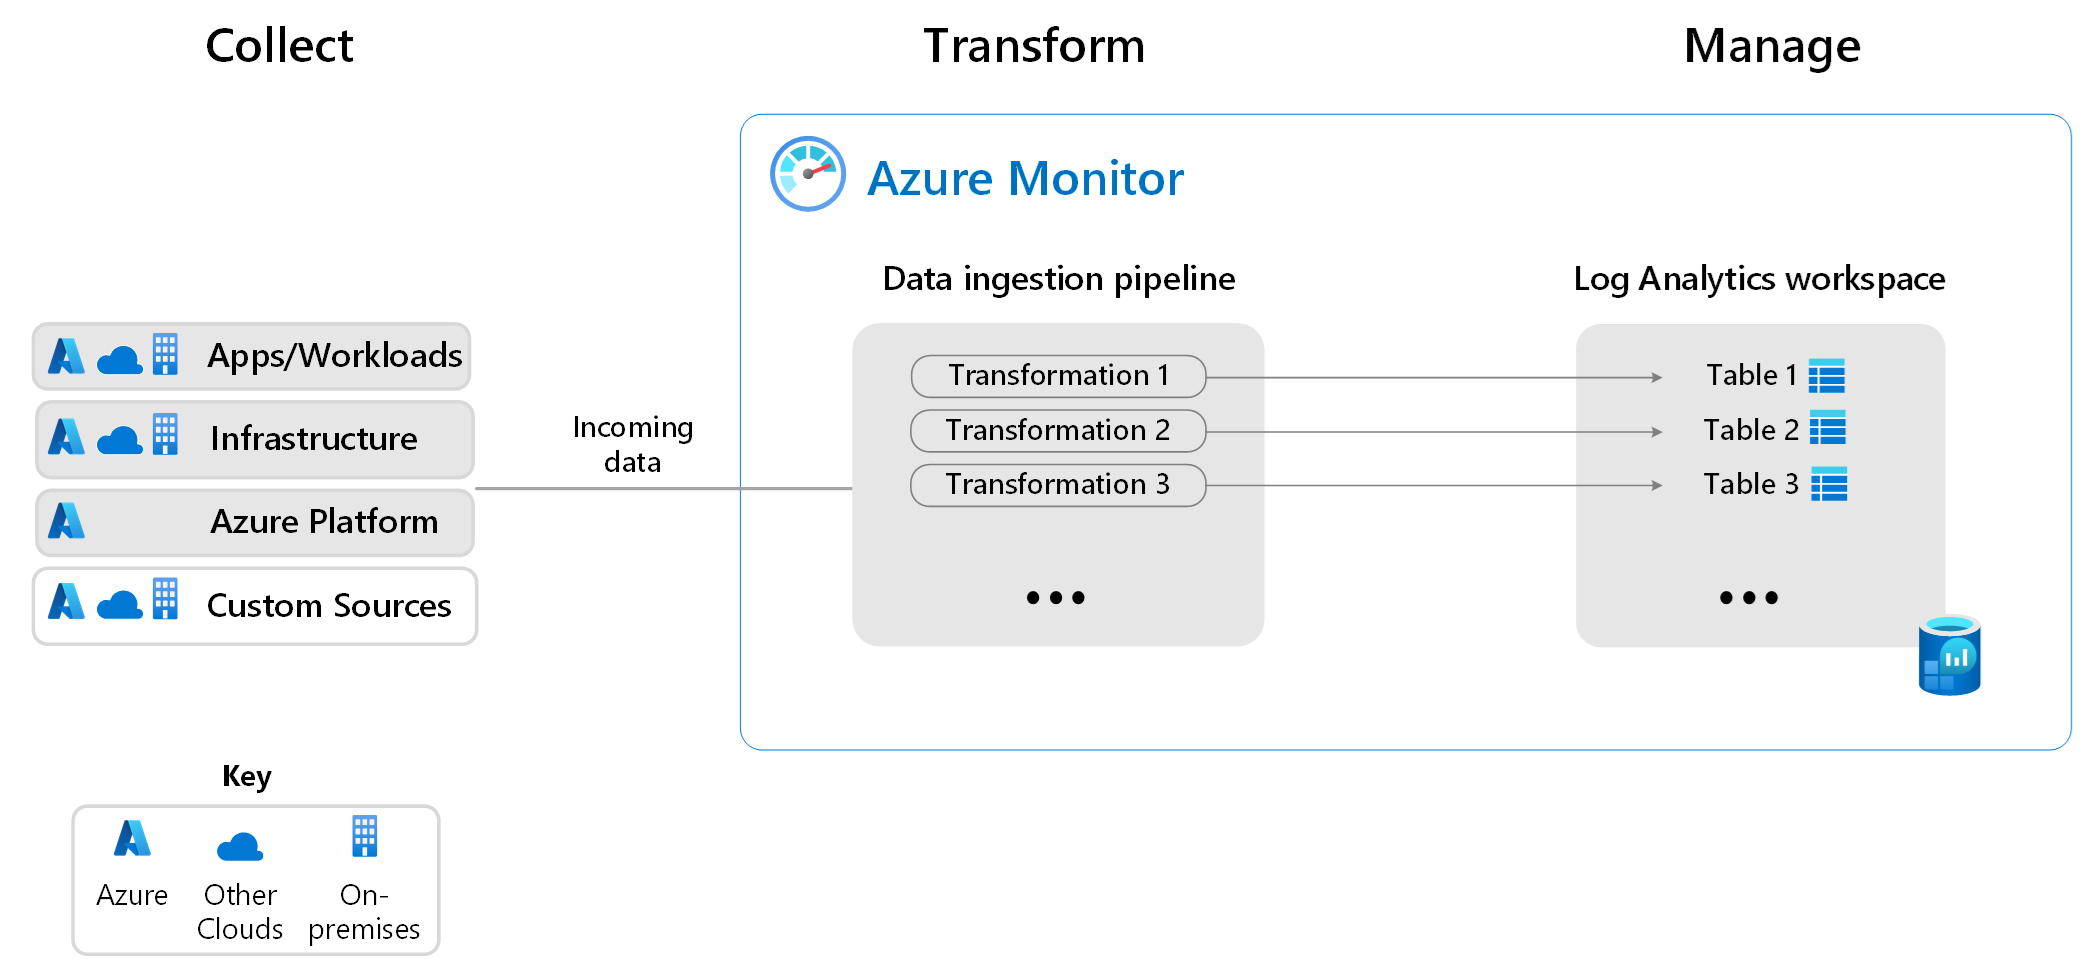
- Collect any data by using Azure Monitor data collection methods. Transform data based on your needs to optimize costs, remove personal data, and so on, and route data to tables in your Log Analytics workspace.
- Manage and optimize log data and costs by configuring your Log Analytics workspace and log tables, including table schemas, table plans, data retention, data aggregation, who has access to which data, and log-related costs.
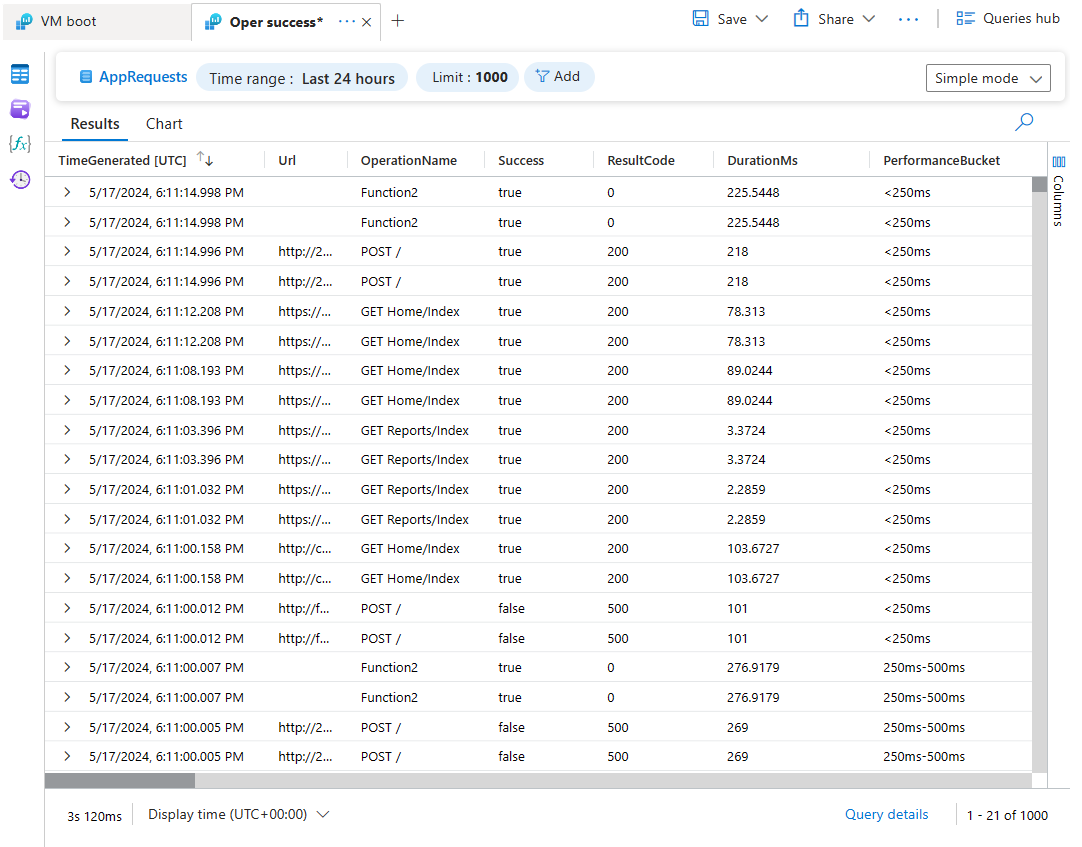
- Retrieve data in near-real time by using Kusto Query language (KQL), or KQL-based tools and features that don't require KQL knowledge, such as Simple mode in the Log Analytics user interface, prebuilt curated monitoring experiences called Insights, and predefined queries.
- Use data flexibly for a range of use cases, including data analysis, troubleshooting, alerting, dashboards and reports, custom applications, and other Azure or non-Azure services.
Data collection, routing, and transformation
Azure Monitor's data collection capabilities let you collect data from all of your applications and resources running in Azure, other clouds, and on-premises. A powerful ingestion pipeline enables filtering, transforming, and routing data to destination tables in your Log Analytics workspace to optimize costs, analytics capabilities, and query performance.
For more information on data collection and transformation, see Azure Monitor data sources and data collection methods and Data collection transformations in Azure Monitor.
Log Analytics workspace
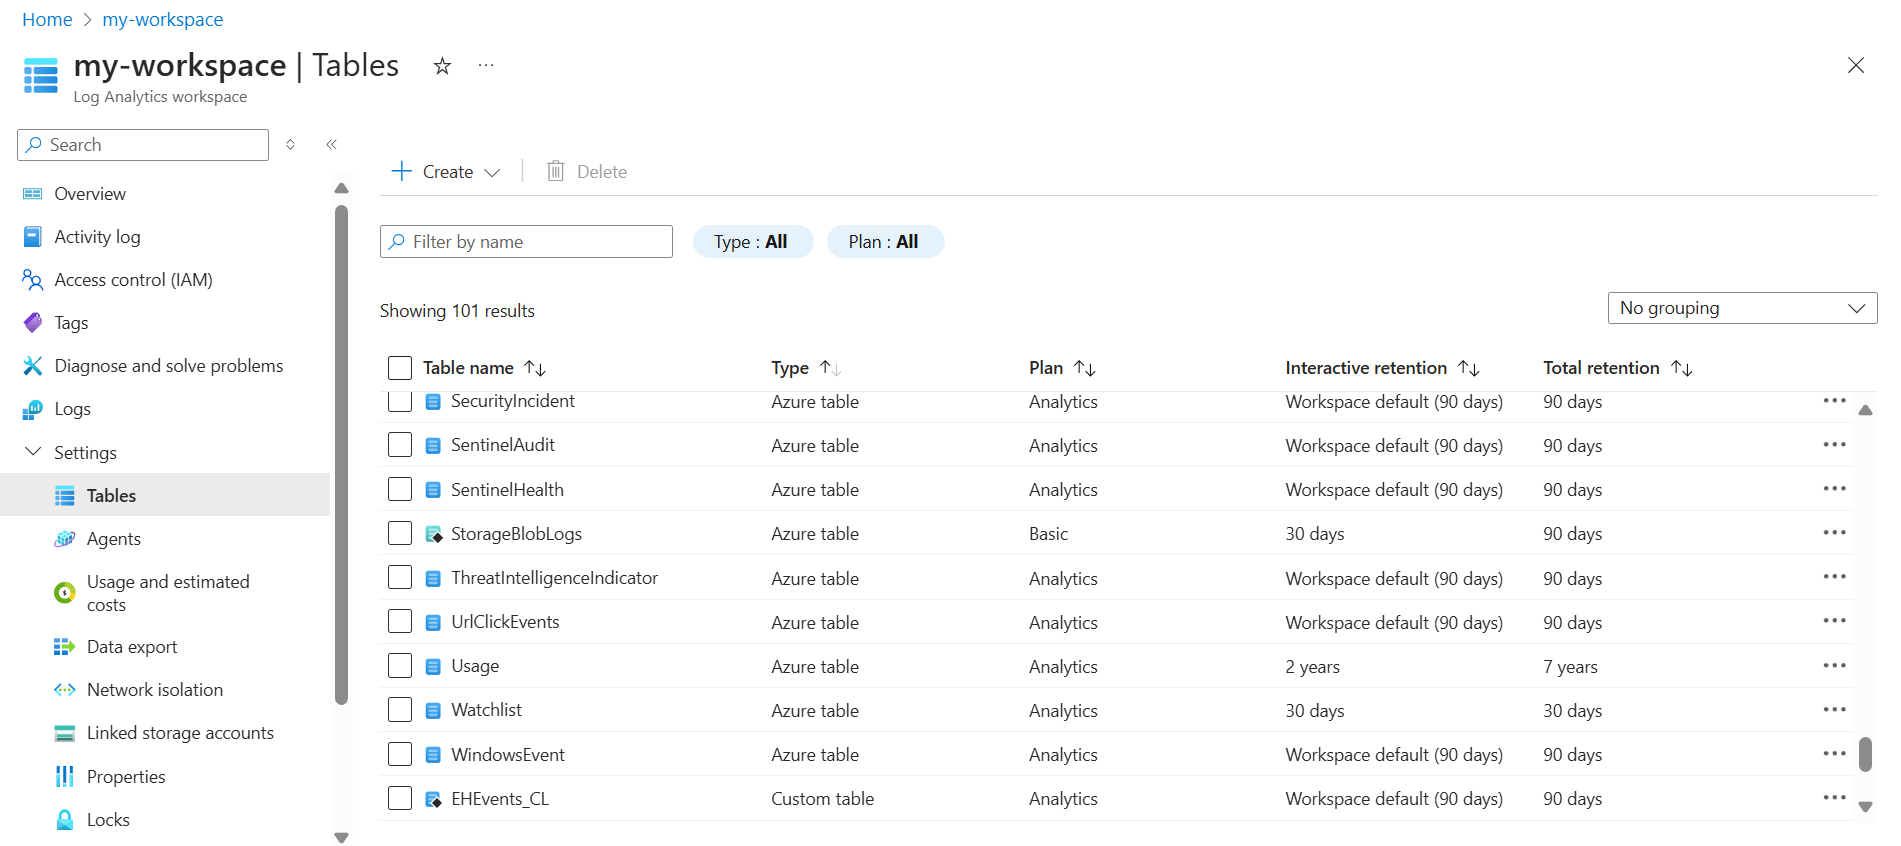
A Log Analytics workspace is a data store that holds tables into which you collect data.
To address the data storage and consumption needs of various personas who use a Log Analytics workspace, you can:
- Define table plans based on your data consumption and cost management needs.
- Manage low-cost long-term retention and interactive retention for each table.
- Manage access to the workspace and to specific tables.
- Use summary rules to aggregate data to summarized tables. This lets you optimize data collected over time for actionable insights and use in ongoing analysis, dashboards, and business reports.
- Create ready-to-run saved queries, visualizations, and alerts tailored to specific personas.
You can also configure network isolation, replicate your workspace across regions, and design a workspace architecture based on your business needs.
Table plans
You can use one Log Analytics workspace to store any type of log required for any purpose. For example:
- High-volume, verbose data that requires cheap long-term storage for audit and compliance
- App and resource data for troubleshooting by developers
- Key event and performance data for scaling and alerting to ensure ongoing operational excellence and security
- Aggregated long-term data trends for advanced analytics and machine learning
Table plans let you manage data costs based on how often you use the data in a table and the type of analysis you need the data for.
This video provides an overview of how table plans enable multi-tier logging in Azure Monitor Logs:
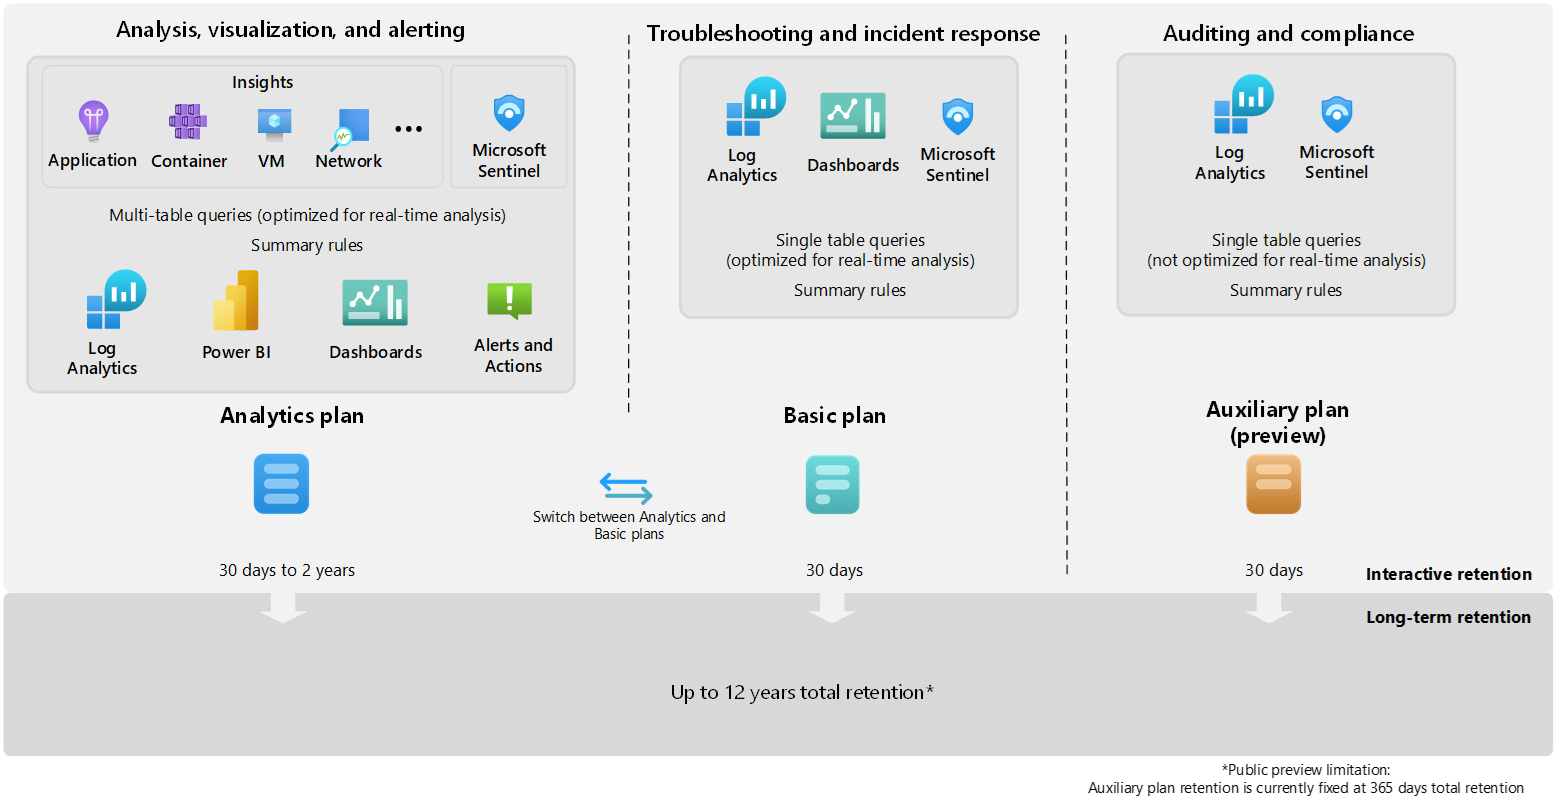
The diagram and table below compare the Analytics, Basic, and Auxiliary table plans. For information about interactive and long-term retention, see Manage data retention in a Log Analytics workspace. For information about how to select or modify a table plan, see Select a table plan.
| Features | Analytics | Basic | Auxiliary (Preview) |
|---|---|---|---|
| Best for | High-value data used for continuous monitoring, real-time detection, and performance analytics. | Medium-touch data needed for troubleshooting and incident response. | Low-touch data, such as verbose logs, and data required for auditing and compliance. |
| Supported table types | All table types | Azure tables that support Basic logs and DCR-based custom tables | DCR-based custom tables |
| Ingestion cost | Standard | Reduced | Minimal |
| Query price included | ✅ | ❌ | ❌ |
| Optimized query performance | ✅ | ✅ | ❌ Slower queries. Good for auditing. Not optimized for real-time analysis. |
| Query capabilities | Full query capabilities. | Full Kusto Query Language (KQL) on a single table, which you can extend with data from an Analytics table using lookup. | Full KQL on a single table, which you can extend with data from an Analytics table using lookup. |
| Alerts | ✅ | ❌ | ❌ |
| Insights | ✅ | ❌ | ❌ |
| Dashboards | ✅ | ✅ Cost per query for dashboard refreshes not included.1 | Possible, but slow to refresh, cost per query for dashboard refreshes not included.1 |
| Data export | ✅ | ✅ | ❌ |
| Microsoft Sentinel | ✅ | ✅ | ✅ |
| Search jobs | ✅ | ✅ | ✅ |
| Summary rules | ✅ | ✅ KQL limited to a single table | ✅ KQL limited to a single table |
| Restore | ✅ | ✅ | ❌ |
| Interactive retention | 30 days (90 days for Microsoft Sentinel and Application Insights). Can be extended to up to two years at a prorated monthly long-term retention charge. |
30 days | 30 days |
| Total retention | Up to 12 years | Up to 12 years | Up to 12 years* *Public preview limitation: Auxiliary plan total retention is currently fixed at 365 days. |
1 Basic and Auxiliary table plans currently support Workbooks and Grafana.
Note
The Auxiliary table plan is in public preview. For current limitations and supported regions, see Public preview limitations.
The Basic and Auxiliary table plans aren't available for workspaces in legacy pricing tiers.
Kusto Query Language (KQL) and Log Analytics
You retrieve data from a Log Analytics workspace using a Kusto Query Language (KQL) query, which is a read-only request to process data and return results. KQL is a powerful tool that can analyze millions of records quickly. Use KQL to explore your logs, transform and aggregate data, discover patterns, identify anomalies and outliers, and more.
Log Analytics is a tool in the Azure portal for running log queries and analyzing their results. Log Analytics Simple mode lets any user, regardless of their knowledge of KQL, retrieve data from one or more tables with one click. A set of controls lets you explore and analyze the retrieved data using the most popular Azure Monitor Logs functionality in an intuitive, spreadsheet-like experience.
If you're familiar with KQL, you can use Log Analytics KQL mode to edit and create queries, which you can then use in Azure Monitor features such as alerts and workbooks, or share with other users.
For more information about Log Analytics, see Overview of Log Analytics in Azure Monitor.
Built-in insights and custom dashboards, workbooks, and reports
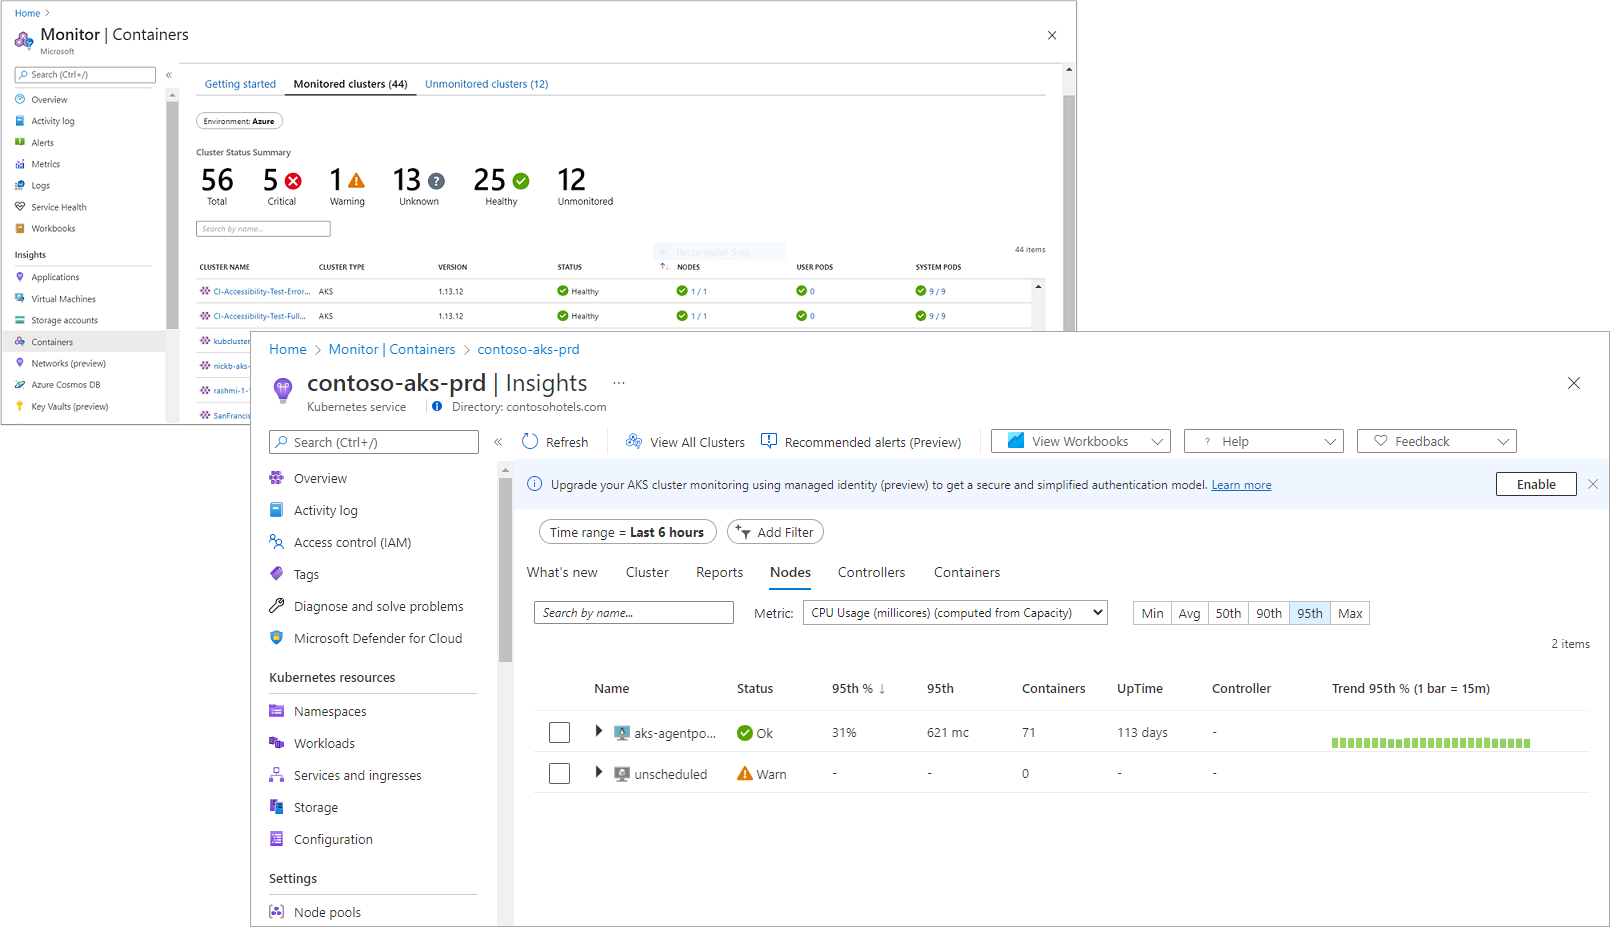
Many of Azure Monitor's ready-to-use, curated Insights experiences store data in Azure Monitor Logs, and present this data in an intuitive way so you can monitor the performance and availability of your cloud and hybrid applications and their supporting components.
You can also create your own visualizations and reports using workbooks, dashboards, and Power BI.
Tip
Instead of running complex queries on large data sets or long time ranges, use summary rules to aggregate data for custom dashboards, workbooks, and reports. Summary rules aggregate data from one or more tables as the data arrives at your Log Analytics workspace. Visualizing the aggregated data directly from a custom table of summarized data, instead of querying raw data from one or more tables, improves query performance and reduces query errors and timeouts.
Use cases
This table describes some of the ways that you can use the data you collect in Azure Monitor Logs to derive operational and business value.
| Capability | Description |
|---|---|
| Analyze | Use Log Analytics in the Azure portal to write log queries and interactively analyze log data by using a powerful analysis engine. |
| Aggregate | Use summary rules to aggregate information you need for alerting and analysis from the raw log data you ingest. This lets you optimize your costs, analysis capabilities, and query performance. |
| Detect and analyze anomalies | Use built-in or custom anomaly detection algorithms to identify unusual patterns or behaviors in your log data. This helps in early detection of potential issues. |
| Alert | Configure a log search alert rule or metric alert for logs to send a notification or take automated action when a particular condition occurs. |
| Visualize | Pin query results rendered as tables or charts to an Azure dashboard. Create a workbook to combine with multiple sets of data in an interactive report. Export the results of a query to Power BI to use different visualizations and share with people outside Azure. Export the results of a query to Grafana to use its dashboarding and combine with other data sources. |
| Get insights | Insights provide a customized monitoring experience for particular resources and services. |
| Retrieve | Access log query results from:
|
| Import | Upload logs from a custom app via the REST API or client library for .NET, Go, Java, JavaScript, or Python. |
| Export | Configure automated export of log data to an Azure Storage account or Azure Event Hubs. Build a workflow to retrieve log data and copy it to an external location by using Azure Logic Apps. |
| Bring your own analysis | Analyze data in Azure Monitor Logs using a notebook to create streamlined, multi-step processes on top of data you collect in Azure Monitor Logs. This is especially useful for purposes such as building and running machine learning pipelines, advanced analysis, and troubleshooting guides (TSGs) for Support needs. |
| Retain data for auditing and compliance | Send data directly to a table with the Auxiliary plan and extend retention of data in any table to keep data for auditing and compliance to up to 12 years. The low-cost Auxiliary table plan and in-workspace, long-term retention let you reduce costs and use your data quickly and easily when you need it. |
Working with Microsoft Sentinel and Microsoft Defender for Cloud
Microsoft Sentinel and Microsoft Defender for Cloud perform Security monitoring in Azure.
These services store their data in Azure Monitor Logs so that it can be analyzed with other log data collected by Azure Monitor.
Learn more
Next steps
- Learn about log queries to retrieve and analyze data from a Log Analytics workspace.
- Learn about metrics in Azure Monitor.
- Learn about the monitoring data available for various resources in Azure.
