Aggregate data in a Log Analytics workspace by using summary rules (Preview)
A summary rule lets you aggregate log data at a regular cadence and send the aggregated results to a custom log table in your Log Analytics workspace. Use summary rules to optimize your data for:
Analysis and reports, especially over large data sets and time ranges, as required for security and incident analysis, month-over-month or annual business reports, and so on. Complex queries on a large data set often time out. It's easier and more efficient to analyze and report on cleaned and aggregated summarized data.
Cost savings on verbose logs, which you can retain for as little or as long as you need in a cheap Basic log table, and send summarized data to an Analytics table for analysis and reports.
Security and data privacy by removing or obfuscating privacy details in summarized shareable data and limiting access to tables with raw data.
This article describes how summary rules work and how to define and view summary rules, and provides some examples of the use and benefits of summary rules.
Here's a video that provides an overview of some of the benefits of summary rules:
How summary rules work
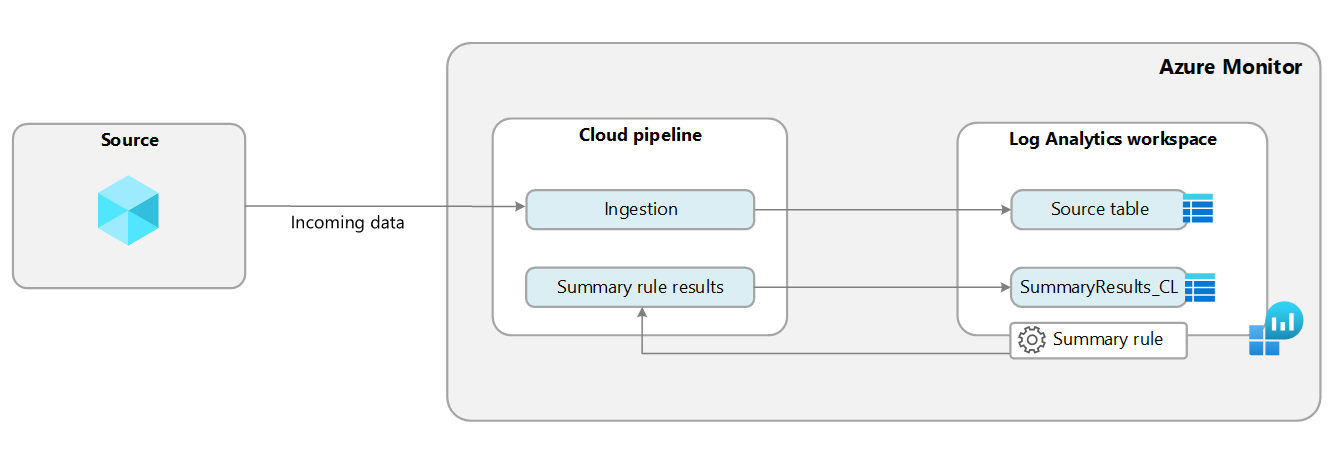
Summary rules perform batch processing directly in your Log Analytics workspace. The summary rule aggregates chunks of data, defined by bin size, based on a KQL query, and re-ingests the summarized results into a custom table with an Analytics log plan in your Log Analytics workspace.
You can aggregate data from any table, regardless of whether the table has an Analytics or Basic data plan. Azure Monitor creates the destination table schema based on the query you define. If the destination table already exists, Azure Monitor appends any columns required to support the query results. All destination tables also include a set of standard fields with summary rule information, including:
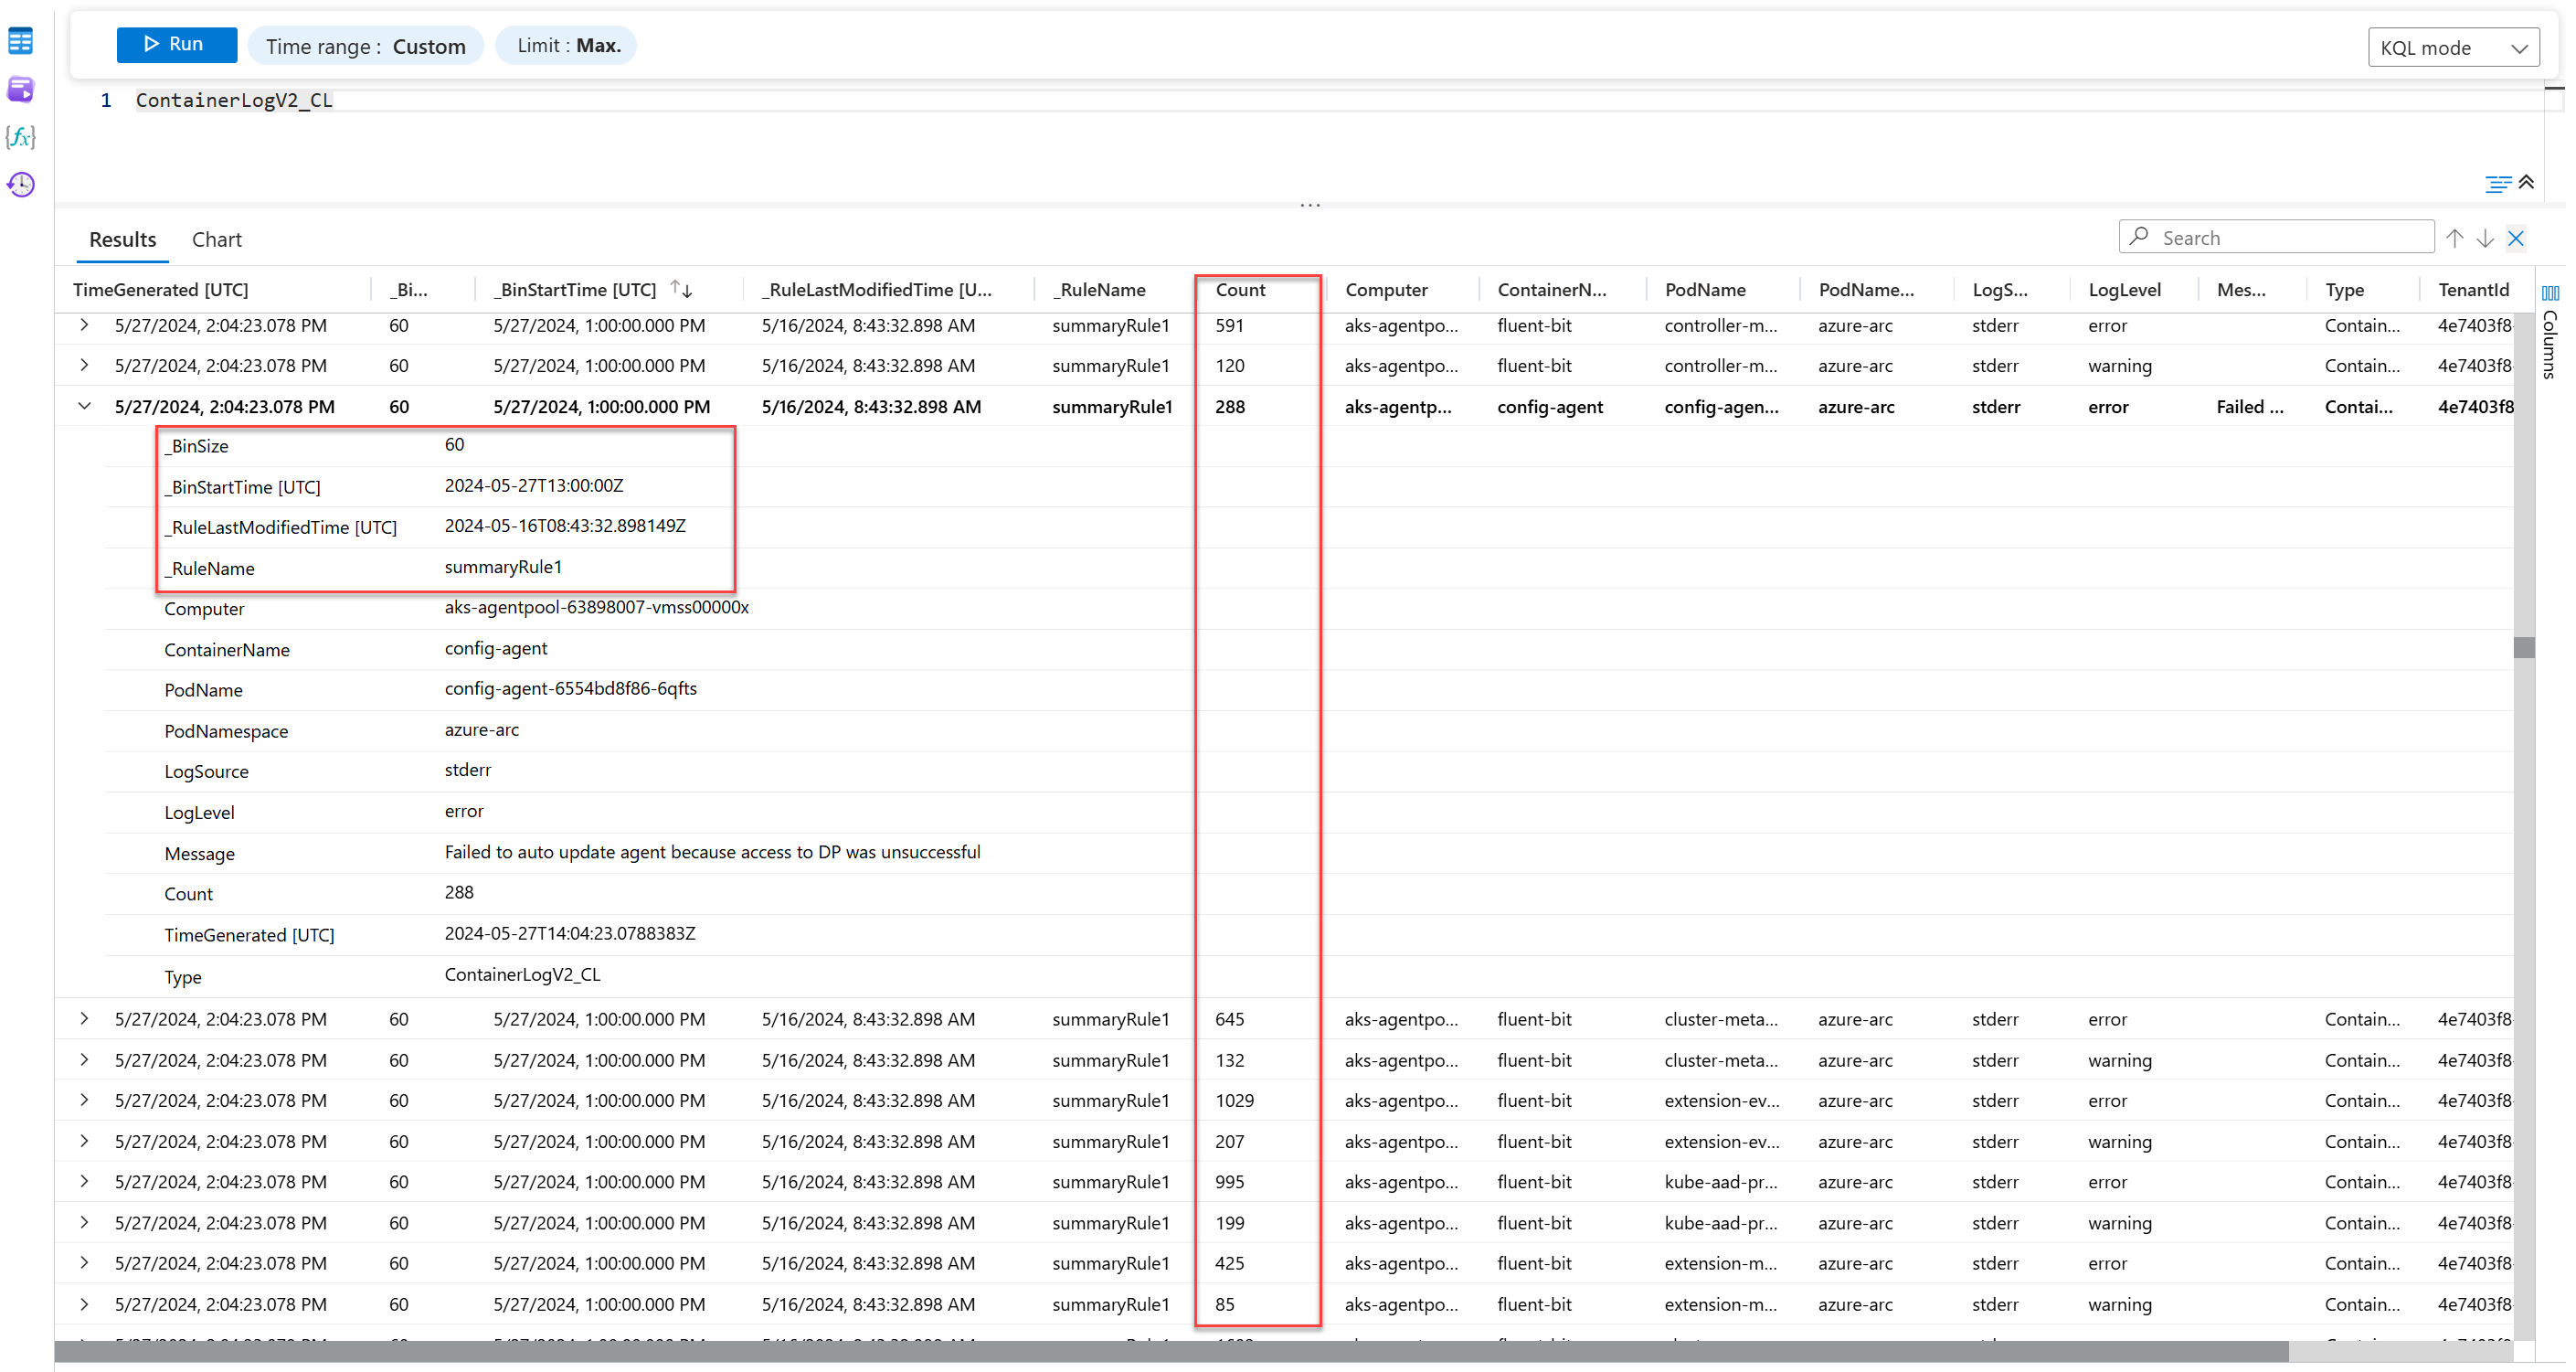
_RuleName: The summary rule that generated the aggregated log entry._RuleLastModifiedTime: When the rule was last modified._BinSize: The aggregation interval._BinStartTime: The aggregation start time.
You can configure up to 30 active rules to aggregate data from multiple tables and send the aggregated data to separate destination tables or the same table.
You can export summarized data from a custom log table to a storage account or Event Hubs for further integrations by defining a data export rule.
Example: Summarize ContainerLogsV2 data
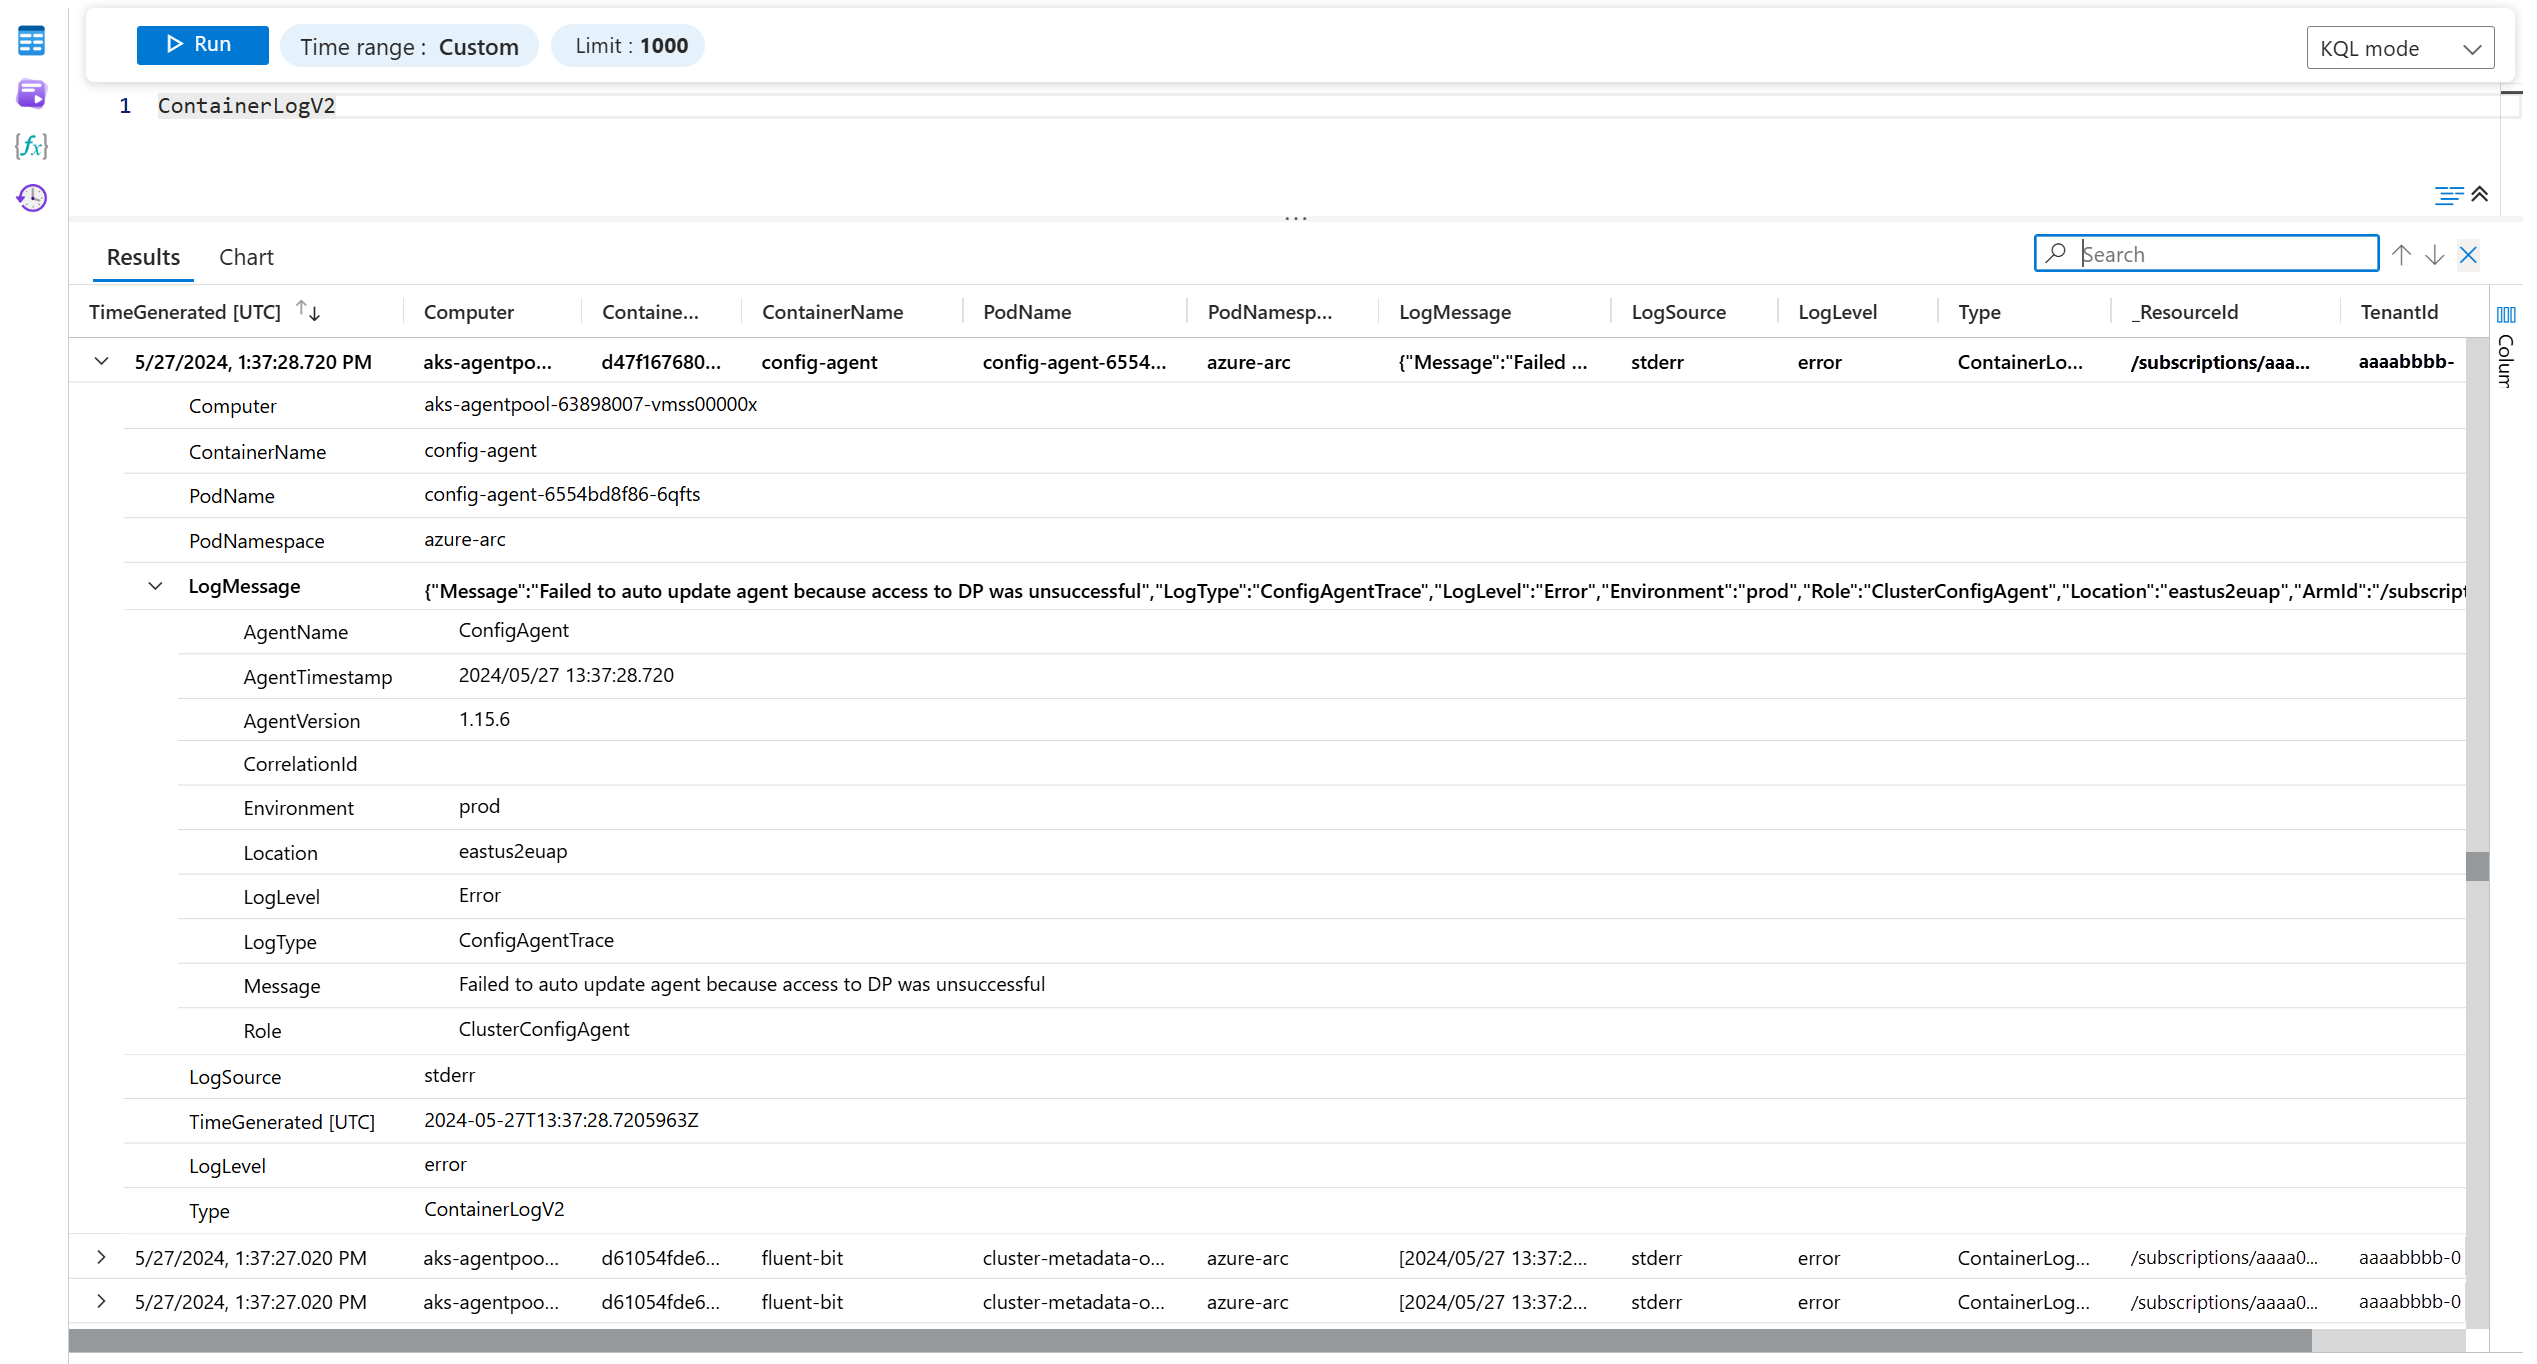
If you're monitoring containers, you ingest a large volume of verbose logs into the ContainerLogsV2 table.
You might use this query in your summary rule to aggregate all unique log entries within 60 minutes, keeping the data that's useful for analysis and dropping data you don't need:
ContainerLogV2 | summarize Count = count() by Computer, ContainerName, PodName, PodNamespace, LogSource, LogLevel, Message = tostring(LogMessage.Message)
Here's the raw data in the ContainerLogsV2 table:
Here's the aggregated data that the summary rule sends to the destination table:
Instead of logging hundreds of similar entries within an hour, the destination table shows the count of each unique entry, as defined in the KQL query. Set the Basic data plan on the ContainerLogsV2 table for cheap retention of the raw data, and use the summarized data in the destination table for your analysis needs.
Permissions required
| Action | Permissions required |
|---|---|
| Create or update summary rule | Microsoft.Operationalinsights/workspaces/summarylogs/write permissions to the Log Analytics workspace, as provided by the Log Analytics Contributor built-in role, for example |
| Create or update destination table | Microsoft.OperationalInsights/workspaces/tables/write permissions to the Log Analytics workspace, as provided by the Log Analytics Contributor built-in role, for example |
| Enable query operation in workspace | Microsoft.OperationalInsights/workspaces/query/read permissions to the Log Analytics workspace, as provided by the Log Analytics Reader built-in role, for example |
| Query all tables in workspace | Microsoft.OperationalInsights/workspaces/query/*/read permissions to the Log Analytics workspace, as provided by the Log Analytics Reader built-in role, for example |
| Query logs in a table | Microsoft.OperationalInsights/workspaces/query/<table>/read permissions to the Log Analytics workspace, as provided by the Log Analytics Reader built-in role, for example |
| Query logs in a table (table action) | Microsoft.OperationalInsights/workspaces/tables/query/read permissions to the Log Analytics workspace, as provided by the Log Analytics Reader built-in role, for example |
| Use queries encrypted in a customer-managed storage account | Microsoft.Storage/storageAccounts/* permissions to the storage account, as provided by the Storage Account Contributor built-in role, for example |
Implementation considerations
- The maximum number of active rules in a workspace is 30.
- Summary rules are currently only available in the public cloud.
- The summary rule processes incoming data and can't be configured on a historical time range.
- When bin execution retries are exhausted, the bin is skipped and can't be re-executed.
- Querying a Log Analytics workspace in another tenant by using Lighthouse isn't supported.
Pricing model
There's no extra cost for Summary rules. You only pay for the query and the ingestion of results to the destination table, based on the table plan of the source table on which you run the query:
| Source table plan | Query cost | Summary results ingestion cost |
|---|---|---|
| Analytics | No cost | Ingestion of Analytics logs |
| Basic and Auxiliary | Data scan | Ingestion of Analytics logs |
For example, the cost calculation for an hourly rule that returns 100 records per bin is:
| Source table plan | Monthly price calculation |
|---|---|
| Analytics | Ingestion price x record volume x number of records x 24 hours x 30 days. |
| Basic and Auxiliary | Data scan price x scanned volume + Ingestion price x record volume x number of records x 24 hours x 30 days. For continuously running rule, all incoming data to source table is scanned. |
For more information, see Azure Monitor pricing.
Create or update a summary rule
The operators you can use in summary rule your query depend on the plan of the source table in the query.
- Analytics: Supports all KQL operators and functions, except for:
- Cross-resource queries, which use the
workspaces(),app(), andresource()expressions, and cross-service queries, which use theADX()andARG()expressions. - Plugins that reshape the data schema, including bag unpack, narrow, and pivot.
- Cross-resource queries, which use the
- Basic: Supports all KQL operators on a single table. You can join up to five Analytics tables using the lookup operator.
- Functions: User-defined functions aren't supported. System functions provided by Microsoft are supported.
Summary rules are most beneficial in term of cost and query experiences when results count or volume are reduced significantly. For example, aiming for results volume 0.01% or less than source. Before you create a rule, experiment query in Log Analytics, and verify the followings:
- Check that the query produces the intended expected results and schema.
- The query doesn't reach or near the query API limits.
- A record size in results is less than 1MB.
If the query is close to the query limits, consider using a smaller 'bin size' to process less data per bin. You can also modify the query to return fewer records or fields with higher volume.
When you update a query and there are fewer fields in summary results, Azure Monitor doesn't automatically remove the columns from the destination table, and you need to delete columns from your table manually.
To create or update a summary rule, make this PUT API call:
PUT https://management.azure.com/subscriptions/{subscriptionId}/resourceGroups/{resourcegroup}/providers/Microsoft.OperationalInsights/workspaces/{workspace}/summarylogs/{ruleName}?api-version=2023-01-01-preview
Authorization: {credential}

{
  "properties": {
      "ruleType": "User",
      "description": "My test rule",
      "ruleDefinition": {
          "query": "StorageBlobLogs | summarize count() by AccountName",
          "binSize": 30,
          "destinationTable": "MySummaryLogs_CL"
      }
  }
}
This table describes the summary rule parameters:
| Parameter | Valid values | Description |
|---|---|---|
ruleType |
User or System |
Specifies the type of rule. - User: Rules you define. - System: Predefined rules managed by Azure services. |
description |
String | Describes the rule and its function. This parameter is helpful when you have several rules and can help with rule management. |
binSize |
20, 30, 60, 120, 180, 360, 720, or 1440 (minutes) |
Defines the aggregation interval and lookback time range. For example, if you set "binSize": 120, you might get entries for 02:00 to 04:00 and 04:00 to 06:00. |
query |
Kusto Query Language (KQL) query | Defines the query to execute in the rule. You don't need to specify a time range because the binSize parameter determines the aggregation interval - for example, 02:00 to 03:00 if "binSize": 60. If you add a time filter in the query, the time rage used in the query is the intersection between the filter and the bin size. |
destinationTable |
tablename_CL |
Specifies the name of the destination custom log table. The name value must have the suffix _CL. Azure Monitor creates the table in the workspace, if it doesn't already exist, based on the query you set in the rule. If the table already exists in the workspace, Azure Monitor adds any new columns introduced in the query. If the summary results include a reserved column name - such as TimeGenerated, _IsBillable, _ResourceId, TenantId, or Type - Azure Monitor appends the _Original prefix to the original fields to preserve their original values. |
binDelay (optional) |
Integer (minutes) | Sets a time to wait before bin execution, typically useful when executed on late arriving data, also known as ingestion latency, and allows most data to arrive. The default delay is from three and a half minutes to 10% of the binSize value. If you know that the data you query is typically ingested with delay, set the binDelay parameter with the known delay value or greater, up to 1440 minutes. For more information, see Configure the aggregation timing.In some cases, Azure Monitor might begin bin execution slightly after the set bin delay to ensure service reliability and query success. |
binStartTime (optional) |
Datetime in%Y-%n-%eT%H:%M %Z format |
Specifies the date and time for the initial bin execution. The value can start at rule creation datetime minus the binSize value, or later and in whole hours. For example, if the datetime is 2023-12-03T12:13Z and binSize is 1,440, the earliest valid binStartTime value is 2023-12-02T13:00Z, and the aggregation includes data logged between 02T13:00 and 03T13:00. In this scenario, the rules start aggregating a 03T13:00 plus the default or specified delay. The binStartTime parameter is useful in daily summary scenarios. Suppose you're in the UTC-8 time zone and you create a daily rule at 2023-12-03T12:13Z. You want the rule to complete before you start your day at 8:00 (00:00 UTC). Set the binStartTime parameter to 2023-12-02T22:00Z. The first aggregation includes all data logged between 02T:06:00 and 03T:06:00 local time, and the rule runs at the same time daily. For more information, see Configure the aggregation timing.When you update rules, you can either: - Use the existing binStartTime value or remove the binStartTime parameter, in which case execution continues based on the initial definition.- Update the rule with a new binStartTime value to set a new datetime value. |
displayName (optional) |
String | Specifies the rule display name in Azure portal experiences. |
timeSelector (optional) |
TimeGenerated |
Defines the timestamp field that Azure Monitor uses to aggregate data. For example, if you set "binSize": 120, you might get entries with a TimeGenerated value between 02:00 and 04:00. |
Configure the aggregation timing
By default, the summary rule creates the first aggregation shortly after the next whole hour.
The short delay Azure Monitor adds accounts for ingestion latency - or the time between when the data is created in the monitored system and the time that it becomes available for analysis in Azure Monitor. By default, this delay is between three and a half minutes to 10% of the 'bin size' value before aggregating each bin. In most cases, this delay ensures that Azure Monitor aggregates all data logged within each bin period.
For example:
You create a summary rule with a bin size of 30 minutes at 14:44.
The rule creates the first aggregation shortly after 15:00 - for example, at 15:04 - for data logged between 14:30 and 15:00.
You create a summary rule with a bin size of 720 minutes (12 hours) at 14:44.
The rule creates the first aggregation at 16:12 - 72 minutes (10% of the 720 bin size) after 13:00 - for data logged between 03:00 and 15:00.
Use the binStartTime and binDelay parameters to change the timing of the first aggregation and the delay Azure Monitor adds before each aggregation.
The next sections provide examples of the default aggregation timing and the more advanced aggregation timing options.
Use default aggregation timing
In this example, the summary rule is created at on 2023-06-07 at 14:44, and Azure Monitor adds a default delay of four minutes.
| binSize (minutes) | Initial rule run | First aggregation | Second aggregation |
|---|---|---|---|
| 1440 | 2023-06-07 15:04 | 2023-06-06 15:00 - 2023-06-07 15:00 | 2023-06-07 15:00 - 2023-06-08 15:00 |
| 720 | 2023-06-07 15:04 | 2023-06-07 03:00 - 2023-06-07 15:00 | 2023-06-07 15:00 - 2023-06-08 03:00 |
| 360 | 2023-06-07 15:04 | 2023-06-07 09:00 - 2023-06-07 15:00 | 2023-06-07 15:00 - 2023-06-07 21:00 |
| 180 | 2023-06-07 15:04 | 2023-06-07 12:00 - 2023-06-07 15:00 | 2023-06-07 15:00 - 2023-06-07 18:00 |
| 120 | 2023-06-07 15:04 | 2023-06-07 13:00 - 2023-06-07 15:00 | 2023-06-07 15:00 - 2023-06-07 17:00 |
| 60 | 2023-06-07 15:04 | 2023-06-07 14:00 - 2023-06-07 15:00 | 2023-06-07 15:00 - 2023-06-07 16:00 |
| 30 | 2023-06-07 15:04 | 2023-06-07 14:30 - 2023-06-07 15:00 | 2023-06-07 15:00 - 2023-06-07 15:30 |
| 20 | 2023-06-07 15:04 | 2023-06-07 14:40 - 2023-06-07 15:00 | 2023-06-07 15:00 - 2023-06-07 15:20 |
Set optional aggregation timing parameters
In this example, the summary rule is created at on 2023-06-07 at 14:44, and the rule includes these advanced configuration settings:
binStartTime: 2023-06-08 07:00binDelay: 8 minutes
| binSize (minutes) | Initial rule run | First aggregation | Second aggregation |
|---|---|---|---|
| 1440 | 2023-06-09 07:08 | 2023-06-08 07:00 - 2023-06-09 07:00 | 2023-06-09 07:00 - 2023-06-10 07:00 |
| 720 | 2023-06-08 19:08 | 2023-06-08 07:00 - 2023-06-08 19:00 | 2023-06-08 19:00 - 2023-06-09 07:00 |
| 360 | 2023-06-08 13:08 | 2023-06-08 07:00 - 2023-06-08 13:00 | 2023-06-08 13:00 - 2023-06-08 19:00 |
| 180 | 2023-06-08 10:08 | 2023-06-08 07:00 - 2023-06-08 10:00 | 2023-06-08 10:00 - 2023-06-08 13:00 |
| 120 | 2023-06-08 09:08 | 2023-06-08 07:00 - 2023-06-08 09:00 | 2023-06-08 09:00 - 2023-06-08 11:00 |
| 60 | 2023-06-08 08:08 | 2023-06-08 07:00 - 2023-06-08 08:00 | 2023-06-08 08:00 - 2023-06-08 09:00 |
| 30 | 2023-06-08 07:38 | 2023-06-08 07:00 - 2023-06-08 07:30 | 2023-06-08 07:30 - 2023-06-08 08:00 |
| 20 | 2023-06-08 07:28 | 2023-06-08 07:00 - 2023-06-08 07:20 | 2023-06-08 07:20 - 2023-06-08 07:40 |
View summary rules
Use this GET API call to view the configuration for a specific summary rule:
GET https://management.azure.com/subscriptions/{subscriptionId}/resourceGroups/{resourcegroup}/providers/Microsoft.OperationalInsights/workspaces/{workspace}/summarylogs/{ruleName1}?api-version=2023-01-01-preview
Authorization: {credential}
Use this GET API call to view the configuration to view the configuration of all summary rules in your Log Analytics workspace:
GET https://management.azure.com/subscriptions/{subscriptionId}/resourceGroups/{resourcegroup}/providers/Microsoft.OperationalInsights/workspaces/{workspace}/summarylogs?api-version=2023-01-01-preview
Authorization: {credential}
Stop and restart a summary rule
You can stop a rule for a period of time - for example, if you want to verify that data is ingested to a table and you don't want to affect the summarized table and reports. When you restart the rule, Azure Monitor starts processing data from the next whole hour or based on the defined binStartTime (optional) parameter.
To stop a rule, use this POST API call:
POST https://management.azure.com/subscriptions/{subscriptionId}/resourceGroups/{resourcegroup}/providers/Microsoft.OperationalInsights/workspaces/{workspace}/summarylogs/{ruleName}/stop?api-version=2023-01-01-preview
Authorization: {credential}
To restart the rule, use this POST API call:
POST https://management.azure.com/subscriptions/{subscriptionId}/resourceGroups/{resourcegroup}/providers/Microsoft.OperationalInsights/workspaces/{workspace}/summarylogs/{ruleName}/start?api-version=2023-01-01-preview
Authorization: {credential}
Delete a summary rule
You can have up to 30 active summary rules in your Log Analytics workspace. If you want to create a new rule, but you already have 30 active rules, you must stop or delete an active summary rule.
To delete a rule, use this DELETE API call:
DELETE https://management.azure.com/subscriptions/{subscriptionId}/resourceGroups/{resourcegroup}/providers/Microsoft.OperationalInsights/workspaces/{workspace}/summarylogs/{ruleName}?api-version=2023-01-01-preview
Authorization: {credential}
Monitor summary rules
To monitor summary rules, enable the Summary Logs category in the diagnostic settings of your Log Analytics workspace. Azure Monitor sends summary rule execution details, including summary rule run Start, Succeeded, and Failed information, to the LASummaryLogs table in your workspace.
We recommend you that you set up log alert rules to receive notification of bin failures, or when bin execution is nearing time-out, as shown below. Depending on the failure reason, you can either reduce the bin size to process less data on each execution, or modify the query to return fewer records or fields with higher volume.
This query returns failed runs:
LASummaryLogs | where Status == "Failed"
This query returns bin runs where the QueryDurationMs value is greater than 0.9 x 600,000 milliseconds:
LASummaryLogs | where QueryDurationMs > 0.9 * 600000
Verify data completeness
Summary rules are designed for scale, and include a retry mechanism to overcome transient service or query failures related to query limits, for example. The retry mechanism makes 10 attempts to aggregate a failed bin within eight hours, and skips a bin, if exhausted. The rule is set to isActive: false and put on hold after eight consecutive bin retries. If you enable monitor summary rules, Azure Monitor logs an event in the LASummaryLogs table in your workspace.
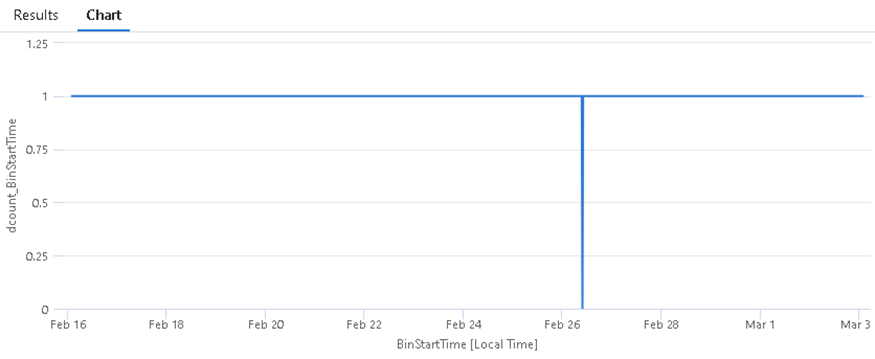
You can't rerun a failed bin run, but you can use the following query to view failed runs:
let startTime = datetime("2024-02-16");
let endtTime = datetime("2024-03-03");
let ruleName = "myRuleName";
let stepSize = 20m; // The stepSize value is equal to the bin size defined in the rule
LASummaryLogs
| where RuleName == ruleName
| where Status == 'Succeeded'
| make-series dcount(BinStartTime) default=0 on BinStartTime from startTime to endtTime step stepSize
| render timechart
This query renders the results as a timechart:
See the Monitor summary rules section for rule remediation options and proactive alerts.
Encrypt summary rule queries by using customer-managed keys
A KQL query can contain sensitive information in comments or in the query syntax. To encrypt summary rule queries, link a storage account to your Log Analytics workspace and use customer-managed keys.
Considerations when you work with encrypted queries:
- Linking a storage account to encrypt your queries doesn’t interrupt existing rules.
- By default, Azure Monitor stores summary rule queries in Log Analytics storage. If you have existing summary rules before you link a storage account to your Log Analytics workspace, update your summary rules so the queries to save the existing queries in the storage account.
- Queries that you save in a storage account are located in the
CustomerConfigurationStoreTabletable. These queries are considered service artifacts and their format might change. - You can use the same storage account for summary rule queries, saved queries in Log Analytics, and log alerts.
Troubleshoot summary rules
This section provides tips for troubleshooting summary rules.
Summary rule destination table accidentally deleted
If you delete the destination table while the summary rule is active, the rule gets suspended and Azure Monitor sends an event to the LASummaryLogs table with a message indicating that the rule was suspended.
If you don't need the summary results in the destination table, delete the rule and table. If you need to recover summary results, follow the steps in Create or update summary rules section to recreate the table. The destination table is restored, including the data ingested before the delete, depending on the retention policy in the table.
If you don't need the summary results in the destination table, delete the rule and table. If you need the summary results, follow the steps in the Create or update summary rules section to recreate the destination table and restore all data, including the data ingested before the delete, depending on the retention policy in the table.
Query uses operators that create new columns in the destination table
The destination table schema is defined when you create or update a summary rule. If the query in the summary rule includes operators that allow output schema expansion based on incoming data - for example, if the query uses the arg_max(expression, *) function - Azure Monitor doesn't add new columns to the destination table after you create or update the summary rule, and the output data that requires these columns will be dropped. To add the new fields to the destination table, update the summary rule or add a column to your table manually.
Data in removed columns remains in the workspace based on the table's retention settings
When you remove a field in the query, the columns and data remain in the destination and based on the retention period defined on the table or workspace. If you don't need the removed in destination table, delete the columns from the table schema. If you then add columns with the same name, any data that's not older that the retention period appears again.
Related content
- Learn more about Azure Monitor Logs data plans.
- Walk through a tutorial on using KQL mode in Log Analytics.
- Access the complete reference documentation for KQL.


