Query data in a Basic and Auxiliary table in Azure Monitor Logs
Basic and Auxiliary logs tables reduce the cost of ingesting high-volume verbose logs and let you query the data they store with some limitations. This article explains how to query data from Basic and Auxiliary logs tables.
For more information about Basic and Auxiliary table plans, see Azure Monitor Logs Overview: Table plans.
Note
Other tools that use the Azure API for querying - for example, Power BI - cannot access data in Basic and Auxiliary tables.
Permissions required
You must have Microsoft.OperationalInsights/workspaces/query/*/read permissions to the Log Analytics workspaces you query, as provided by the Log Analytics Reader built-in role, for example.
Limitations
Queries on data in Basic and Auxiliary tables are subject to the following limitations:
Kusto Query Language (KQL) language limitations
Queries of data in Basic or Auxiliary tables support all KQL scalar and aggregation functions. However, Basic or Auxiliary table queries are limited to a single table. Therefore, these limitations apply:
- Operators that join data from multiple tables are limited:
- User-defined functions aren't supported.
- Cross-service and cross-resource queries aren't supported.
Time range
Specify the time range in the query header in Log Analytics or in the API call. You can't specify the time range in the query body using a where statement.
Query scope
Set the Log Analytics workspace as the scope of your query. You can't run queries using another resource for the scope. For more information about query scope, see Log query scope and time range in Azure Monitor Log Analytics.
Concurrent queries
You can run two concurrent queries per user.
Auxiliary log query performance
Queries of data in Auxiliary tables are unoptimized and might take longer to return results than queries you run on Analytics and Basic tables.
Purge
You can’t purge personal data from Basic and Auxiliary tables.
Run a query on a Basic or Auxiliary table
Running a query on Basic or Auxiliary tables is the same as querying any other table in Log Analytics. See Get started with Azure Monitor Log Analytics if you aren't familiar with this process.
In the Azure portal, select Monitor > Logs > Tables.
In the list of tables, you can identify Basic and Auxiliary tables by their unique icon:
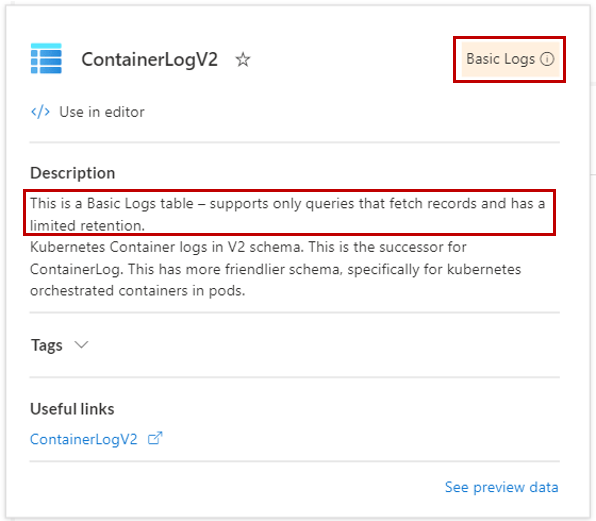
You can also hover over a table name for the table information view, which specifies that the table has the Basic or Auxiliary table plan:
When you add a table to the query, Log Analytics identifies a Basic or Auxiliary table and aligns the authoring experience accordingly.
Pricing model
The charge for a query on Basic and Auxiliary tables is based on the amount of data the query scans, which depends on the size of the table and the query's time range. The data scanned is defined as the volume of data that was ingested within the time range specified by the query for the table which is being queried. For example, a query that scans three days of data in a table that ingests 100 GB each day, would be charged for 300 GB.
For more information, see Azure Monitor pricing.

