Overview of computing Environmental, Social, and Governance metrics
Important
Some or all of this functionality is available as part of a preview release. The content and the functionality are subject to change.
You can select and compute the prebuilt metrics using the prebuilt notebooks and pipelines deployed as part of this capability.
Note
You can extend the notebooks and pipelines to support custom metrics. For more information, go to Create custom metrics.
Prerequisites
Load the prebuilt metrics definitions into the MetricsDefinitions and MetricsLabels tables in the ComputedESGMetrics_LH lakehouse by running the LoadDefinitionsForMetrics notebook. You only need to perform this step once. Metric computation notebooks extract the metric’s definition from these tables.
You can then query the MetricsDefinitions table to view the metric definitions. For each metric, you can see the metric properties:
- metric name
- measure
- dimensions
- filters
- sustainability area
You can also query the MetricsLabels table to explore the metrics by labels, such as Reporting standard and Disclosure data point.
You can then explore the Prebuilt metrics library to determine the aggregate dataset to populate for computing the respective prebuilt metric.
Refer to Generate aggregate tables to discover the respective ESG data model tables and the attributes to populate for generating the aggregate tables.
Ingest, transform, and load the transformed data into the ESG data model tables in the ProcessedESGData_LH lakehouse deployed as part of the ESG data estate capability in the same workspace.
Authenticate the prebuilt semantic models (DatasetForMetricsMeasures and DatasetForMetricsDashboard) used in the metric computation by creating a connection. You only need to perform this step once.
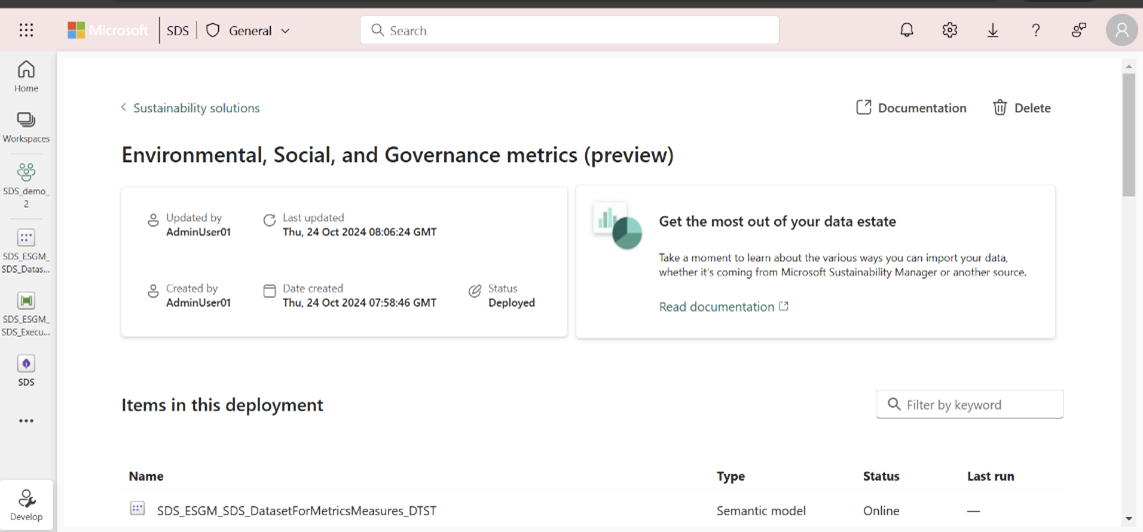
Select the DatasetForMetricsMeasures_DTST semantic model from the managed capability page to open the semantic model. Select Settings from the File menu. You can also open the item from the workspace page.
Select Gateway and cloud connections, and then select Create a new connection from the Cloud connections dropdown box. A New connection side panel opens.

In the New connection side panel, enter the connection name, enter OAuth 2.0 for the authentication method, edit the credentials, and select Create.
Select the created connection in the Gateway and Cloud connections section.
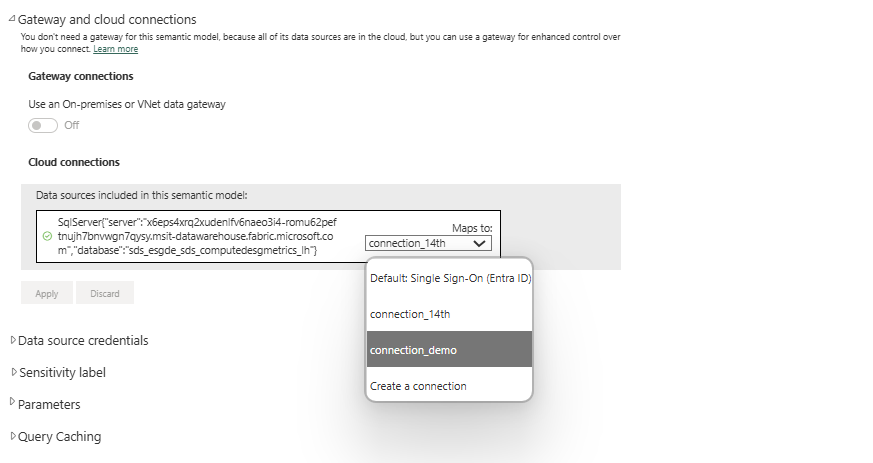
In the same way, set up a connection for the DatasetForMetricsDashboard_DTST semantic model. Open the semantic model from the workspace page, select Settings from the File menu, and then follow the same steps you followed for DatasetForMetricsMeasures_DTST.
Use Apache Spark runtime 1.3 (Spark 3.5, Delta 3.2) for running the prebuilt notebooks and pipelines.
If you're using the ExecuteComputationForMetrics_DTPL pipeline to compute metrics, then you also need to peform these steps:
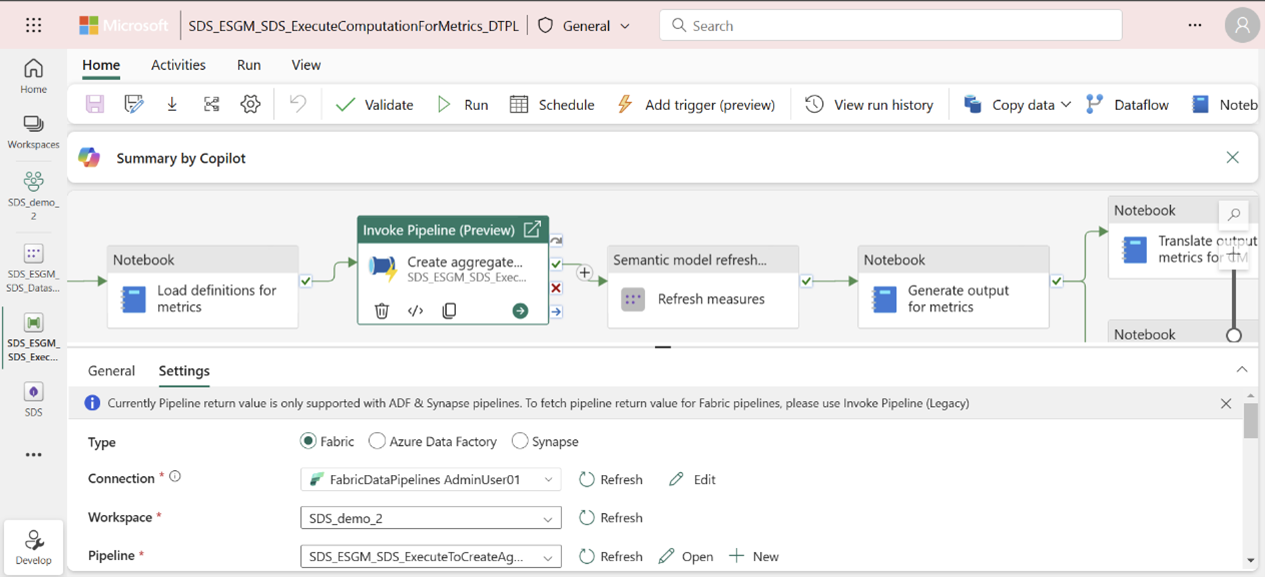
Create a connection to authenticate the Create aggregate tables activity of the pipeline to use the GenerateAggregateForMetrics pipeline:
In the same way, authenticate by setting up connections for refresh measures and refresh metrics for the dashboard activities of the pipeline:
Explore with demo data
If you're exploring the capability with demo data and want to just view the output of all the metrics, then you can run the ExecuteComputationForMetrics_DTPL pipeline. This pipeline provides an end-to-end experience from loading the demo data into the ProcessedESGData_LH lakehouse to computing the prebuilt metrics. To learn more about how to set up demo data, go to Set up demo data.
Before running the pipeline, ensure you followed steps #3-5 in the Prerequisites section.
Then create a connection to authenticate the Create aggregate tables activity of the pipeline to use the GenerateAggregateForMetrics pipeline:
Open the ExecuteComputationForMetrics_DTPL pipeline from the managed capability or workspace page.
Select the Create aggregate tables pipeline activity, and then select Settings to set up a connection.
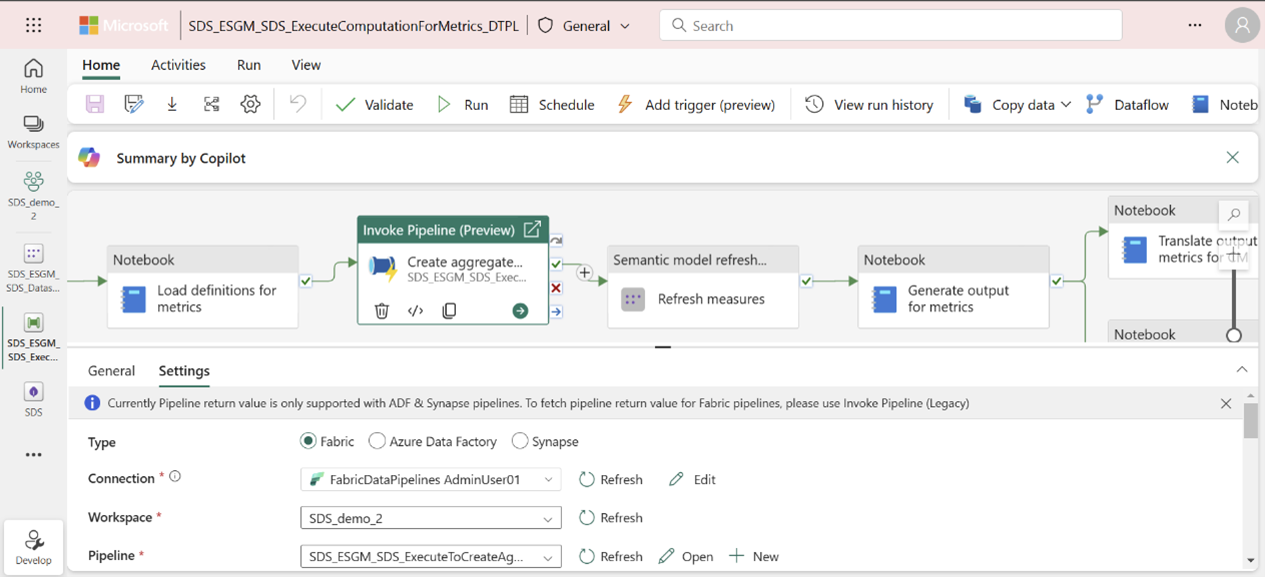
In the same way, authenticate by setting up connections for Refresh measures and Refresh metrics for the dashboard activities of the pipeline. Select the activity, select Settings, and then select a connection from the Connection attribute.
Note
These connection setup steps are one-time and aren't necessary for subsequent pipeline runs.
After you complete these steps, select Run to run the pipeline. You can monitor the pipeline by selecting the View run history button.
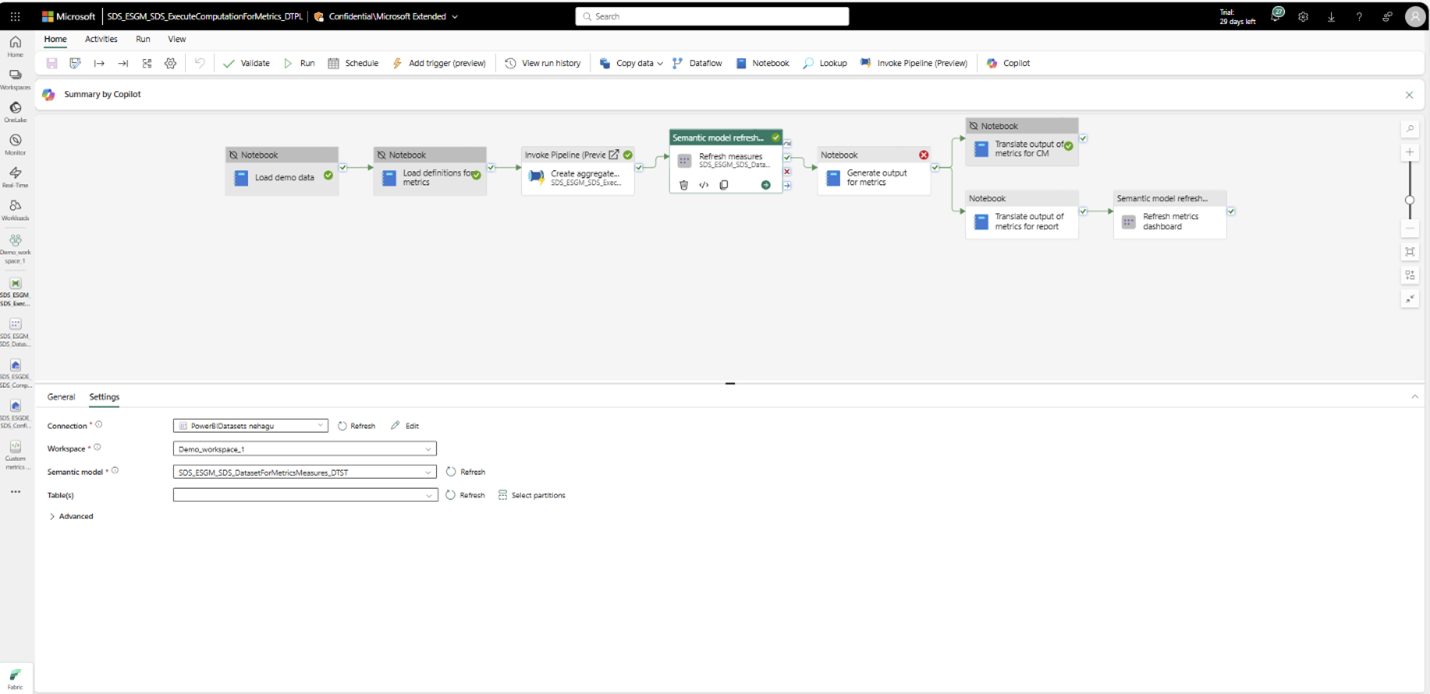
This pipeline performs these activities:
Load demo data: Loads the demo data that comes with the ESG data estate capability into the ProcessedESGData_LH lakehouse.
Note
If you mapped your source data in the processedESGData lakehouse then you can deactivate this activity before running the pipeline for computing metrics.
Load metric definitions: Loads the metric definitions contained in metrics_definitions_config.json to the MetricsDefinitions table in ComputedESGMetrics_LH. This table is used for fetching the metric details like computation logic, metric name, and sustainability area.
Note
This activity only needs to be performed once. After the prebuilt metric definitions are loaded, you can deactivate this pipeline activity for subsequent pipeline runs, unless metric definitions are updated in the metrics_definitions_config.json file.
Refresh the measures semantic model by following step #2 in Generate aggregate tables.
Translate metrics output for Compliance Manager consumption.
Translate metrics output for prebuilt Power BI dashboard consumption.
Note
If you want to run a specific activity of the pipeline, you can deactivate the other activities. For more information, go to Deactivate an activity.
Compute metrics data
To compute the ESG metrics, follow the instructions in these articles:
