Consume metrics data
Important
Some or all of this functionality is available as part of a preview release. The content and the functionality are subject to change.
After the metrics output data is computed, you can use the data in various downstream applications or systems.
Prerequisites
- The ComputedESGMetrics table with required metrics data should be generated in the ComputedESGMetrics_LH lakehouse.
These consumption scenarios are supported by default in the environmental, social, and governance (ESG) metrics capability.
Visualize and analyze metrics data
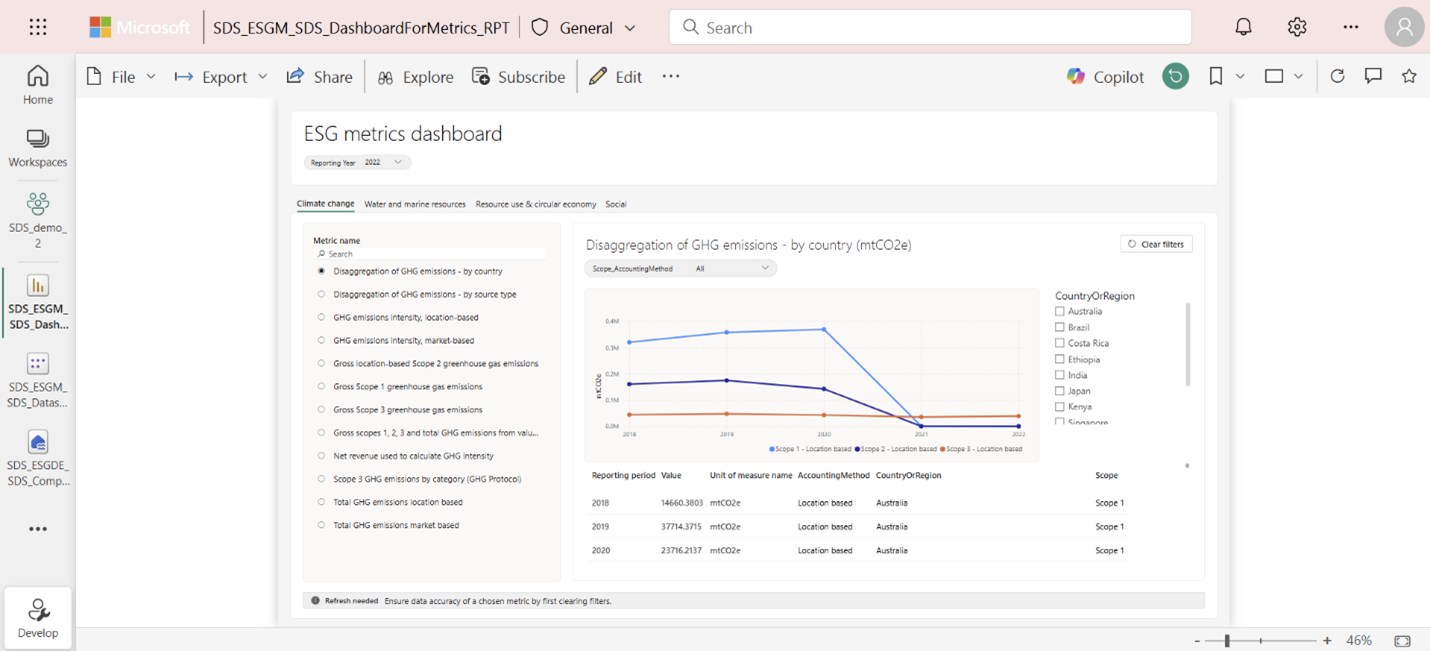
You can use the prebuilt Power BI dashboard (DashboardForMetrics_RPT) to visualize computed metrics data for prebuilt metrics and perform year on year comparison. You can also extend this dashboard to visualize custom metrics. For more information, go to Create custom metrics.
The prebuilt Power BI dashboard can support these scenarios:
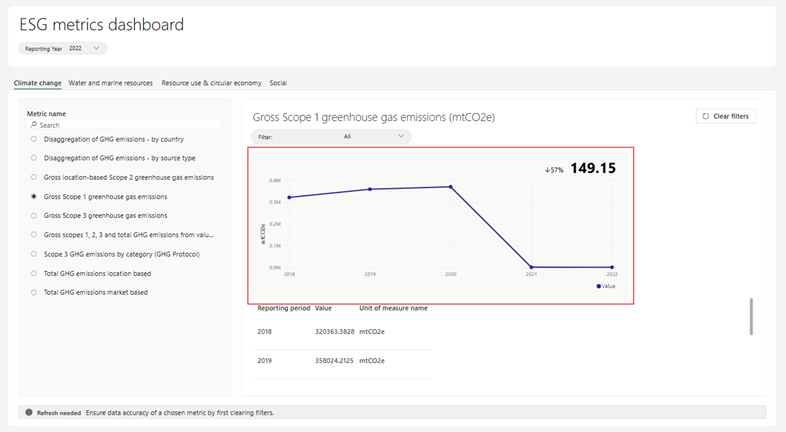
Visualize a metric value against reporting period dimension using a line graph in Power BI.
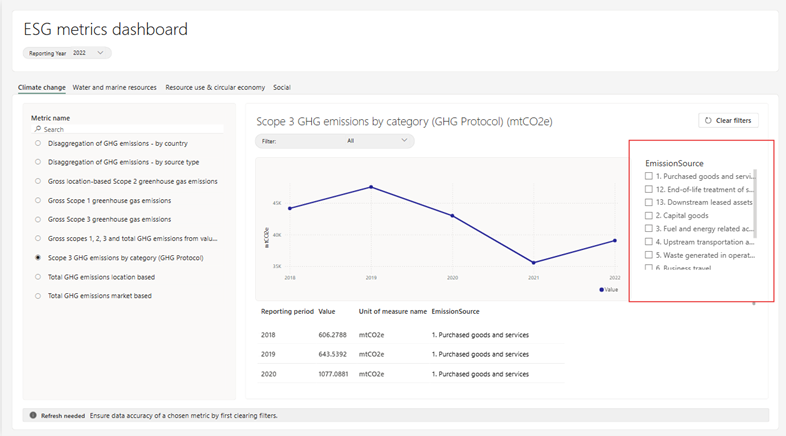
Slice the value for another dimension, such as CountryOrRegion, using the vertical checkbox slicer of Power BI.
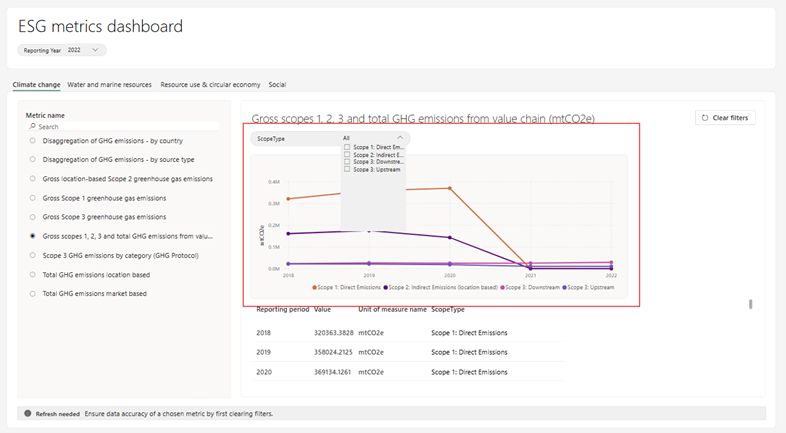
Filter the values for another dimension of the metric using the basic filter of Power BI.
Note
The filtered values of the dimension appear as multiple lines on the line graph.
To view the metrics in the prebuilt dashboard, follow these steps:
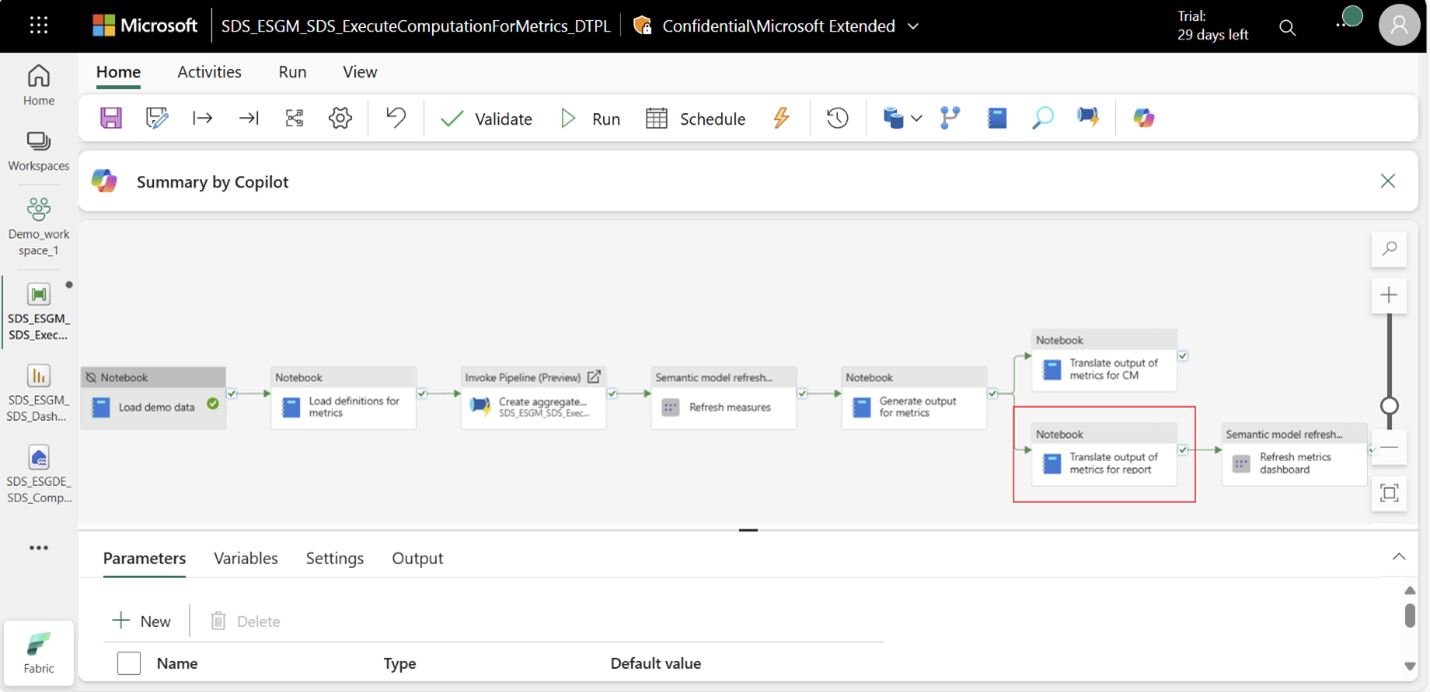
Run the Translate output for metrics for report activity in the ExecuteComputationForMetrics_DPTL pipeline or directly run the TranslateMetricsOutputForReport_INTB notebook. This action transforms all the metrics data in the ComputedESGMetrics table to the format consumable by the prebuilt dashboard. After the activity runs, it should create the ComputedESGMetricsForDashboard table in the ComputedESGMetrics_LH lakehouse.
The ComputedESGMetricsForDashboard table contains metrics data in a form consumable by the prebuilt Power BI dashboard, as shown in this table.
Column name Description MetricId Unique identifier of the metric. Denotes the metric for which data is generated. It's a foreign key to the MetricsDefinitions table. Index - MetricName The name of the metric. Used to show the list of metrics in the Power BI dashboard. ReportingPeriod The reporting period (year) for which the metric value is generated. UnitOfMeasureName Unit of measure for the metric value. For example, mtCO2e for emission values. Value Metric’s value for the specific ReportingPeriod and DimensionValue. FilterTitle Dimension of the metric on which the basic filter is available. Filter Stores the values corresponding to the dimension specified in FilterTitle. Dimension Stores the values corresponding to the dimension specified in DimensionTitle. DimensionTitle Dimension of the metric on which the vertical checkbox slicer is available. Refresh the semantic model (DatasetForMetricsDashboard_DTST) for the Power BI dashboard. The first time, you need to create a connection and authenticate:
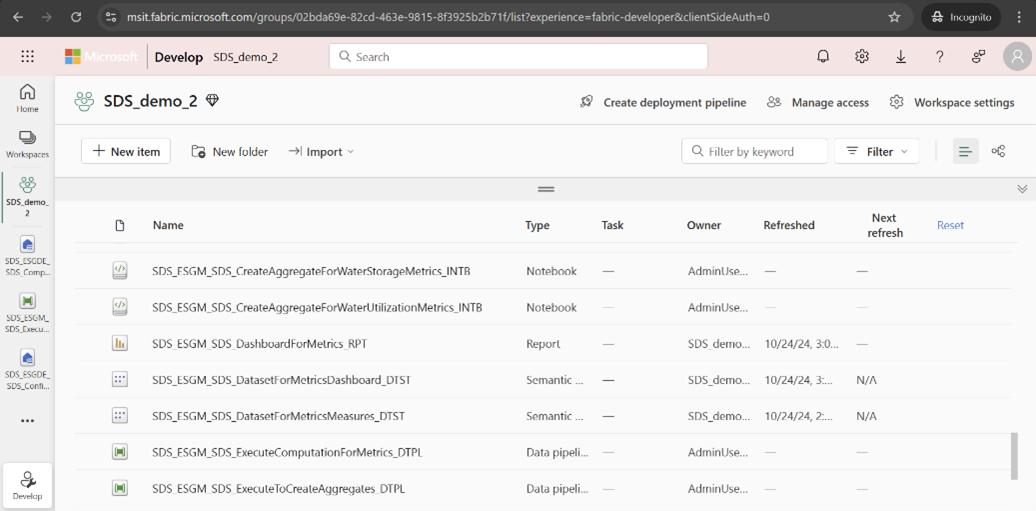
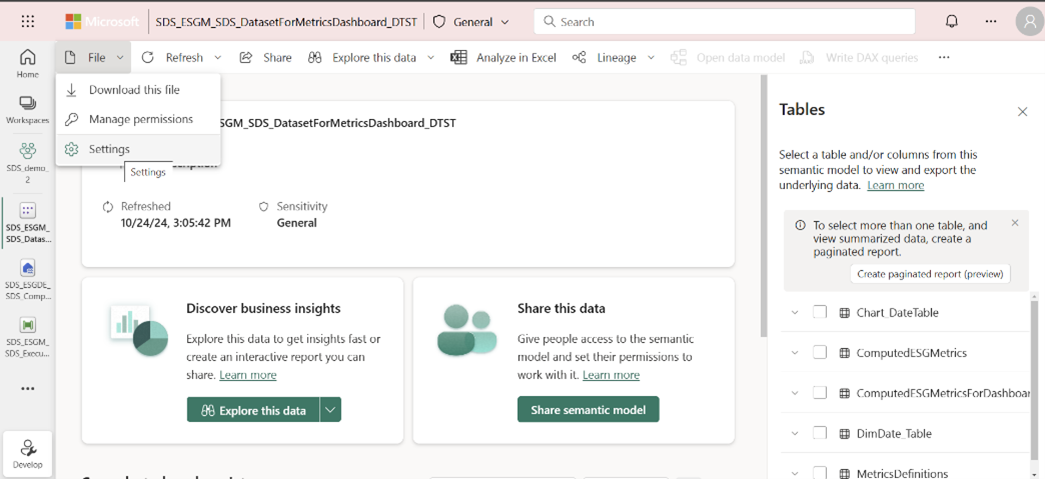
Open the semantic model from the managed capability or the workspace page.
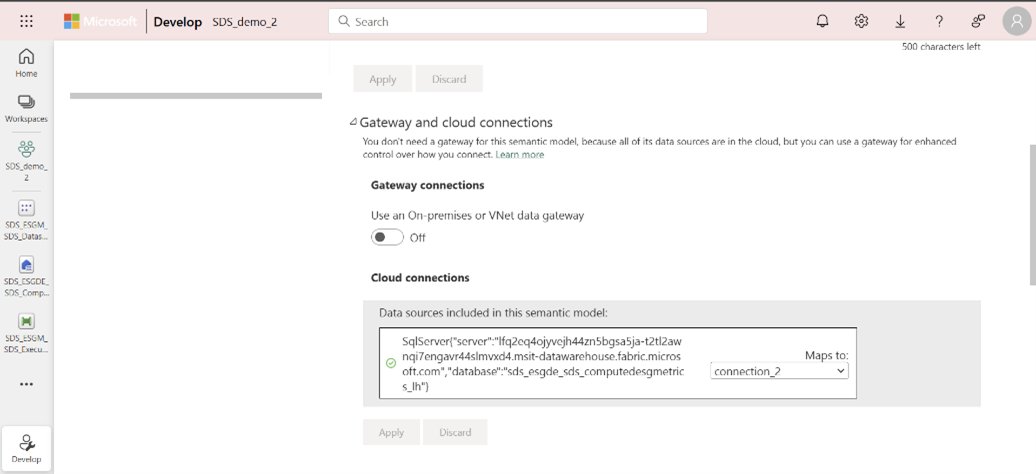
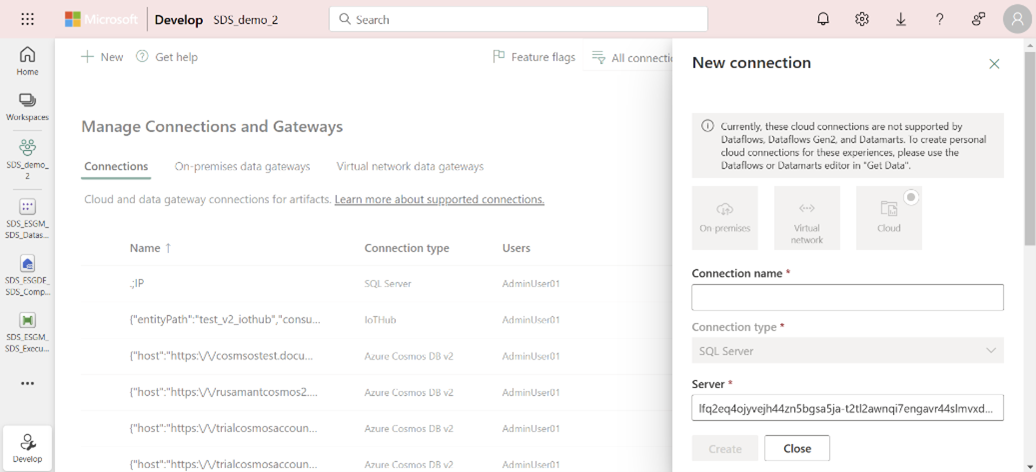
From the File menu, go to Settings. Select Gateway and cloud connections, and then select Create connection. If you created a semantic model connection earlier, you can select that from the dropdown.
In the New connection side panel, provide connection name, set authentication method as OAuth 2.0, edit the credentials, and select Create.
Select the created connection in the Gateway and cloud connections section.
Refresh the semantic model by selecting Refresh now from the Refresh menu on the semantic model page, or run the Refresh metrics for dashboard activity in the ExecuteComputationForMetrics pipeline.
If you want to refresh by running the Refresh metrics for dashboard activity, then for the first time you run the activity, you need to set up another connection in the pipeline. Select the activity and select Setting. In the popup, you can select any existing connection from the dropdown or create a new one if no connection exists.
After you set up the connection, you can run the Refresh metrics for dashboard activity.
When the semantic model refreshes, open the dashboard by selecting the DashboardForMetrics_RPT item from the managed capability or workspace list view page.
Important points about the prebuilt dashboard
Metrics for which data is generated appear in the list of metrics on the left on the dashboard.
The dashboard has four tabs based on the sustainability area of the prebuilt metrics.
For each metric, you can view the line chart and the metrics data in the form of the table.
If a metric has other dimensions like emission source or country/region, then those dimensions come up as slicer on the right side or filter above the chart. The filter is used for nonadditive dimensions. In such cases, the filter values shown up as multiple lines on the line graph.
Based on the Reporting year selected at the top right corner of the dashboard, the line graph shows data for the selected year and previous five years. IF data isn't present for a specific year, that year isn't shown on the X axis.
Important
For a specific metric, if you selected a filter or slicer, remember to clear the filters before navigating to the next metric so that the selected filters or slicers are reset. Without this step, the data for the subsequent metric doesn’t appear accurately.
Publish metrics data for auditing in Compliance Manager
You can integrate the computed metrics data to a Corporate Sustainability Reporting Directive (CSRD) assessment in Microsoft Purview Compliance Manager using the Sustainability data connector. For more information about the CSRD template in Compliance Manager, go to Overview of CSRD template. For more information about the connector, go to Configure a Purview connector.
For the connector to consume the metrics data, the data needs to be transformed accordingly using the Translate metrics data for CM activity in the ExecuteComputationOfMetrics pipeline or directly running the TranslateMetricsDataForCM notebook. This notebook performs these tasks:
It filters the metrics data for specific reporting year and set of comparative years. This filtering allows you to filter and send data only for required years to the CSRD assessment in Compliance Manager. Parameters to specify in the pipeline activity or in the notebook:
reporting_period: Specify the reporting year for which data needs to be sent. Default value is 2023.
num_previous_years: Specify the number of prior years from reporting_period for which data needs to be sent as comparative years data. Default value is 0.
metric_names: Specify the list of metric names that need to be translated.
Note
If you specify both metric_names and sustainability_areas, then the metric_names parameter overrides. The default value is set to None, so all metrics present in the ComputedESGMetrics table are considered for translation.
sustainability_areas: If you want to translate all the computed metrics for certain sustainability areas, then you can specify the list of sustainability areas using this parameter. Default value is None, so all the metrics present in the ComputedESGMetrics table across sustainability areas are considered for translation.
Note
The parameter value is case-sensitive.
It maps the metric to the corresponding improvement action name in Compliance Manager. The metric’s data is mapped to the right improvement action in the CSRD assessment in Compliance Manager. The mapping of the metric name to the improvement action is available in the translate_metrics_output_for_CM_config.json file in the ESGMetrics/Config folder in the configAndDemoData_LH lakehouse. For the prebuilt metrics, the mapping is predefined. You can update the mapping as required.
It maps the column display names for the metric column names, so that user-friendly column names are visible in the CSRD assessment in Compliance Manager. The column display names are predefined for the prebuilt metrics in the translate_metrics_output_for_CM_config.json file in the ESGMetrics/Config folder in the configAndDemoData_LH lakehouse. You can update the labels as required.
After the notebook runs successfully, it generates these items in the Files folder of the ComputedESGMetrics_LH lakehouse:
ReportingData folder: Generated the first time the notebook is run. In subsequent executions, the files in this folder are updated.
Reporting year folder: Denotes the reporting period for which the transformed data is generated, such as 2023.
Metric folders: Within the Reporting year folder, for each metric that was supposed to be transformed, a metric folder is created and json files for the transformed metric data are available within the metric folder.
Metadata.json file: For each reporting year, a single metadata.json file is generated. This file contains the metadata required for the connector to interpret the metrics data and map it to the Compliance Manager specific schema. The metadata contains:
- A mapping of metrics to the disclosure datapoint/improvement action name in Compliance Manager
- Column display names
- Timestamp when the metric data was published
- Reporting year.
Note
After the metrics data is published in a format consumable by Microsoft Purview Compliance Manager, you can visualize the metrics data in Compliance Manager by following the steps in Visualize CSRD disclosure metrics data.
You can use similar patterns for publishing data for other downstream applications. You can use Fabric native capabilities like Onelake APIs for accessing the metrics data stored in a lakehouse from applications external to Fabric.
