Note
Access to this page requires authorization. You can try signing in or changing directories.
Access to this page requires authorization. You can try changing directories.
Important
This content is archived and is not being updated. For the latest documentation, go to What's new in Dynamics 365 Customer Insights - Journeys. For the latest release plans, go to Dynamics 365, Power Platform, and Cloud for Industry release plans.
Important
Some of the functionality described in this release plan has not been released. Delivery timelines may change and projected functionality may not be released (see Microsoft policy). Learn more: What's new and planned
| Enabled for | Public preview | Early access | General availability |
|---|---|---|---|
| Admins, makers, marketers, or analysts, automatically |  Oct 1, 2024
 |
- | Jun 2025 |
Business value
Understanding the effectiveness of email campaigns can be complex, particularly when information and links are abundant. Gaining clarity on which areas or links captivate your audience and drive them to act is crucial for refining the user experience and boosting email performance.
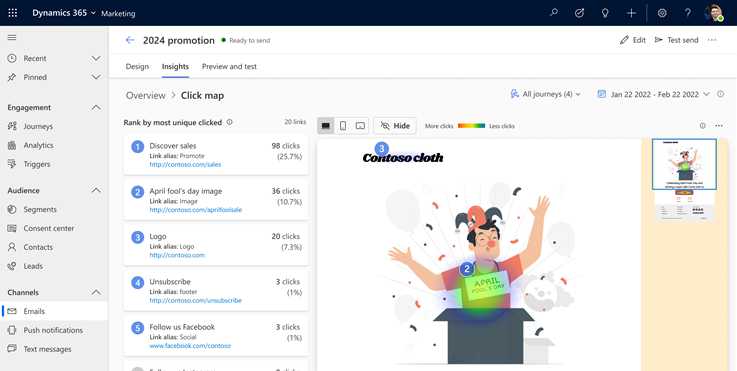
Real-time journeys email insights now offer a clear view of your audience's preferences by illustrating their interactions within your emails. This immediate visual feedback highlights the content that resonates the most, empowering you to adjust your messaging for heightened impact and better conversion rates.
Heatmap also supports email variations. By leveraging these insights, you can understand which email variation captivates your audience and use it to personalize and optimize your upcoming campaigns or focus your efforts on the variations that yield the best results, ultimately driving better results for your business.
Feature details
Deep-dive into customer interactions with actionable insights that you can leverage to refine your email strategy. Tweak content placement, layout, and design to elevate user engagement.

- Get a fast, visual way to understand engagement based on your email design.
- Understand which email area and links get the most and the least engagement by viewing the click-through rate (CTR), total clicks, and unique clicks.
- Filter the heatmap based on the email version, journey version, and date.
- Toggle between all devices, desktop, and other devices to visualize results for different devices (all devices view is only available when the email sections are consistent across devices).
You can even select the email variation you want to visualize.

To enable the heatmap, go to Settings > Feature switches > Email editor and switch on the Email Clickmap toggle.

Scenario: Contoso recently launched a new email campaign to promote their latest smartwatch. They crafted three variations of the email, each tailored to different customer segments: VIPs, fitness enthusiasts, and casual athletes. By using the heatmap feature, they were able to analyze the performance of each variation. The heatmap revealed that the "Get Discount" button in the email sent to fitness enthusiasts had the highest click-through rate. Additionally, images showcasing the new watch itself performed better than lifestyle images. Armed with these insights, Contoso optimized their email content and design, focusing on the elements that drove the most engagement, and offered an additional discount to the low-performing segments. This data-driven approach enabled them to create more effective campaigns and achieve better results.
Additional resources
Email insights (docs)