Email insights
Email insights provide a deep dive into how your audience interacts with your emails over time and allow you to track the trajectory of delivery rates, open rates, and click-through rates with precision. Beyond delivery and engagement trends, you can evaluate essential email KPIs and access comprehensive delivery and interaction details.
To view email insights, go to Real-time journeys > Email > Insights tab.
Note
Email insights display interaction data for the last 12 months only. However, all historical interaction data is still retained in the data storage.
Email delivery and interactions
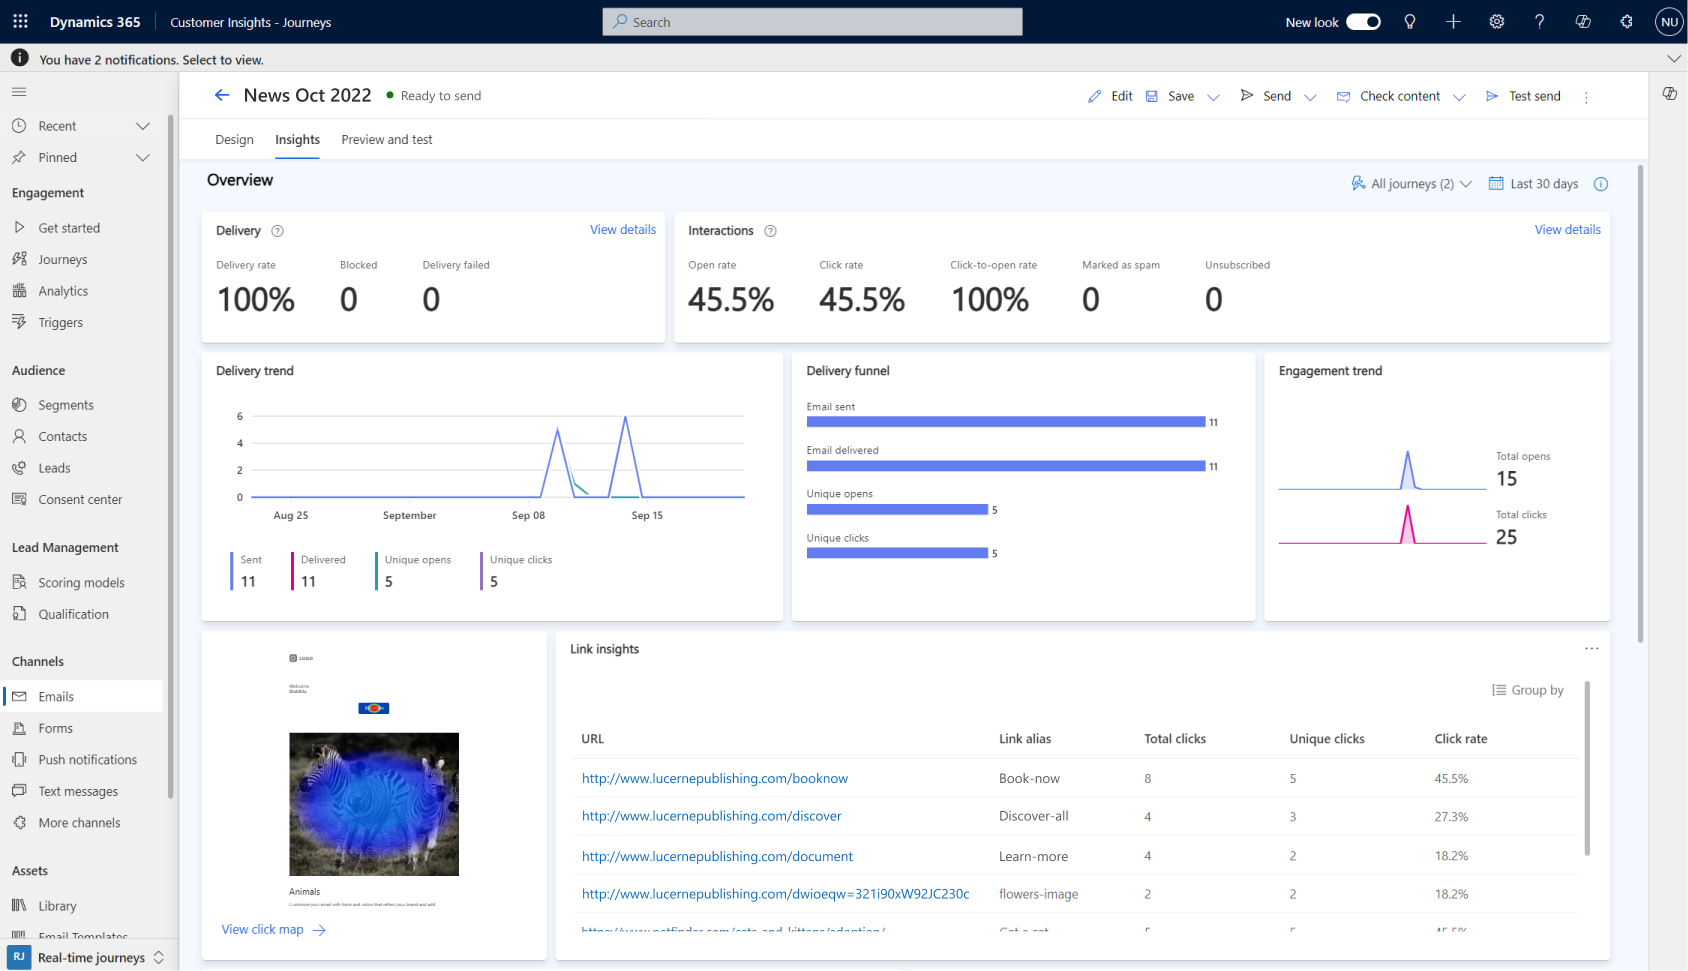
- Delivery KPIs: Gain insights into the delivery rate, number of blocks, and delivery failures for the selected message.
- Interactions KPIs: Evaluate the open rate, click rate, click-to-open rate, number of messages marked as spam, and the count of unsubscriptions related to the selected message.
- Delivery trend and delivery funnel: Explore the trends and funnel of sent and delivered interactions, along with unique opens and unique clicks specific to the selected email.
- Engagement trend: Examine the trends for total opens and clicks, providing a comprehensive understanding of the level of engagement associated with the selected email.
Device type and user agents' analysis
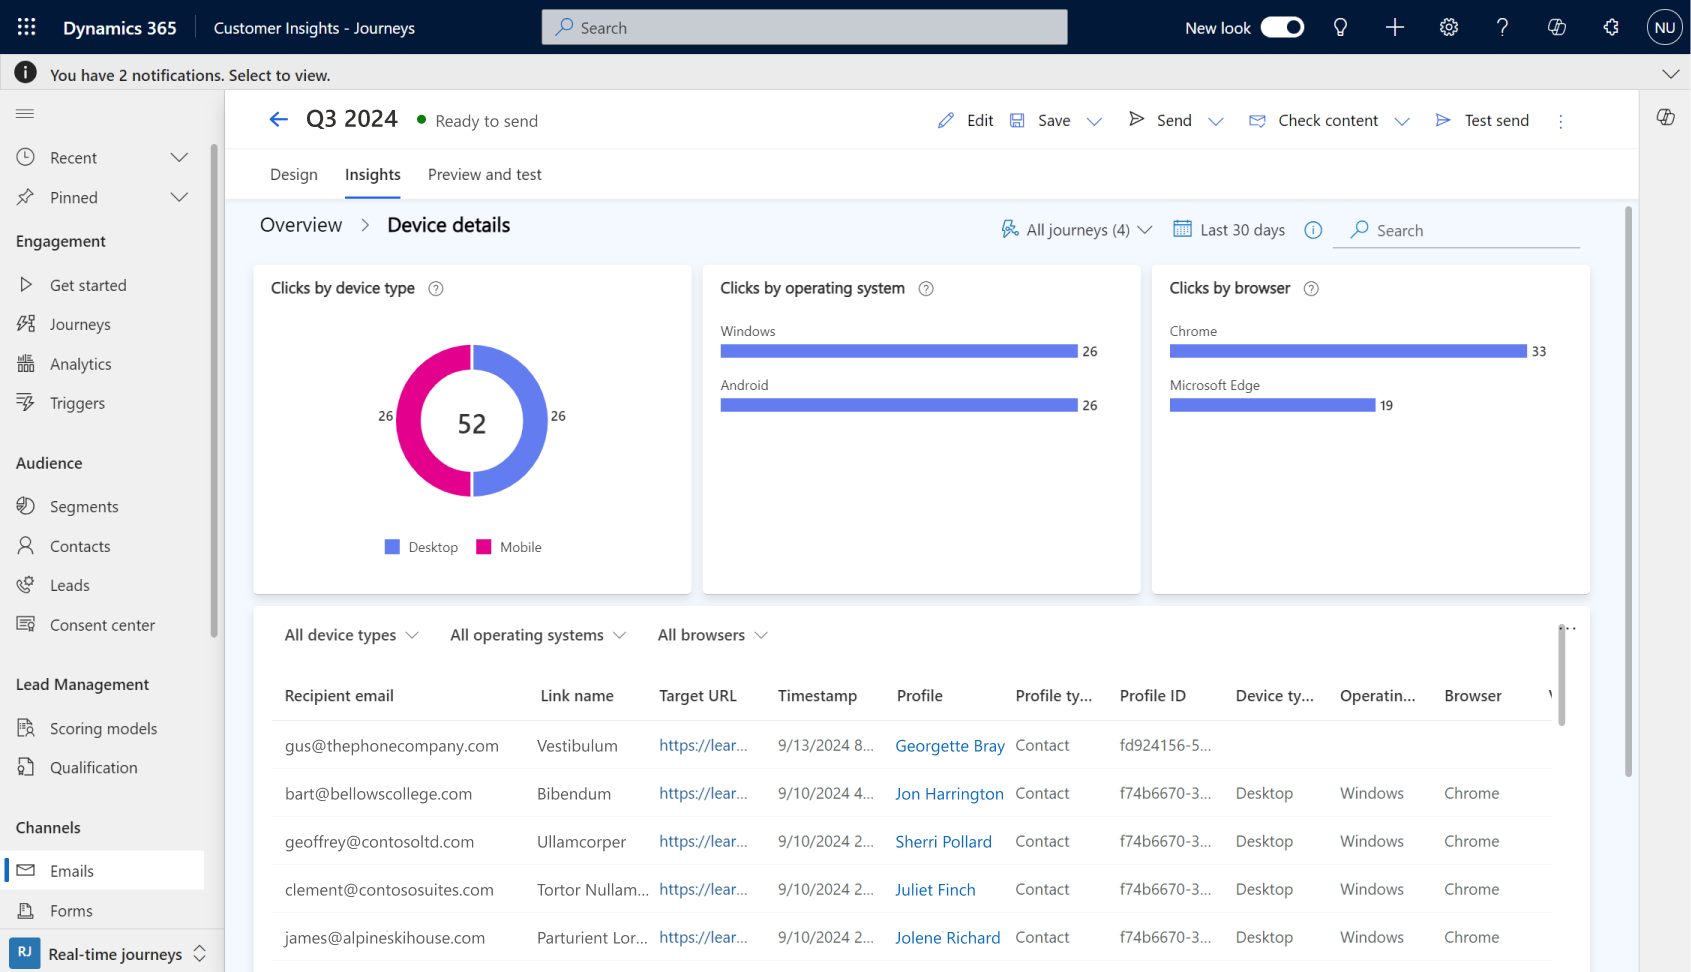
Gain a deeper understanding of the various device types, email clients, operating systems, and browsers that customers utilize to engage with your emails. Tailor your email design to align with the devices and user agents most used by your audience and ensure seamless readability for your messages.
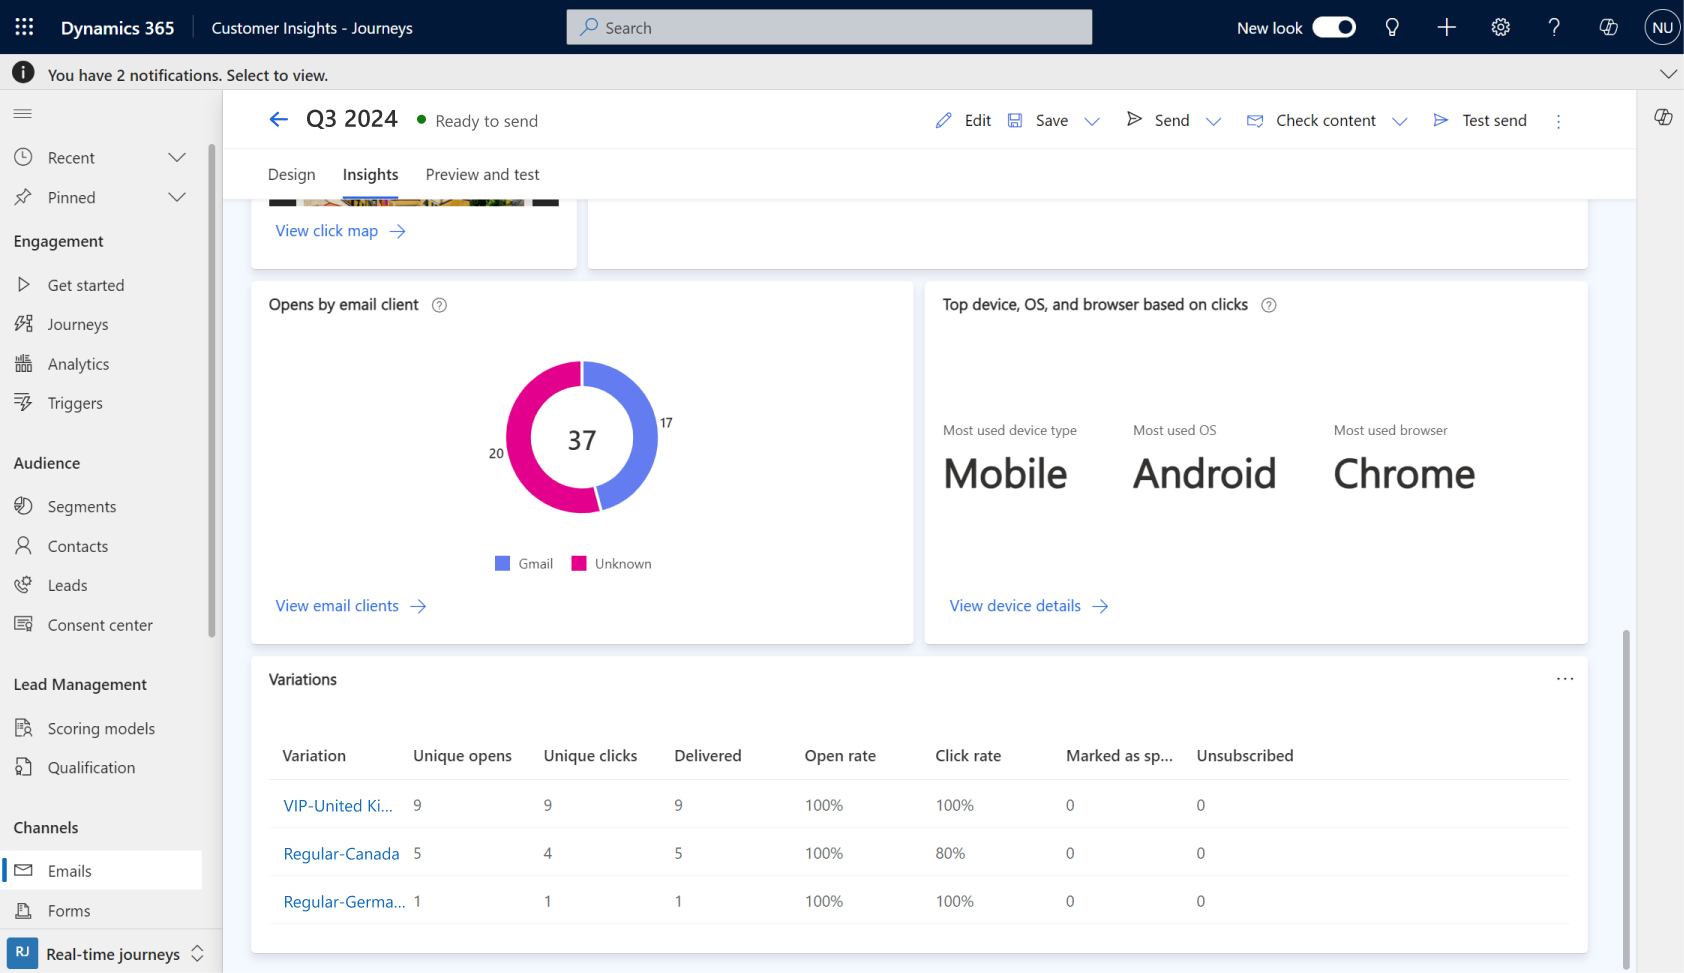
- Email clients by opens: The detection of email clients relies on email opens and is dependent on the response received from the email provider. Certain email clients, like Apple Mail, have privacy protections in place that may prevent detection.
- Browsers, operating systems, and device types by clicks: The detection of device types, browsers, and operating systems is dependent on email clicks. Not all email clients, device types, browsers, and operating systems can be detected.
User agents are labeled as:
- "Unknown" when the agent couldn't be detected.
- "Other" when the agent can be detected but is non-categorized yet, such as a local provider.
Note
- Data related to user agents may be partial or missing depending on when your journey was running, especially if it was active before August 2024.
- If you're building custom reports, you can learn more about the list of Globally Unique Identifiers (GUIDs) as they appear in real-time marketing storage (accessible using Microsoft Fabric) to map data on email clients, device types, browsers, and operating systems: Map GUIDs to email clients, browsers, operating systems, and device types
Link insights
Unlock valuable insights into your email's URL engagement and make data-driven decisions to enhance the effectiveness of your email marketing campaigns with link insights. Using link insights, you can understand the performance of each link within your email campaigns and identify the top-performing links based on total clicks, unique clicks, and click rate. Get more clarity by grouping your links by URL or link alias. Learn more: Edit email components in a live journey
Note
Link insights displays data for emails (with links) and journeys created after September 2024.
Preview: Click map
Important
A preview feature is a feature that is not complete, but is made available before it’s officially in a release so customers can get early access and provide feedback. Preview features aren’t meant for production use and may have limited or restricted functionality.
Microsoft doesn't provide support for this preview feature. Microsoft Dynamics 365 Technical Support won’t be able to help you with issues or questions. Preview features aren’t meant for production use, especially to process personal data or other data that are subject to legal or regulatory compliance requirements.
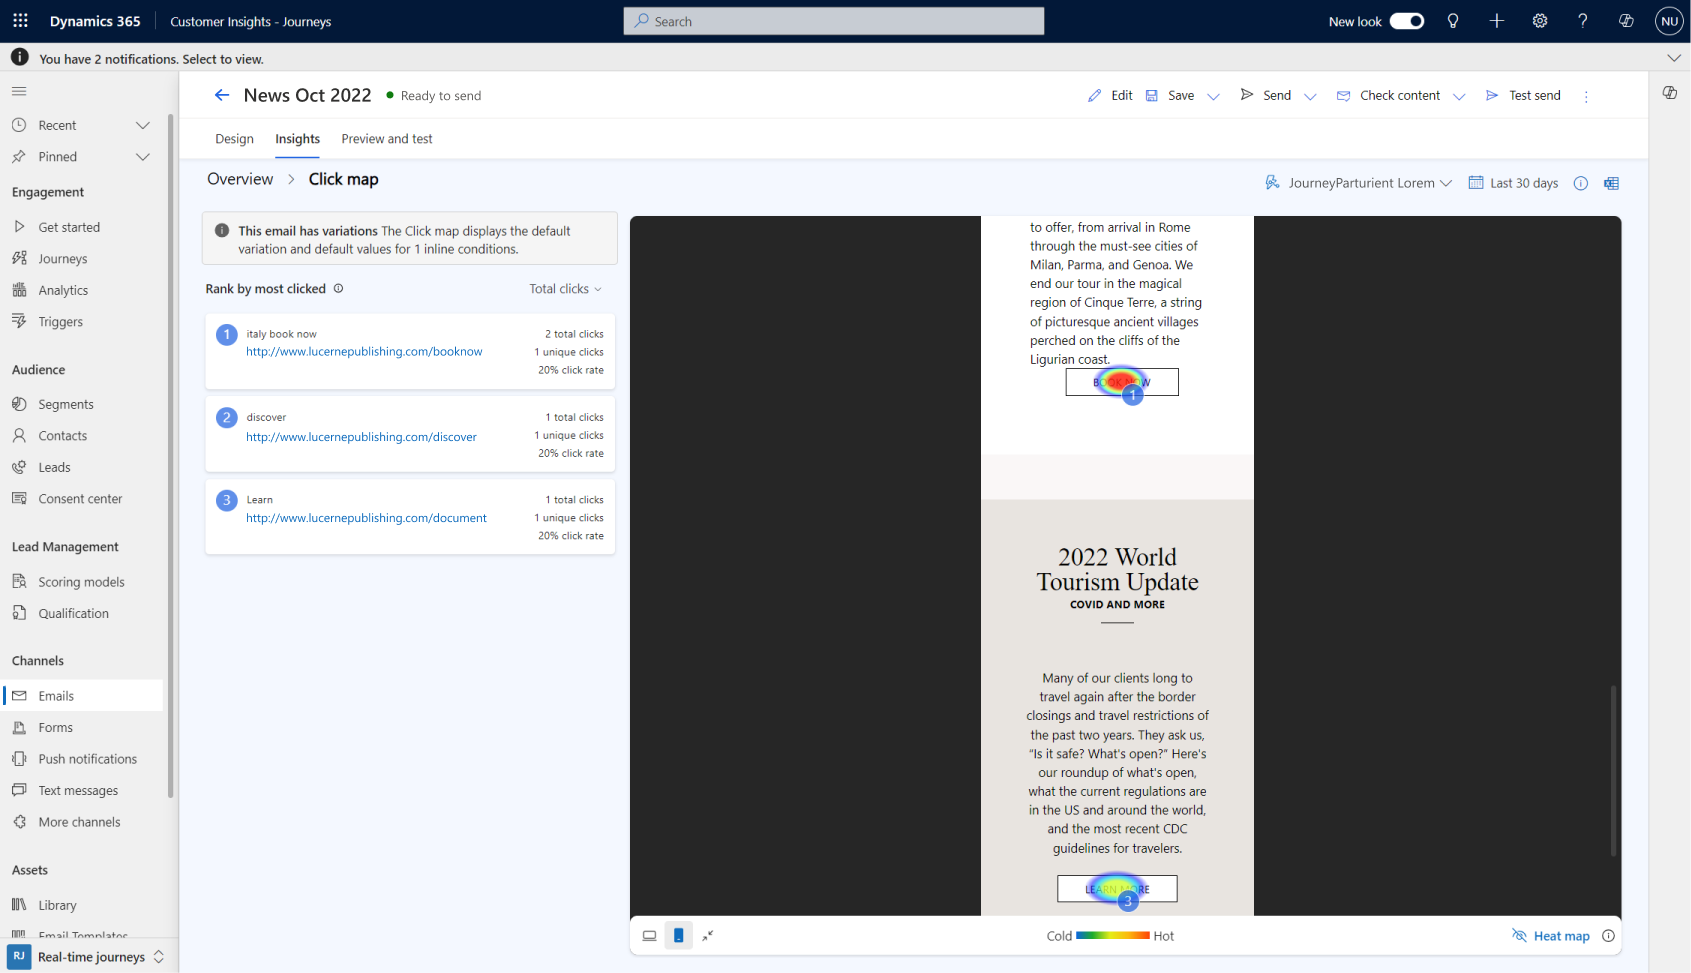
Click map is a fast and visual way to understand customer engagement based on your email design. At a glance, the heatmap colors and link ranking display the most interacted areas. Choose to display or hide the heatmap for better visualization.
- Gain deeper insights into which links receive the most and least engagement by filtering the list of links based on click-through rate (CTR), total clicks, and unique clicks.
- Toggle between desktop or mobile (includes any other types of devices) to visualize insights on interactions for each device type.
- Select a link within the list to see its location on the email design or hover over your links on the design to display the interactions data. Links with zero interactions aren't included in the list; they only display by hovering on the email design.
- For reporting purposes, you can zoom into specific parts of your email or zoom out to take a screenshot of the full click map. You can also download an Excel list of the click map insights.
Using the click map insights, you can optimize your content placement, layout, and design, to boost customer engagement.
Note
- Click map is in preview. To enable the click map go to Settings > Feature Switches > Email Clickmap.
- The click map only displays the interactions and design for the latest email version created.
- For the click map feature to be displayed, the journey must have been created after the feature release in October 2024.
- When adding older emails to your journey, to start displaying the click map, use live editing and update the email. The links included in your email will be updated and tracked for the new interactions.
- The click map might contain incomplete data or miss some data depending on when your journey and email content was created and running, especially if it was active before October 2024.
- For emails that contain variations (conditional content and in-line conditions), the click map only displays the design and interactions for the default variation.
Variation insights (Conditional content)
Gain valuable insights into key metrics such as unique opens, unique clicks, number of delivered messages, open rate, click rate, spam messages, and unsubscriptions for each variant, enabling you to identify what resonates best with your audience. Variation insights are visible only if an email contains conditional content.


