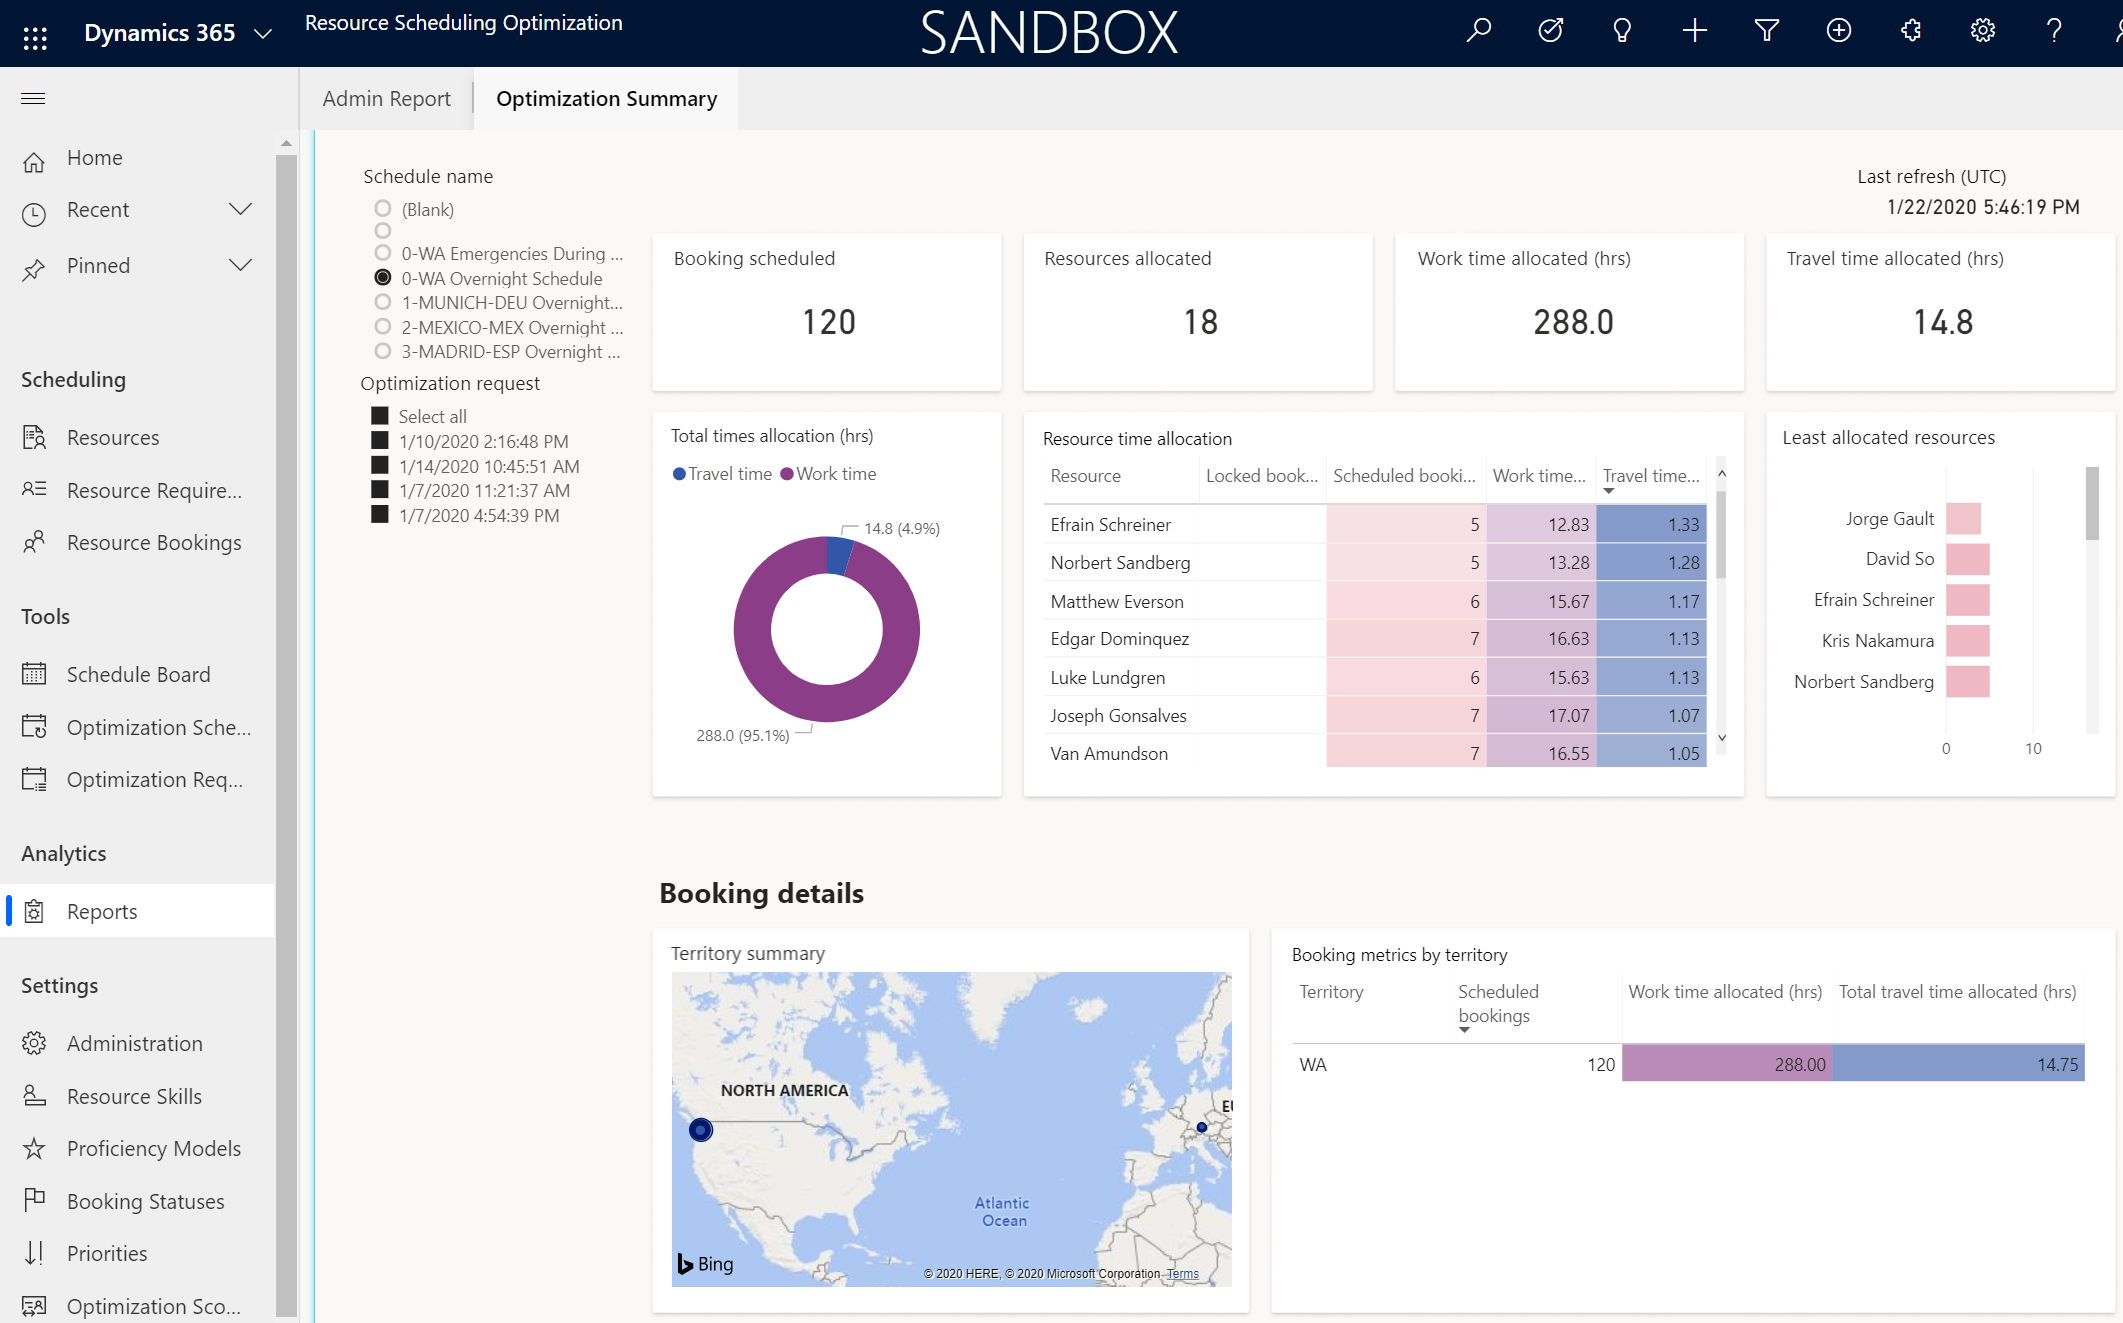
Optimization summary report
The optimization summary report in the Resource Scheduling Optimization Add-in analyzes automatically scheduled bookings and the effect they had on the business.
Tip
As an alternative, Dynamics 365 offers various ways to visualize your data in Power BI. One option is to use the built-in visualization tool within Dynamics 365 to quickly generate insights. Learn more: Visualize your data quickly.
For more customized reporting, you can build your own reports using the Dataverse connector for Power BI. You can create tailored visualizations based on your specific data needs. Learn more: Create a Power BI report using data from Dataverse.
You can also embed Power BI reports directly within Dynamics 365. Learn more: Embed a Power BI report.
Before you start
To run the report, the Resource Scheduling Optimization administrator needs to publish at least one optimization schedule.
Filters and slicers
- Schedule name: Name of the optimization schedule.
- Optimization request: List of jobs that ran to optimize schedules.
Report metrics
To access the admin report, open Resource Scheduling Optimization and go to Analytics > Reports.

Booking scheduled: Total number of bookings scheduled.
Resources allocated: Number of resources allocated.
Work time allocated (hrs.): The total work time of all allocated resources.
Travel time allocated (hrs.): Sum of the travel time of all allocated resources.
Total times allocation (hrs.): Distribution of work time and travel time in the scheduled bookings.
Resource time allocation: List of each resource's scheduled bookings, locked bookings, work time, and travel time. Overbooked resources are highlighted.
Least allocated resources: Ranks the resources by lowest usage to help dispatchers assign jobs on short notice.
Territory summary: Shows optimized territories on a map with the ability to drill down.
Booking metrics by territory: List of scheduled bookings, work time allocated, and travel time allocated for each territory.