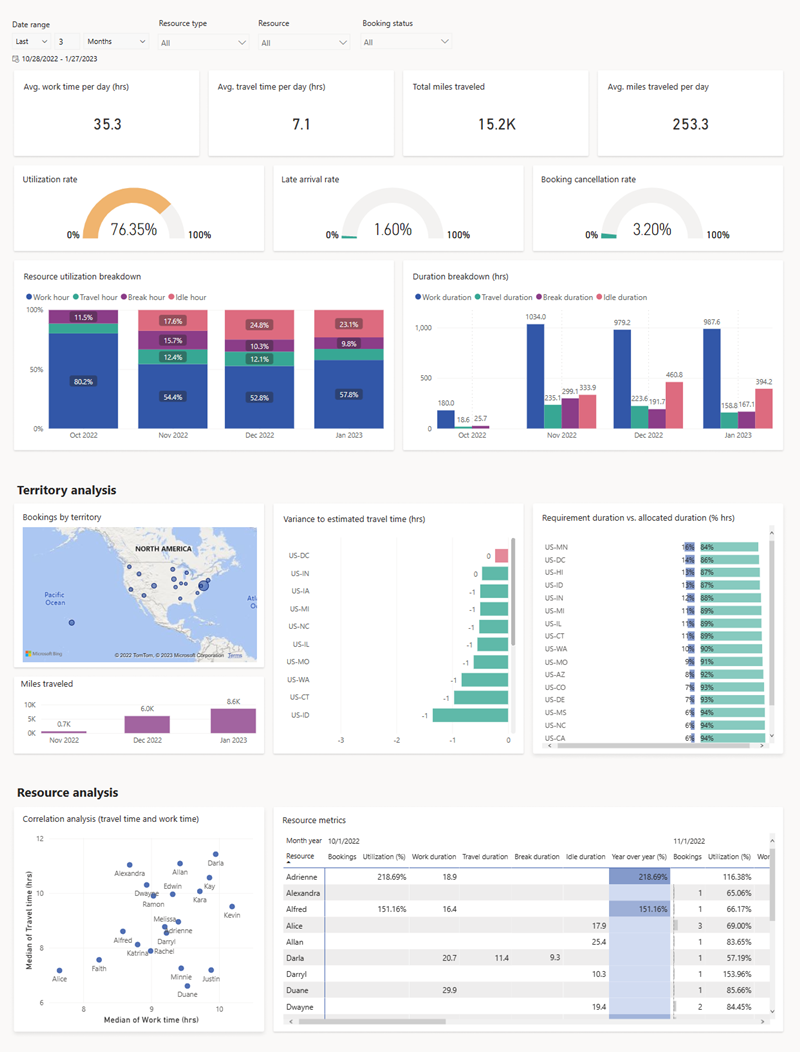
Resource and utilization report
Resource managers can use the resource and utilization report to gather information that helps them ensure efficient use of resources. They can monitor key information like time spent on bookings, allocation of bookings across territories, or how individual resources are allocated.
Tip
As an alternative, Dynamics 365 offers various ways to visualize your data in Power BI. One option is to use the built-in visualization tool within Dynamics 365 to quickly generate insights. Learn more: Visualize your data quickly.
For more customized reporting, you can build your own reports using the Dataverse connector for Power BI. You can create tailored visualizations based on your specific data needs. Learn more: Create a Power BI report using data from Dataverse.
You can also embed Power BI reports directly within Dynamics 365. Learn more: Embed a Power BI report.
Filters and slicers
- Date range: A relative date range.
- Resource type: The resource type set for a bookable resource.
- Resource: Active bookable resources.
- Booking status: Available Booking statuses.
Common metrics
- Number of days: Takes several factors into account. First, the system checks how many days a booking lasted and then determines how many of these days are considered work hours. For example, work days are defined as Monday to Friday and a booking starts Thursday and ends Monday. The resulting number of days is 3.
- Work, travel, and break time: Depends on the booking status. For scheduled bookings, the estimated duration is taken into account. For other booking statuses, such as in progress or completed, duration is calculated based on Booking Timestamp entity records. In other words, as soon as a technician starts working on a booking, reports consider the actual work duration.
Report metrics
To access the report, open the Field Service app, and go to Analytics and Insights > Reports.

Note
Visualizations adapt to the filters and the listed formulas don't mention them specifically.
Avg. work time per day (hrs.): Average number of hours per day that the selected resources worked on bookings in the selected time range.
Formula: (Total work time + Travel time) / Number of days
Avg. travel time per day (hrs.): Average number of hours per day that the selected resources spend traveling in the selected time range.
Formula: Actual travel duration / Number of days
Total miles traveled: Total miles traveled by the selected resources in the selected time range.
Formula: Sum of miles traveled of the bookable resource bookings.
Avg. miles traveled per day: Average number of miles traveled by the selected resources in the selected time range.
Formula: Sum of miles traveled / Number of days
Utilization rate: The percentage of time a resource spends on work and travel per available time on the calendar.
Formula: ((Total work time + Travel time) / (Configured work hours per day x Number of days)) x 100
Note
If the work hours aren't set on the calendar, the default is 24 hours.
Late arrival rate: The percentage of completed bookings where the technician arrived late.
Formula: (Number of bookable resource bookings with late arrival / Total number of completed bookings) x 100
Note
Being late is defined as arriving after the Time to Promise value. If Time to Promise isn't set, the Estimated arrival time is taken into account.
Booking cancellation rate: The percentage of bookings with a canceled status that had a status of in progress or completed before.
Formula: (Number of canceled bookable resource bookings / Total number of bookings) x 100
Resource utilization breakdown: Percentage of time on work, travel, break, and idle time. Each bar in the chart shows the relative percentage of duration types in stacked columns. It doesn't show overtime values of any duration types. Available hours by day are defined in the calendar for a resource.
Formula:
- Work hour = (Total work time / (Available hours per day x Number of days)) x 100
- Travel hour = (Actual travel time / (Available hours per day x Number of days)) x 100
- Break hour = (Break time / (Available hours per day x Number of days)) x 100
- Idle hour = (((Available hours per day x Number of days) - Work hour - Travel hour - Break hour) / (Available hours per day x Number of days))) x 100
Duration breakdown: Total work time, travel time, break time, and idle time. You can also drill in to the information to see specific information for in-progress jobs or completed jobs.
Bookings by territory: List of territories as defined in the bookings with the number of bookings in each territory.
Variance to estimated travel time: Variance between estimated travel times and actual travel times by territory.
Formula: (Sum of actual travel time - Sum of estimated travel time) / Number of bookings
Miles traveled: Shows the total miles traveled per month.
Requirement duration vs. allocated resource duration (% in hours): Gauge whether the total number of requirements in each territory is balanced with the total number of resources allocated to that territory. The resulting chart shows the percentage of the planned total duration versus the actual total duration.
Formula: ((Total work time + Estimated travel duration) + (Total work time + Actual travel duration) / (Total work time + Estimated or actual travel duration)) x 100
Correlation analysis (travel time and work time): Correlates each resource's travel time to work time and plots them in the matching quartile.
Resource metrics: Shows the breakdown of KPIs for each resource, including number of bookings, utilization percentage, work time, travel time, break time, and idle time. Year over year (%) compares the resource utilization of the selected year to the year before.