Manufacturing analytics
Businesses capture lots of data during daily activities that supports business intelligence (BI) for manufacturing, such as:
- Utilization
- Capacity
- Work center load
- Production time
- Production scrap
Business Central provides features to help you gather, analyze, and share your organization's manufacturing data:
- Power BI reports for manufacturing
- Ad-hoc analysis on lists
- Ad-hoc analysis of data in Excel (using Open in Excel)
- Built-in manufacturing analytics tools
- Built-in manufacturing reports
Each feature has its advantages and disadvantages, depending on the type of analysis you want to do and your role. To learn more, go to Analytics, business intelligence, and reporting overview.
This article introduces how you can use these analytical features to gain insights into your manufacturing processes.
Analytics needs in manufacturing
When you think about analytics in manufacturing, it might help to use a persona-based model that describes different needs at a high-level.
People in different roles have different needs when it comes to data, and they use data in different ways. For example, people in manufacturing interact with data differently than people in finance.
| Role | Data aggregation | Typical ways to consume data |
|---|---|---|
| COO / CFO / CEO | Performance data | KPIs, dashboards, financial reports |
| Plant Manager | Trends, summaries | Built-in managerial reports, ad-hoc analysis |
| Factory worker | Detailed data | Built-in operational reports, on-screen task data |
Using Power BI to monitor key performance indicators in manufacturing
A key performance indicator (KPI) is a measurable value that shows how effectively you’re meeting your goals. Businesses often use the following KPIs to monitor production performance:
- Capacity used (hours), either current or historical
- Utilization percentage, either current or historical
- Work center load percentage, allocated time (hours), or available capacity (hours)
- Cost amount variance or deviation percentage
These KPIs (and more) are available for manufacturing in the Power BI Manufacturing app for Business Central.
To learn more, go to Manufacturing KPIs
Reports in the Power BI Manufacturing app
The following table describes how you can use the reports in the Power BI Manufacturing app.
| To... | Open in Business Central (CTRL+select) | Learn more |
|---|---|---|
| Analyze the current use of work centers and optimize production processes. | Current Utilization | About Current Utilization |
| Analyze historical use of work centers and identify trends and patterns and plan for future capacity needs. | Historical Utilization | About Historical Utilization |
| Gain insights into work center load and capacity and find bottlenecks and balance production across work centers. | Work Center Load | About Work Center Load |
| Track allocated hours for each work center to understand workloads. | Allocated Hours | About Allocated Hours |
| Monitor expected capacity based on production orders to plan for future capacity needs. | Expected Capacity Need | About Expected Capacity Need |
| Analyze finished production orders by item and work centers and gain insights into important metrics of production orders. | Finished Production Order Breakdown | About Finished Production Order Breakdown |
| Track consumption variance for each item and production order and improve production efficiency. | Consumption Variance | About Consumption Variance |
| Analyze capacity variance for each work center and production order and identify capacity constraints. | Capacity Variance | About Capacity Variance |
| Monitor average production times for each item and work center to improve your production planning. | Average Production Times | About Average Production Times |
| Analyze released production orders by item, work center, and time period so you ensure they complete on time. | Released Production Orders | About Released Production Orders |
| Track production scrap by item, work center, and time period to identify production waste and reduce costs. | Production Scrap | About Production Scrap |
Tip
You can easily track the KPIs that the Power BI reports display against your business objectives. To learn more, go to Track your business KPIs with Power BI metrics.
To learn more, go to Power BI Manufacturing app.
Ad-hoc analysis of manufacturing data
Sometimes you just need to check whether the numbers add up correctly, or quickly confirm a figure. The following features are great for ad-hoc analyses:
- Data analysis on ledger list pages
- Open in Excel
The Data Analysis feature lets you open almost any list page, such as Item Ledger Entries or Capacity Ledger Entries, enter analysis mode, and then group, filter, and pivot data as you see fit.
Similarly, you can use the Open in Excel action to open a list page, optionally filter the list to a subset of the data, and then use Excel to work with the data. For example, by using features such as Analyze Data, What-If Analysis, or Forecast Sheet.
Tip
If you configure OneDrive for system features, the Excel workbook opens in your browser.
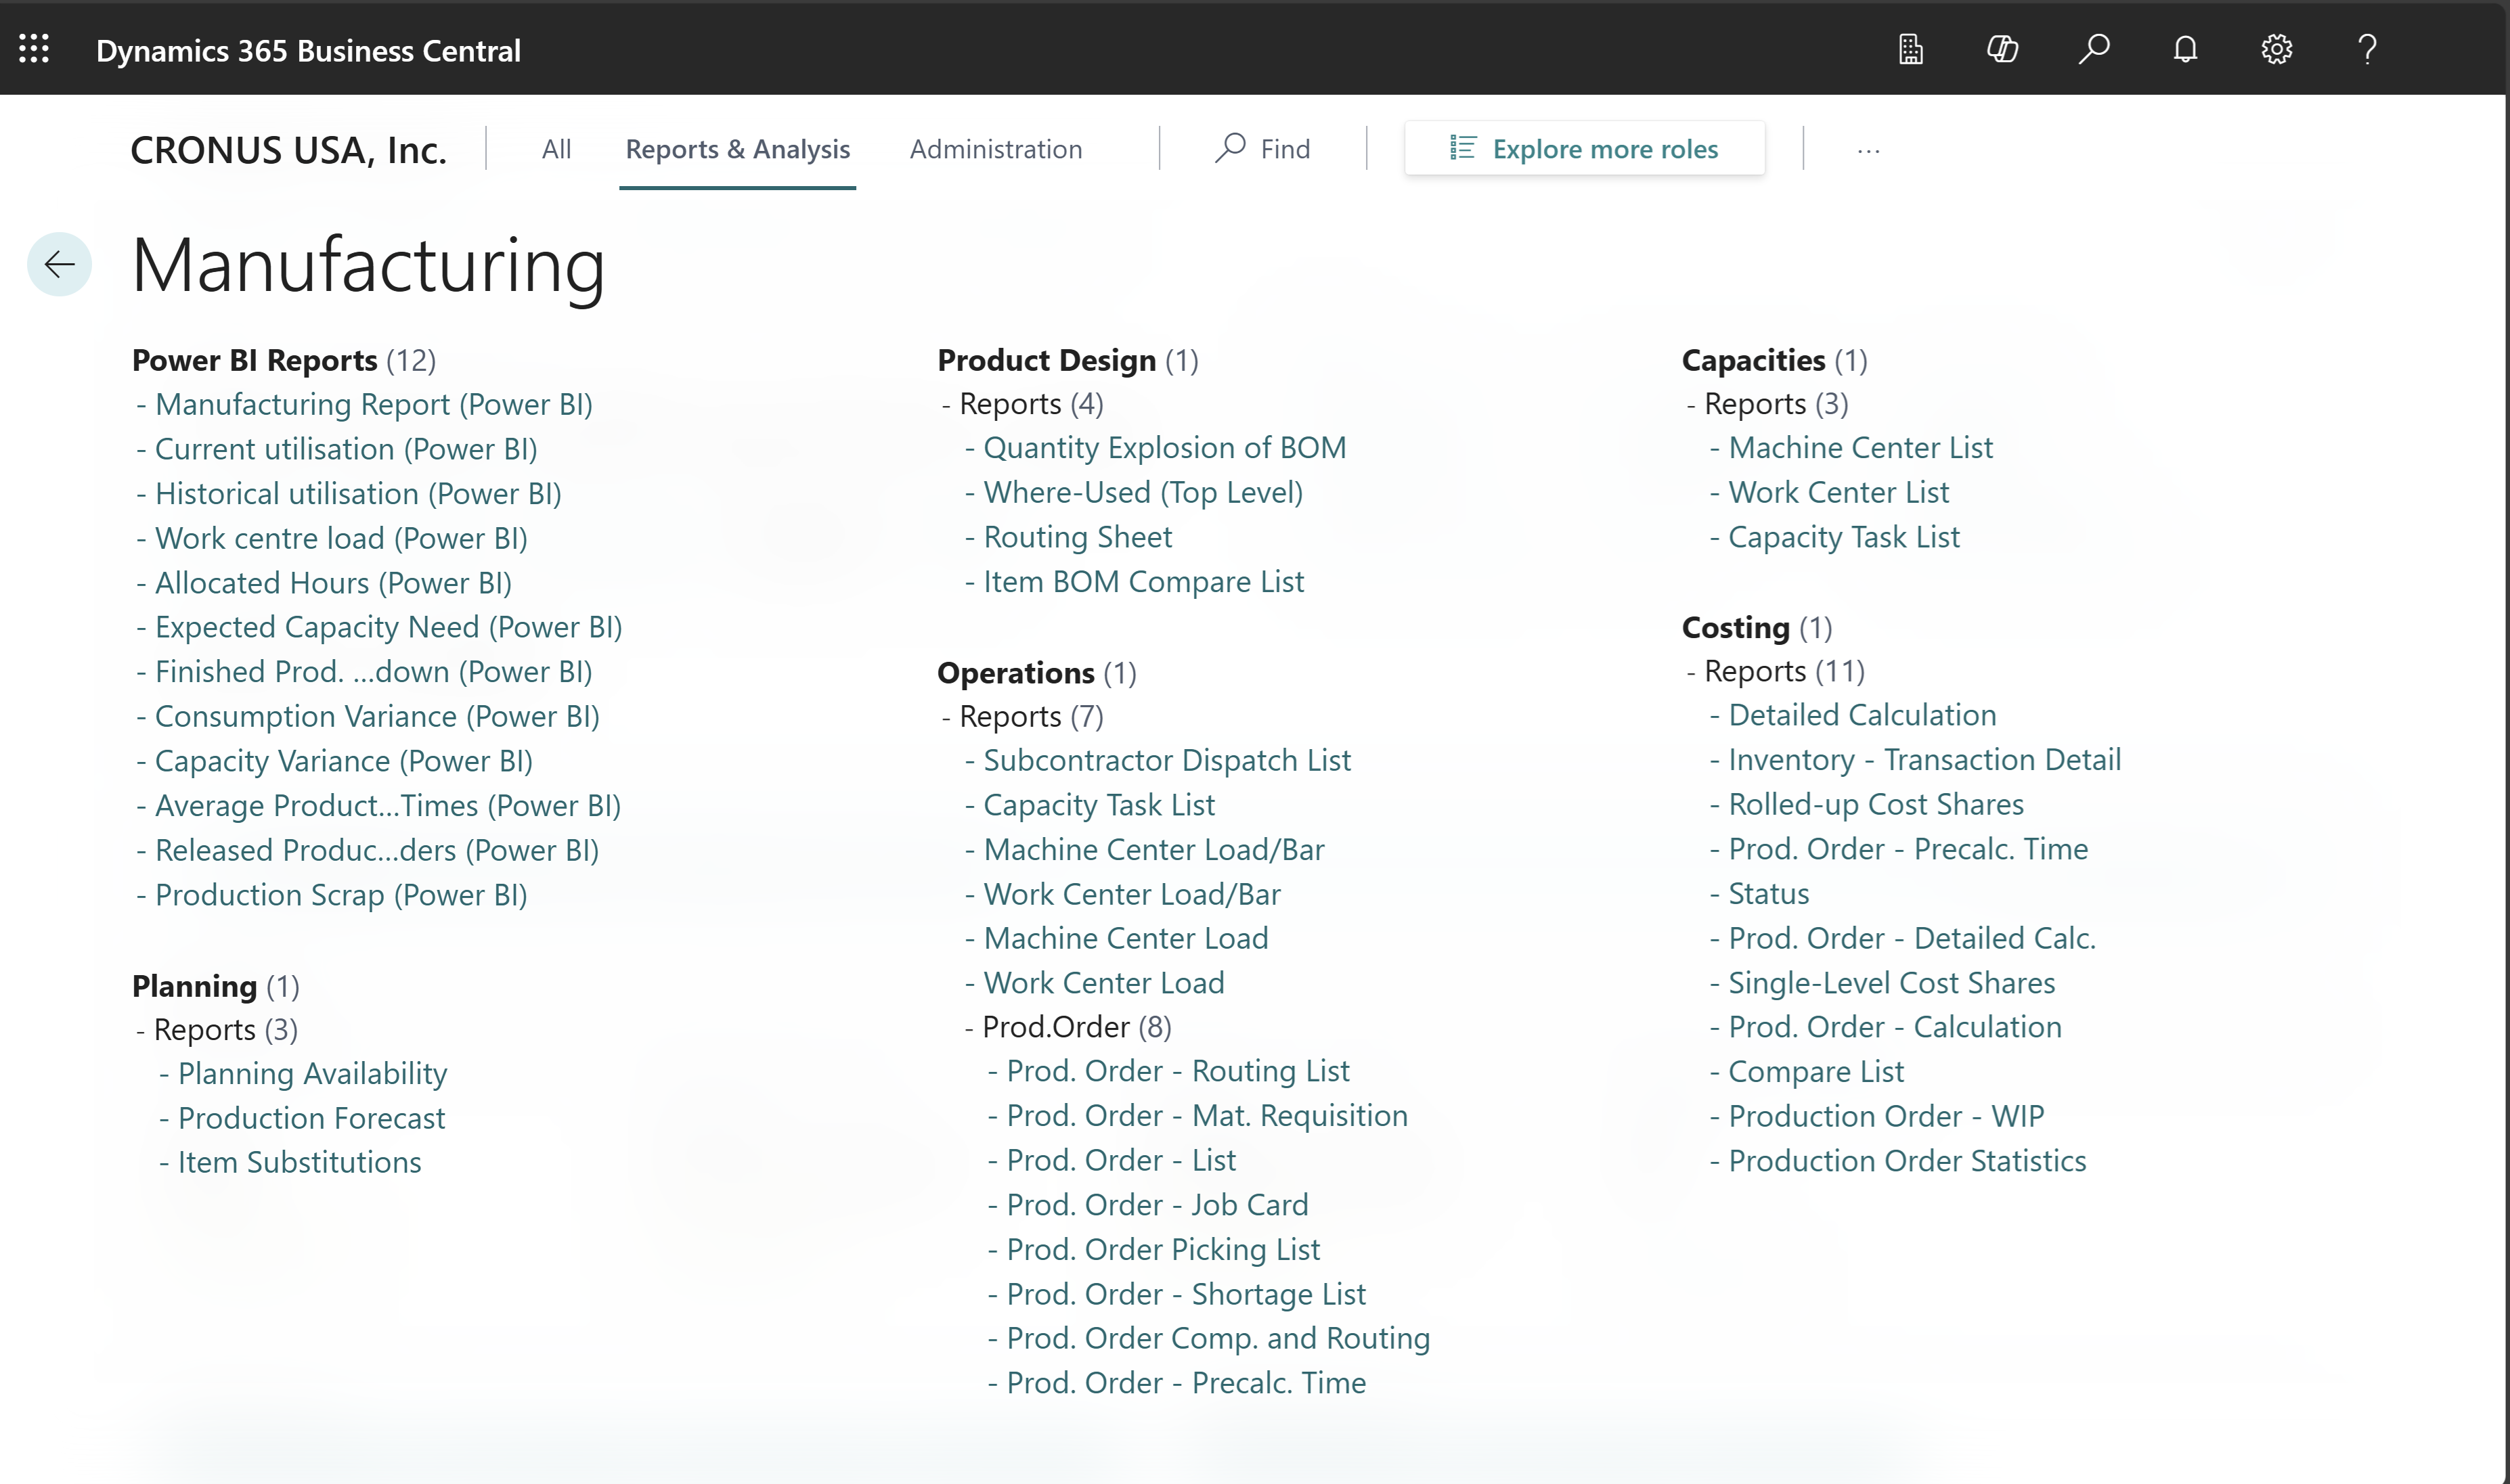
Built-in reports for manufacturing
Business Central includes several built-in reports to help manufacturing organizations report on their data.
To get an overview of available reports, choose All reports at the top of your Home page. This action opens the Role Explorer page, which is filtered to the features in the Report & Analysis option. To find reports related to manufacturing, in the Find field, enter manufacturing. To learn more, go to Finding Reports with the Role Explorer.
To learn more about reports that are relevant for manufacturing, go to Built-in production report overview.
On-screen manufacturing analytics
Business Central has several pages that give you manufacturing overviews and tasks to do, such as:
See also
Power BI Manufacturing app
View the load in work and machine centers
Built-in production report overview
Manufacturing overview


