Hinzufügen des neuen Formatbereichs zu einem benutzerdefinierten visuellen Element mithilfe der API
Wichtig
Um den neuen Bereich "Format" zu einem benutzerdefinierten visuellen Element hinzuzufügen, empfehlen wir die Verwendung Formatmodell Utils.
Obwohl wir empfehlen, das Formatierungsmodell Utils mit dem neuen Formatbereich zu verwenden, zeigt dieses Beispiel, wie ein benutzerdefiniertes visuelles Formatierungsmodell mit nur einer Karte ausschließlich mithilfe der API erstellt wird.
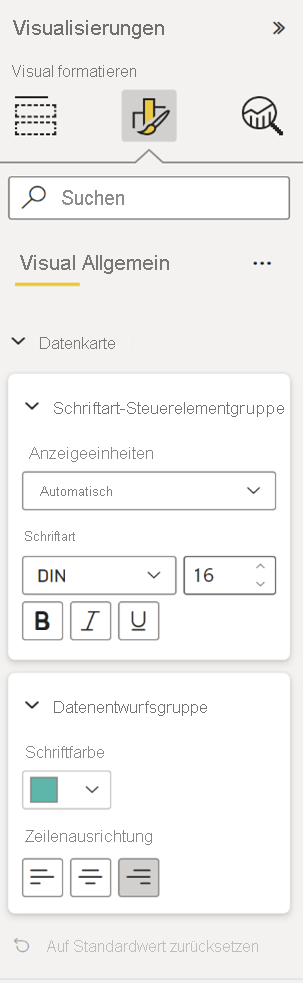
Beispiel: Formatieren einer Datenkarte
Die Karte umfasst zwei Gruppen:
- Schriftsteuerungsgruppe mit einer zusammengesetzten Eigenschaft
- Schriftartsteuerelement
- Datenentwurfsgruppe mit zwei einfachen Eigenschaften
- Schriftfarbe
- Linienausrichtung
Fügen Sie zunächst Objekte zur Funktionsdatei hinzu:
"objects": {
        "dataCard": {
            "properties": {
                "displayUnitsProperty": {
                    "type":
                    {
                        "formatting": {
                            "labelDisplayUnits": true
                        }
                    }
                },
                "fontSize": {
                    "type": {
                        "formatting": {
                            "fontSize": true
                        }
                    }
                },
                "fontFamily": {
                    "type": {
                        "formatting": {
                            "fontFamily": true
                        }
                    }
                },
                "fontBold": {
                    "type": {
                        "bool": true
                    }
                },
                "fontUnderline": {
                    "type": {
                        "bool": true
                    }
                },
                "fontItalic": {
                    "type": {
                        "bool": true
                    }
                },
                "fontColor": {
                    "type": {
                        "fill": {
                            "solid": {
                                "color": true
                            }
                        }
                    }
                },
                "lineAlignment": {
                    "type": {
                        "formatting": {
                            "alignment": true
                        }
                    }
                }
            }
        }
    }
Erstellen Sie dann das getFormattingModel.
    public getFormattingModel(): powerbi.visuals.FormattingModel {
        // Building data card, We are going to add two formatting groups "Font Control Group" and "Data Design Group"
        let dataCard: powerbi.visuals.FormattingCard = {
            description: "Data Card Description",
            displayName: "Data Card",
            uid: "dataCard_uid",
            groups: []
        }

        // Building formatting group "Font Control Group"
        // Notice that "descriptor" objectName and propertyName should match capabilities object and property names
        let group1_dataFont: powerbi.visuals.FormattingGroup = {
            displayName: "Font Control Group",
            uid: "dataCard_fontControl_group_uid",
            slices: [
                {
                    uid: "dataCard_fontControl_displayUnits_uid",
                    displayName:"display units",
                    control: {
                        type: powerbi.visuals.FormattingComponent.Dropdown,
                        properties: {
                            descriptor: {
                                objectName: "dataCard",
                                propertyName:"displayUnitsProperty"
                            },
                            value: 0
                        }
                    }
                },
                // FontControl slice is composite slice, It means it contain multiple properties inside it
                {
                    uid: "data_font_control_slice_uid",
                    displayName: "Font",
                    control: {
                        type: powerbi.visuals.FormattingComponent.FontControl,
                        properties: {
                            fontFamily: {
                                descriptor: {
                                    objectName: "dataCard",
                                    propertyName: "fontFamily"
                                },
                                value: "wf_standard-font, helvetica, arial, sans-serif"
                            },
                            fontSize: {
                                descriptor: {
                                    objectName: "dataCard",
                                    propertyName: "fontSize"
                                },
                                value: 16
                            },
                            bold: {
                                descriptor: {
                                    objectName: "dataCard",
                                    propertyName: "fontBold"
                                },
                                value: false
                            },
                            italic: {
                                descriptor: {
                                    objectName: "dataCard",
                                    propertyName: "fontItalic"
                                },
                                value: false
                            },
                            underline: {
                                descriptor: {
                                    objectName: "dataCard",
                                    propertyName: "fontUnderline"
                                },
                                value: false
                            }
                        }
                    }
                }
            ],
        };
        // Building formatting group "Font Control Group"
        // Notice that "descriptor" objectName and propertyName should match capabilities object and property names
        let group2_dataDesign: powerbi.visuals.FormattingGroup = {
            displayName: "Data Design Group",
            uid: "dataCard_dataDesign_group_uid",
            slices: [
                // Adding ColorPicker simple slice for font color
                {
                    displayName: "Font Color",
                    uid: "dataCard_dataDesign_fontColor_slice",
                    control: {
                        type: powerbi.visuals.FormattingComponent.ColorPicker,
                        properties: {
                            descriptor:
                            {
                                objectName: "dataCard",
                                propertyName: "fontColor"
                            },
                            value: { value: "#01B8AA" }
                        }
                    }
                },
                // Adding AlignmentGroup simple slice for line alignment
                {
                    displayName: "Line Alignment",
                    uid: "dataCard_dataDesign_lineAlignment_slice",
                    control: {
                        type: powerbi.visuals.FormattingComponent.AlignmentGroup,
                        properties: {
                            descriptor:
                            {
                                objectName: "dataCard",
                                propertyName: "lineAlignment"
                            },
                            mode: powerbi.visuals.AlignmentGroupMode.Horizonal,
                            value: "right"
                        }
                    }
                },
            ]
        };

        // Add formatting groups to data card
        dataCard.groups.push(group1_dataFont);
        dataCard.groups.push(group2_dataDesign);

        // Build and return formatting model with data card
        const formattingModel: powerbi.visuals.FormattingModel = { cards: [dataCard] };
        return formattingModel;
    }
Hier sehen Sie das resultierende Fenster:
Einstellungen auf Standard zurücksetzen
Im neuen Formatbereich können Sie alle Werte der Formatierungskarteneigenschaften auf den Standardwert zurücksetzen, indem Sie auf die Schaltfläche Auf Standard zurücksetzen klicken, die in der geöffneten Karte angezeigt wird.
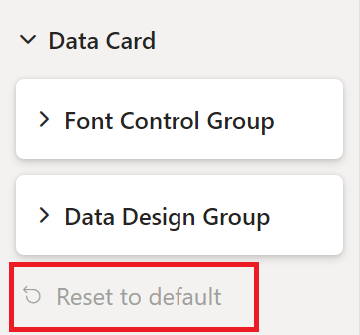
Um diese Funktion zu aktivieren, fügen Sie eine Liste der Deskriptoren für Formatierungskarteneigenschaften zur Formatierungskarte „revertToDefaultDescriptors“ hinzu.
Im folgenden Beispiel wird gezeigt, wie sie die Schaltfläche Auf Standard zurücksetzen hinzufügen:
let dataCard: powerbi.visuals.FormattingCard = {
    displayName: "Data Card",
    // ... card parameters and groups list

    revertToDefaultDescriptors: [
        {
            objectName: "dataCard",
            propertyName:"displayUnitsProperty"
        },
        {
            objectName: "dataCard",
            propertyName: "fontFamily"
        },

        // ... the rest of properties descriptors
    ]
};
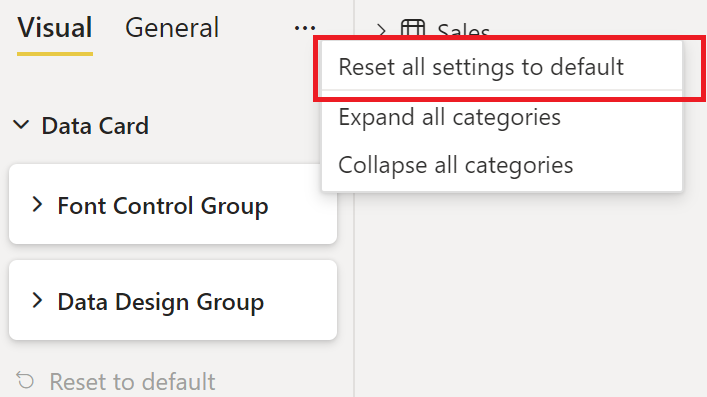
Wenn Sie revertToDefaultDescriptors zu Formatierungskarten hinzufügen, können Sie auch alle Formatierungskarteneigenschaften gleichzeitig zurückzusetzen, indem Sie in der oberen Leiste des Formatbereichs auf die Schaltfläche Alle Einstellungen auf Standard zurücksetzen klicken:
Formatieren von Eigenschaftenauswahl
Die optionale Auswahl im Deskriptor für Formatierungseigenschaften bestimmt, wo die einzelnen Eigenschaften in der dataView gebunden sind. Es gibt vier verschiedene Optionen. Erfahren Sie mehr darüber in Objektauswahltypen.
Lokalisierung
Weitere Informationen zum Lokalisierungsfeature und zum Einrichten einer Lokalisierungsumgebung finden Sie unter Hinzufügen der lokalen Sprache zu Ihrem Power BI-Visual Verwenden Sie den Lokalisierungs-Manager, um Komponenten zu formatieren, die Sie lokalisieren möchten:
displayName: this.localization.getDisplayName("Font_Color_DisplayNameKey");
description: this.localization.getDisplayName("Font_Color_DescriptionKey");
Informationen zum Lokalisieren von Hilfsprogrammen für das Formatierungsmodell finden Sie unter Formatieren von Hilfsprogrammen – Lokalisierung.
GitHub-Ressourcen
Alle Formatierungsmodellschnittstellen finden Sie in GitHub: microsoft/powerbi-visuals-api: API für Benutzerdefinierte Power BI-Visuals unter „formatierung-model-api.d.ts“.
Es wird empfohlen, die neuen Formatierungsmodell-Hilfsprogramme auf GitHub: microsoft/powerbi-visuals-utils-formatierungmodel: Power BI-Visuals Formatierungsmodell-Hilfsprogramme zu verwenden.
Ein Beispiel für ein benutzerdefiniertes Visual SampleBarChart, das API-Version 5.1.0 verwendet und
getFormattingModelmit dem neuen Formatierungsmodell-Hilfsprogramm implementiert, finden Sie unter GitHub: microsoft/PowerBI-visuals-sampleBarChart: Benutzerdefiniertes Balkendiagramm-Visual für Tutorials.
Verwandte Inhalte
Weitere Fragen? Fragen Sie die Power BI Community.