Machine Learning - Evaluate
Important
Support for Machine Learning Studio (classic) will end on 31 August 2024. We recommend you transition to Azure Machine Learning by that date.
Beginning 1 December 2021, you will not be able to create new Machine Learning Studio (classic) resources. Through 31 August 2024, you can continue to use the existing Machine Learning Studio (classic) resources.
- See information on moving machine learning projects from ML Studio (classic) to Azure Machine Learning.
- Learn more about Azure Machine Learning.
ML Studio (classic) documentation is being retired and may not be updated in the future.
This article describes the modules in Machine Learning Studio (classic) that you can use to evaluate a machine learning model. Model evaluation is performed after training is complete, to measure the accuracy of the predictions and assess model fit.
Note
Applies to: Machine Learning Studio (classic) only
Similar drag-and-drop modules are available in Azure Machine Learning designer.
This article also describes the overall process in Machine Learning Studio (classic) for model creation, training, evaluation, and scoring.
Create and use machine learning models in Machine Learning Studio (classic)
The typical workflow for machine learning includes these phases:
- Choose a suitable algorithm and set initial options.
- Train the model by using compatible data.
- Create predictions by using new data that's based on the patterns in the model.
- Evaluate the model to determine whether the predictions are accurate, the amount of error, and whether overfitting occurs.
Machine Learning Studio (classic) supports a flexible, customizable framework for machine learning. Each task in this process is performed by a specific type of module. The module can be modified, added, or removed without breaking the rest of your experiment.
Use the modules in this category to evaluate an existing model. Model evaluation typically requires some kind of result dataset. If you don't have an evaluation dataset, you can generate results by scoring. You can also use a test dataset, or some other set of data that contains "ground truth" or known expected results.
More about model evaluation
In general, when evaluating a model, your options depend on the type of model you are evaluating, and the metric that you want to use. These topics list some of the most frequently used metrics:
Machine Learning Studio (classic) also provides a variety of visualizations, depending on the type of model you're using, and how many classes your model is predicting. For help finding these visualizations, see View evaluation metrics.
Interpreting these statistics often requires a greater understanding of the particular algorithm on which the model was trained. For a good explanation of how to evaluate a model, and how to interpret the values that are returned for each measure, see How to evaluate model performance in Machine Learning.
List of modules
The Machine Learning - Evaluate category includes the following modules:
Cross-Validate Model: Cross-validates parameter estimates for classification or regression models by partitioning the data.
Use the Cross-Validate Model module if you want to test the validity of your training set and the model. Cross-validation partitions the data into folds, and then tests multiple models on combinations of folds.
Evaluate Model: Evaluates a scored classification or regression model by using standard metrics.
In most cases, you'll use the generic Evaluate Model module. This is especially true if your model is based on one of the supported classification or regression algorithms.
Evaluate Recommender: Evaluates the accuracy of recommender model predictions.
For recommendation models, use the Evaluate Recommender module.
Related tasks
- For clustering models, use the Assign Data to Clusters module. Then, use the visualizations in that module to see evaluation results.
- You can create custom evaluation metrics. To create custom evaluation metrics, provide R code in the Execute R Script module, or Python code in the Execute Python Script module. This option is handy if you want to use metrics that were published as part of open-source libraries, or if you want to design your own metric for measuring model accuracy.
Examples
Interpreting the results of machine learning model evaluation is an art. It requires understanding the mathematical results, in addition to the data and the business problems. We recommend that you review these articles for an explanation of how to interpret results in different scenarios:
- Choose parameters to optimize your algorithms in Machine Learning
- Interpret model results in Machine Learning
- Evaluate model performance in Machine Learning
Technical notes
This section contains implementation details, tips, and answers to frequently asked questions.
View evaluation metrics
Learn where to look in Machine Learning Studio (classic) to find the metric charts for each model type.
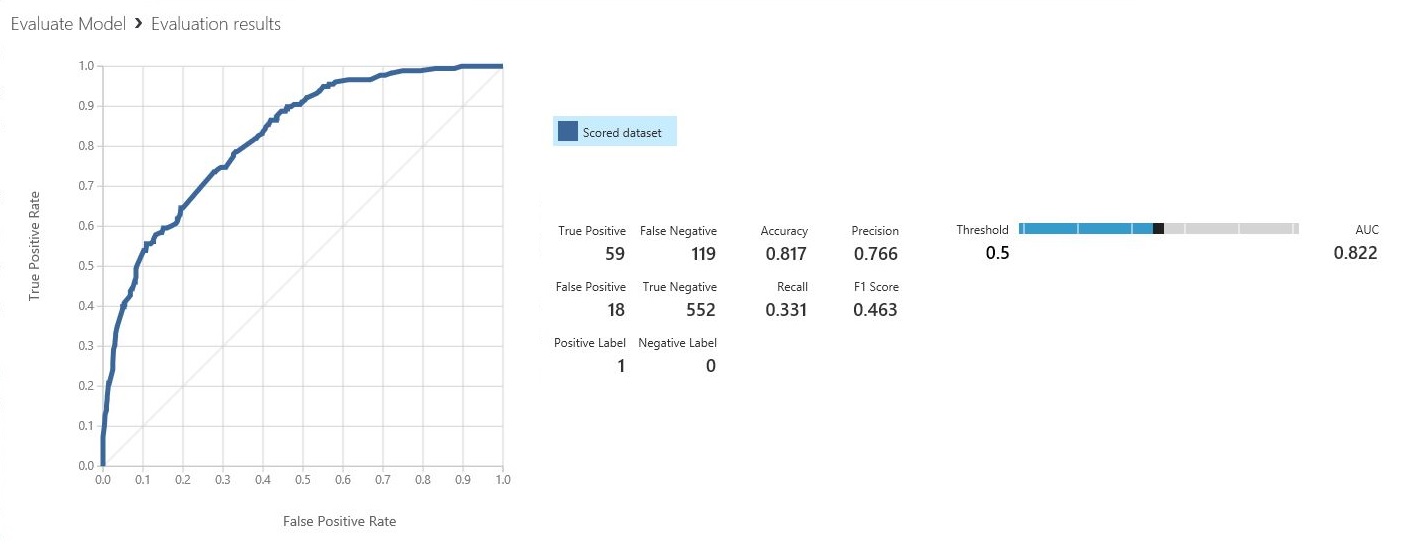
Two-class classification models
The default view for binary classification models includes an interactive ROC chart and a table of values for the principal metrics.

You have two options for viewing binary classification models:
- Right-click the module output, and then select Visualize.
- Right-click the module, select Evaluation results, and then select Visualize.
You can also use the slider to change the probability Threshold value. The threshold determines whether a result should be accepted as true or not. Then, you can see how these values change.
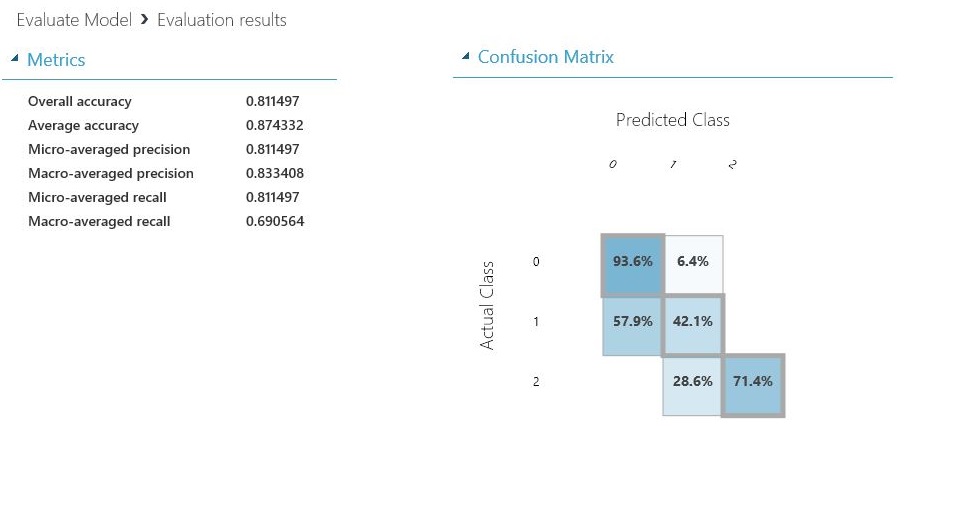
Multiclass classification models
The default metrics view for multi-class classification models includes a confusion matrix for all classes and a set of metrics for the model as a whole.
You have two options for viewing multi-class classification models:
- Right-click the module output, and then select Visualize.
- Right-click the module, select Evaluation results, and then select Visualize.
For simplicity, here are the two results, shown side by side:

Regression models
The metrics view for regression models varies depending on the type of model that you created. The metrics view is based on the underlying algorithm interfaces, and on the best fit for the model metrics.
You have two options for viewing regression models:
- To view the accuracy metrics in a table, right-click the Evaluate Model module's output, and then select Visualize.
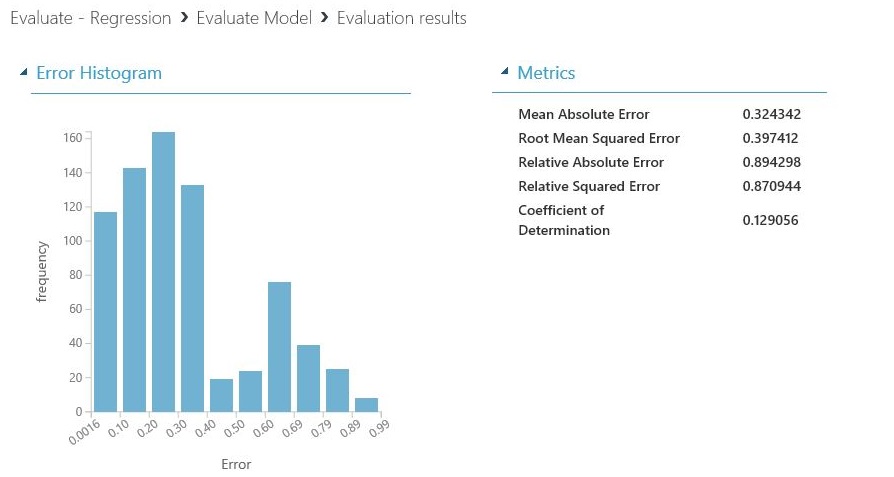
- To view an error histogram with the values, right-click the module, select Evaluation results, and then select Visualize.

The Error Histogram view can help you understand how error is distributed. It's provided for the following model types, and includes a table of default metrics, such as root mean squared error (RMSE).
The following regression models generate a table of default metrics, along with some custom metrics:
- Bayesian Linear Regression
- Decision Forest Regression
- Fast Forest Quantile Regression
- Ordinal Regression
Tips for working with the data
To extract the numbers without copying and pasting from the Machine Learning Studio (classic) UI, you can use the new PowerShell library for Machine Learning. You can get metadata and other information for an entire experiment, or from individual modules.
To extract values from an Evaluate Model module, you must add a unique comment to the module, for easier identification. Then, use the Download-AmlExperimentNodeOutput cmdlet to get the metrics and their values from the visualization in JSON format.
For more information, see Create machine learning models by using PowerShell.