在 Visual Studio 的互動式視窗中使用 IPython
IPython 模式中的 Visual Studio 互動式視窗 是具有互動式平行運算功能的進階且方便使用的互動式開發環境。 本文說明如何在Visual Studio Interactive Window 中使用 IPython,以及存取標準 Interactive Window 功能。
先決條件
在 Windows 上安裝 Visual Studio 並支援 Python 工作負載。 如需詳細資訊,請參閱 在Visual Studio中安裝 Python 支援。
不支援 Visual Studio for Mac。 如需詳細資訊,請參閱 Visual Studio for Mac 發生什麼事? Windows、Mac 和 Linux 上的 Visual Studio Code 透過可用的擴充功能與 Python 搭配運作。
Python 安裝必須包含 IPython、numpy 和 matplotlib 連結庫。 您可以使用 Visual Studio 中的套件安裝程式來安裝這些連結庫,如 教學課程:在 Visual Studio 的 Python 環境中安裝套件中所述。
注意
IronPython 不支援 IPython,儘管您可以在 互動式選項 窗體上選取此選項。 如需詳細資訊,請參閱 功能要求(Interp 為 IronPython 時支援 IPython)。
使用互動式視窗
下列步驟說明如何在互動式視窗中使用 IPython 命令。 本篇教學假設您使用 Anaconda。
在 Visual Studio 中,選取 [檢視 檢視>[其他 Windows>Python 環境],以開啟 [Python 環境] 視窗。
在 [Python 環境] 視窗中,選取 Anaconda 環境。
切換至環境 套件 檢視,以查看已安裝的套件。 在下拉功能表中,選取 套件 (Conda)。 選單選項可能會被命名為 pip 或 Packages。
確認已針對環境安裝
ipython和matplotlib函式庫。如果這兩個程式庫都未安裝,請遵循 教程:在 Visual Studio 的 Python 環境中安裝套件中的指示。 如需詳細資訊,請參閱 Python 環境視窗 - 套件索引標籤參考。
切換至環境 概觀 檢視,然後選取 [使用 IPython 互動式模式 ] 選項。
選取 [開啟互動式視窗,以顯示 IPython 模式中的 互動式視窗。 如果視窗已經開啟,您可能需要重設視窗。
當 互動式視窗 開啟時,您應該會看到第一個提示
In [1]。 如果您看到標準提示>>>,請在提示字元中輸入 return,以確保視窗使用 IPython 模式。 提示應該變更為類似In [2]。
輸入下列程式代碼:
import matplotlib.pyplot as plt
import numpy as np

x = np.linspace(0, 5, 10)
y = x ** 2
plt.plot(x, y, 'r', x, x ** 3, 'g', x, x ** 4, 'b')
輸入最後一行程式代碼並選取 [Enter之後,您應該會看到內嵌圖表:
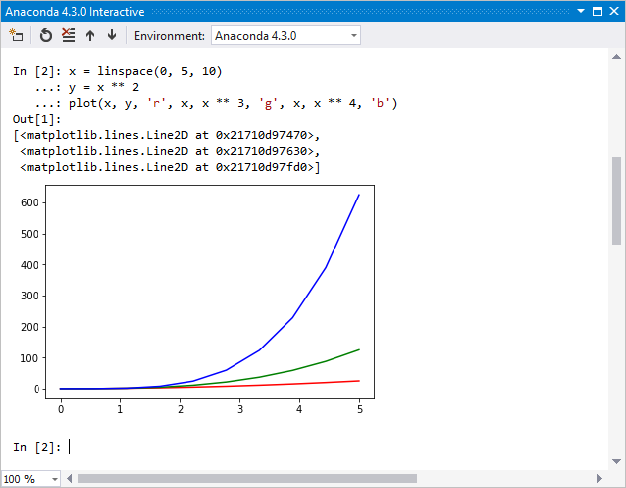
您可以在右下角拖曳來調整圖形大小。
您可以在 Visual Studio 編輯器中撰寫程式代碼,而不是直接在 Interactive Window中輸入程式代碼,並將它傳送至 Interactive Window:
將下列程式代碼貼到編輯器中的新檔案中。
使用鍵盤快捷方式 Ctrl+A 選取編輯器中的程式代碼。
右鍵點擊選取的程式碼,然後選擇 傳送至互動式。 您也可以使用鍵盤快捷方式,Ctrl+Enter。
Visual Studio 會將程式代碼當做單一區塊傳送至 Interactive Window,以避免中繼或部分圖表。
(如果您沒有以特定使用中環境開啟 Python 專案,Visual Studio 會針對 Python 環境 視窗中所列的預設環境開啟 互動式視窗。
from mpl_toolkits.mplot3d import Axes3D
import matplotlib.pyplot as plt
import numpy as np
fig = plt.figure()
ax = fig.add_subplot(111, projection='3d')
for c, z in zip(['r', 'g', 'b', 'y'], [30, 20, 10, 0]):
    xs = np.arange(20)
    ys = np.random.rand(20)
    # You can provide either a single color or an array. To demonstrate this,
    # the first bar of each set is colored cyan.
    cs = [c] * len(xs)
    cs[0] = 'c'
    ax.bar(xs, ys, zs=z, zdir='y', color=cs, alpha=0.8)

ax.set_xlabel('X')
ax.set_ylabel('Y')
ax.set_zlabel('Z')
plt.show()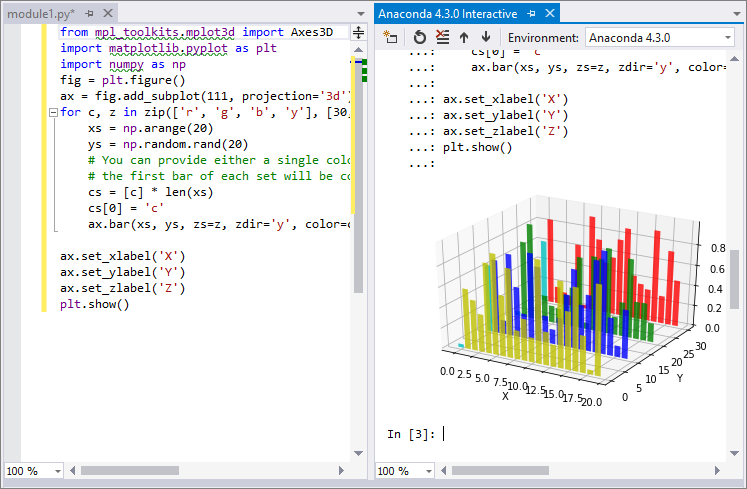
若要在 Interactive Window之外檢視圖表,請在主要 Visual Studio 工具列上,使用 Debug>Start without Debugging 命令執行程式代碼。


IPython 具有許多其他實用的功能,例如逸出至系統殼層、變數替代、擷取輸出等等。 如需詳細資訊,請參閱 IPython 檔案。