在 AKS 上的 HDInsight 中提交和管理 Apache Spark™ 叢集上的作業
重要
AKS 上的 Azure HDInsight 於 2025 年 1 月 31 日淘汰。 透過此公告 深入瞭解。
您必須將工作負載移轉至 Microsoft Fabric 或對等 Azure 產品,以避免突然終止工作負載。
重要
這項功能目前為預覽狀態。 Microsoft Azure 預覽版的補充使用規定 包含適用於 Beta 版、預覽版或尚未正式發行之 Azure 功能的更合法條款。 如需此特定預覽的相關信息,請參閱 在 AKS 上的 Azure HDInsight 預覽資訊。 如需提出問題或功能建議,請在 AskHDInsight 提交請求,並追蹤我們以獲取 Azure HDInsight 社群 的更多更新。
建立叢集之後,使用者可以使用各種介面來提交和管理作業。
- 使用 Jupyter
- 使用 Zeppelin
- 使用 ssh (執行 Apache Spark 的 spark-submit 命令)
使用 Jupyter
先決條件
AKS 上的 HDInsight 叢集中的 Apache Spark™ 叢集。 如需詳細資訊,請參閱 建立 Apache Spark 叢集。
Jupyter Notebook 是支援各種程式設計語言的互動式筆記本環境。
建立 Jupyter 筆記本
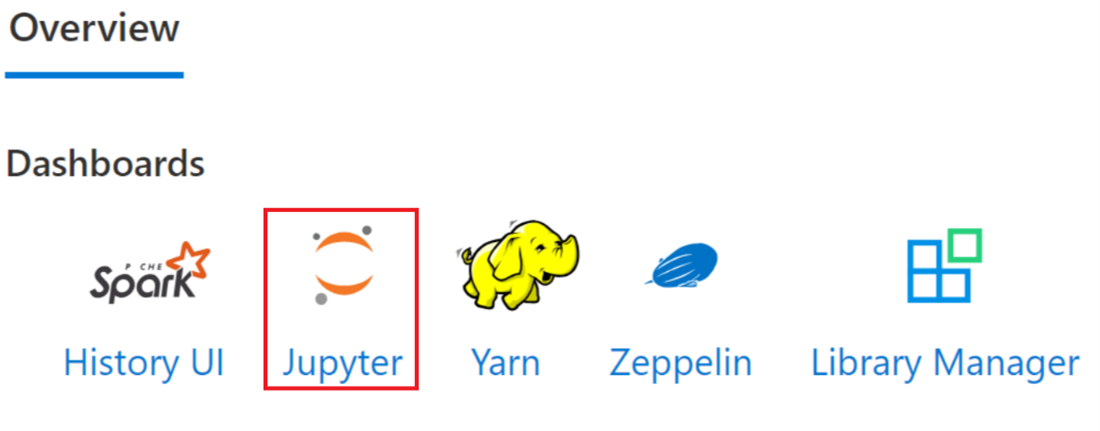
流覽至 [Apache Spark™ 叢集] 頁面,然後開啟 [概觀] 索引卷標。按兩下 Jupyter,它會要求您驗證並開啟 Jupyter 網頁。
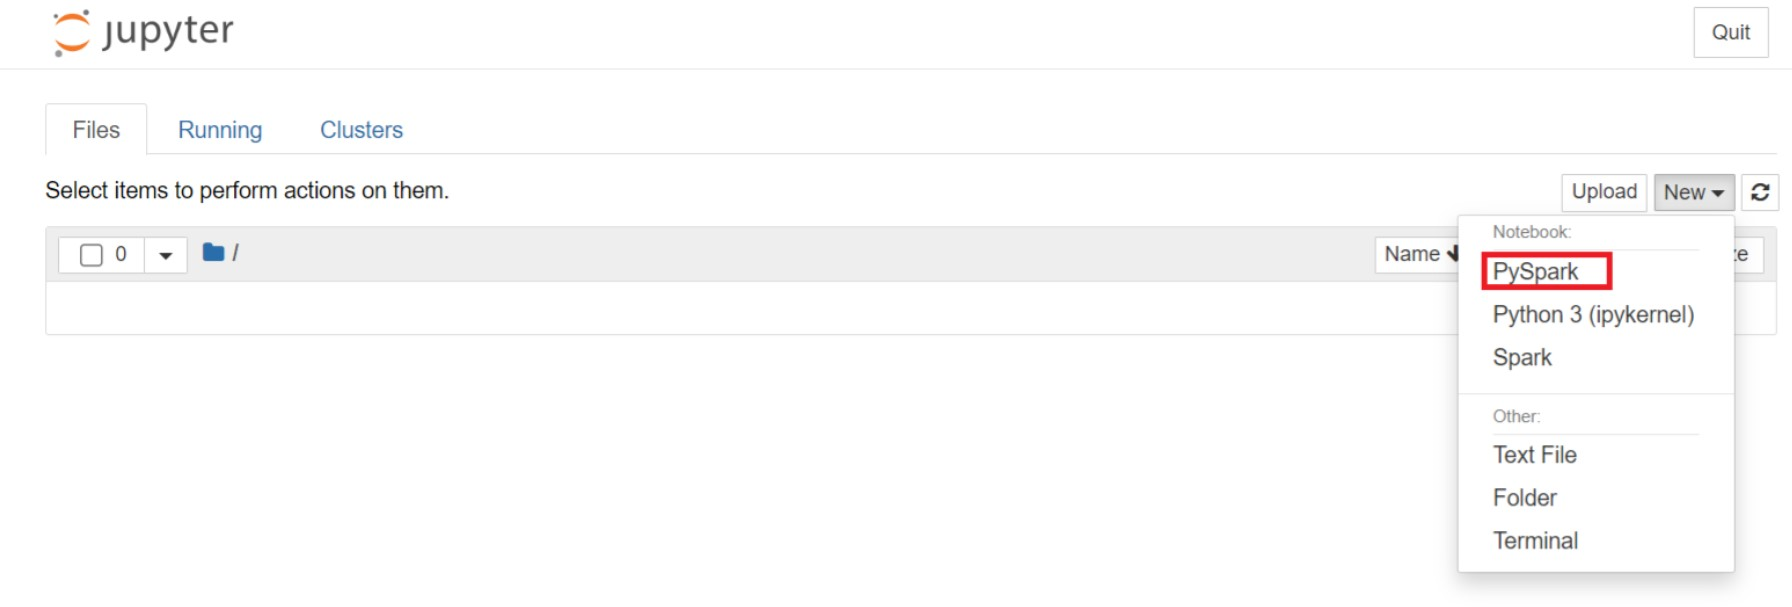
從 Jupyter 網頁,選取 [新增] > PySpark 以建立筆記本。
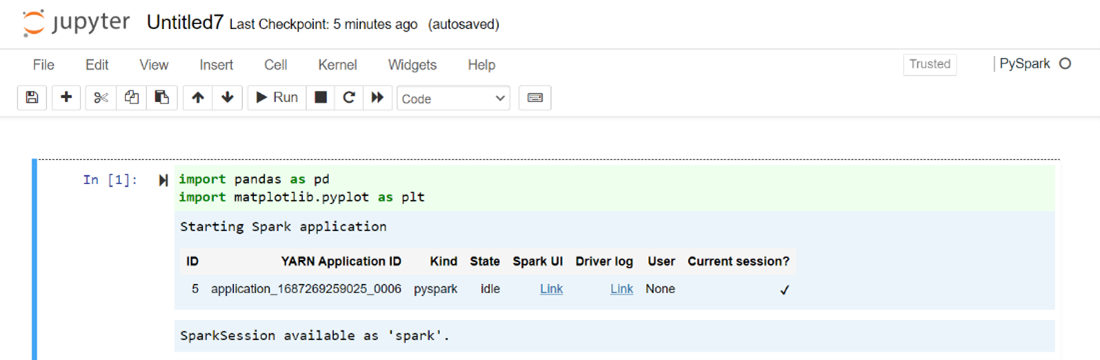
新筆記本以名稱
Untitled(Untitled.ipynb)建立並開啟。注意
藉由使用 PySpark 或 Python 3 核心來建立筆記本,當您執行第一個程式碼區塊時,系統會自動為您建立 Spark 工作階段。 您不需要明確建立會話。
將下列程式代碼貼到 Jupyter Notebook 的空白數據格中,然後按 SHIFT + ENTER 以執行程式碼。 如需更多 Jupyter 控制項的資訊,請在這裡查看 和。
%matplotlib inline
import pandas as pd
import matplotlib.pyplot as plt
data1 = [22,40,10,50,70]
s1 = pd.Series(data1)   #One-dimensional ndarray with axis labels (including time series).

data2 = data1
index = ['John','sam','anna','smith','ben']
s2 = pd.Series(data2,index=index)

data3 = {'John':22, 'sam':40, 'anna':10,'smith':50,'ben':70}
s3 = pd.Series(data3)

s3['jp'] = 32     #insert a new row
s3['John'] = 88

names = ['John','sam','anna','smith','ben']
ages = [10,40,50,48,70]
name_series = pd.Series(names)
age_series = pd.Series(ages)

data_dict = {'name':name_series, 'age':age_series}
dframe = pd.DataFrame(data_dict)
#create a pandas DataFrame from dictionary

dframe['age_plus_five'] = dframe['age'] + 5
#create a new column
dframe.pop('age_plus_five')
#dframe.pop('age')

salary = [1000,6000,4000,8000,10000]
salary_series = pd.Series(salary)
new_data_dict = {'name':name_series, 'age':age_series,'salary':salary_series}
new_dframe = pd.DataFrame(new_data_dict)
new_dframe['average_salary'] = new_dframe['age']*90

new_dframe.index = new_dframe['name']
print(new_dframe.loc['sam'])
繪製圖表,以薪資為 X 軸,年齡為 Y 軸。
在相同的筆記本中,將下列程式代碼貼到 Jupyter Notebook 的空白數據格中,然後按 SHIFT + ENTER 來執行程序代碼。
%matplotlib inline
import pandas as pd
import matplotlib.pyplot as plt

plt.plot(age_series,salary_series)
plt.show()


儲存筆記本
從筆記本選單列,導航至 [文件] > [儲存] 和 [檢查點]。
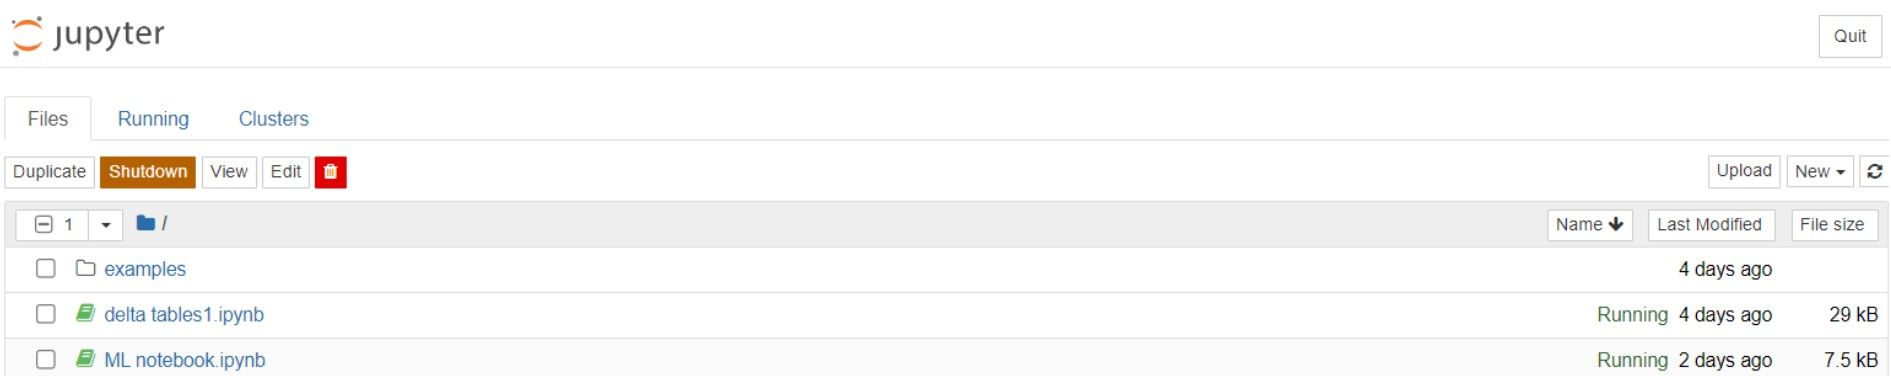
關閉筆記型電腦以釋放叢集資源:從筆記本功能表欄瀏覽至 [檔案] > [關閉並停止]。 您也可以在範例資料夾下執行任何記事本。

使用 Apache Zeppelin 筆記本
AKS 上 HDInsight 中的 Apache Spark 叢集包含 Apache Zeppelin 筆記本。 使用筆記本來執行 Apache Spark 作業。 在本文中,您將瞭解如何在 AKS 叢集上的 HDInsight 上使用 Zeppelin Notebook。
先決條件
AKS 上的 HDInsight 上的 Apache Spark 叢集。 如需指示,請參閱 建立 Apache Spark 叢集。
啟動 Apache Zeppelin 筆記本
流覽至 [Apache Spark 叢集概觀] 頁面,然後從 [叢集儀錶板] 中選取 Zeppelin Notebook。 它會提示驗證並開啟 Zeppelin 頁面。
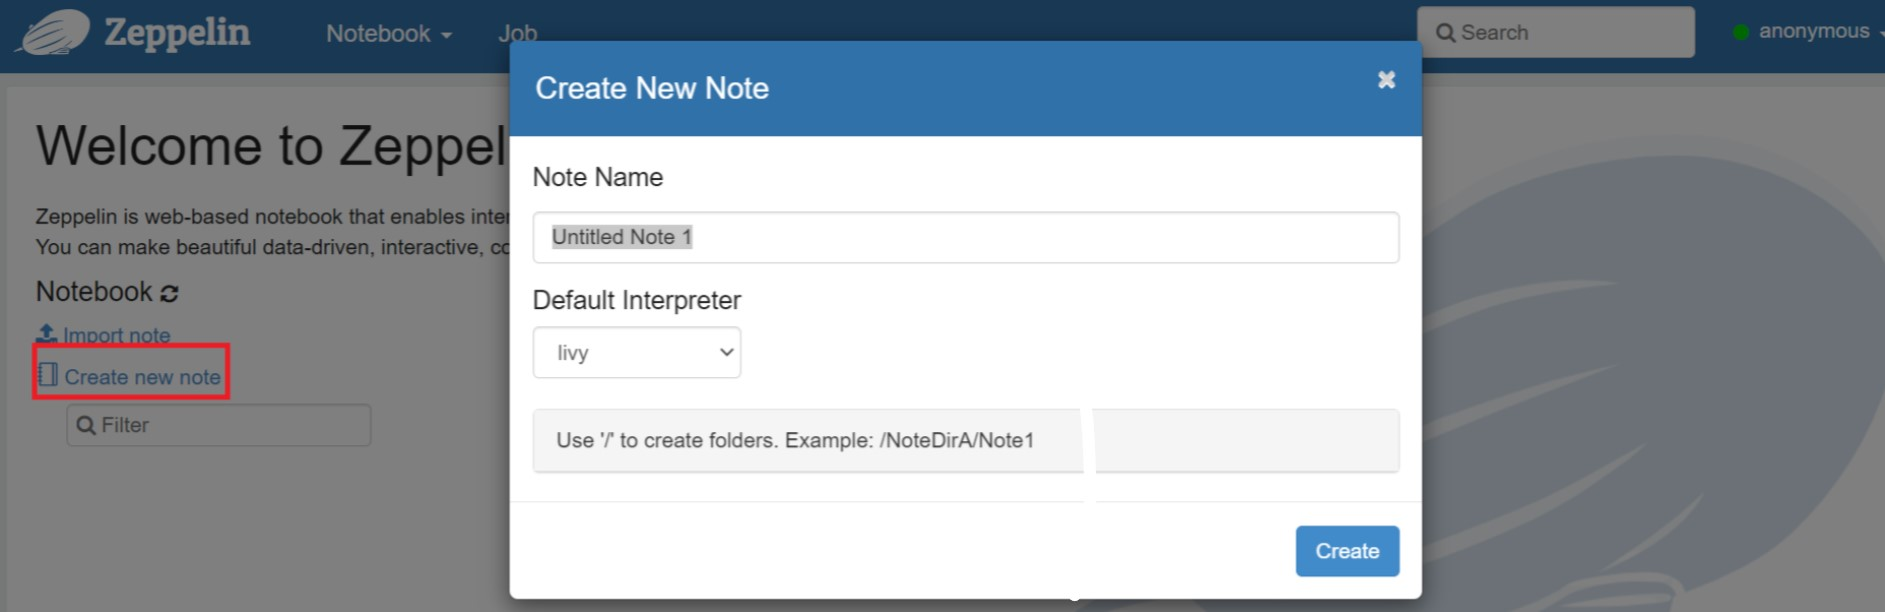
建立新的筆記本。 從頁首窗格中,流覽至 [筆記本] > [建立新記事]。 確定筆記本標頭會顯示連線狀態。 它表示右上角的綠色點。
在 Zeppelin Notebook 中執行下列程序代碼:
%livy.pyspark
import pandas as pd
import matplotlib.pyplot as plt
data1 = [22,40,10,50,70]
s1 = pd.Series(data1)   #One-dimensional ndarray with axis labels (including time series).

data2 = data1
index = ['John','sam','anna','smith','ben']
s2 = pd.Series(data2,index=index)

data3 = {'John':22, 'sam':40, 'anna':10,'smith':50,'ben':70}
s3 = pd.Series(data3)

s3['jp'] = 32     #insert a new row

s3['John'] = 88

names = ['John','sam','anna','smith','ben']
ages = [10,40,50,48,70]
name_series = pd.Series(names)
age_series = pd.Series(ages)

data_dict = {'name':name_series, 'age':age_series}
dframe = pd.DataFrame(data_dict)   #create a pandas DataFrame from dictionary

dframe['age_plus_five'] = dframe['age'] + 5   #create a new column
dframe.pop('age_plus_five')
#dframe.pop('age')

salary = [1000,6000,4000,8000,10000]
salary_series = pd.Series(salary)
new_data_dict = {'name':name_series, 'age':age_series,'salary':salary_series}
new_dframe = pd.DataFrame(new_data_dict)
new_dframe['average_salary'] = new_dframe['age']*90

new_dframe.index = new_dframe['name']
print(new_dframe.loc['sam'])
選取 [播放] 按鈕以執行段落的代碼片段。 段落右上角的狀態應該從 READY、PENDING、RUNNING 到 FINISHED 進行。 輸出會顯示在相同段落底部。 螢幕快照看起來像下圖:

輸出:


使用Spark提交作業
使用下列命令 『#vim samplefile.py』 建立檔案
此命令會開啟 vim 檔案
將下列程式代碼貼到 vim 檔案中
import pandas as pd
import matplotlib.pyplot as plt

From pyspark.sql import SparkSession
Spark = SparkSession.builder.master('yarn').appName('SparkSampleCode').getOrCreate()
# Initialize spark context
data1 = [22,40,10,50,70]
s1 = pd.Series(data1)   #One-dimensional ndarray with axis labels (including time series).

data2 = data1
index = ['John','sam','anna','smith','ben']
s2 = pd.Series(data2,index=index)

data3 = {'John':22, 'sam':40, 'anna':10,'smith':50,'ben':70}
 s3 = pd.Series(data3)

s3['jp'] = 32     #insert a new row

s3['John'] = 88

names = ['John','sam','anna','smith','ben']
ages = [10,40,50,48,70]
name_series = pd.Series(names)
age_series = pd.Series(ages)

data_dict = {'name':name_series, 'age':age_series}
dframe = pd.DataFrame(data_dict)   #create a pandas DataFrame from dictionary

dframe['age_plus_five'] = dframe['age'] + 5   #create a new column
dframe.pop('age_plus_five')
#dframe.pop('age')

salary = [1000,6000,4000,8000,10000]
salary_series = pd.Series(salary)
new_data_dict = {'name':name_series, 'age':age_series,'salary':salary_series}
new_dframe = pd.DataFrame(new_data_dict)
new_dframe['average_salary'] = new_dframe['age']*90

new_dframe.index = new_dframe['name']
print(new_dframe.loc['sam'])
用以下方法儲存文件。
- 按 [逸出] 按鈕
- 輸入命令
:wq
執行下列命令以執行作業。
/spark-submit --master yarn --deploy-mode cluster <filepath>/samplefile.py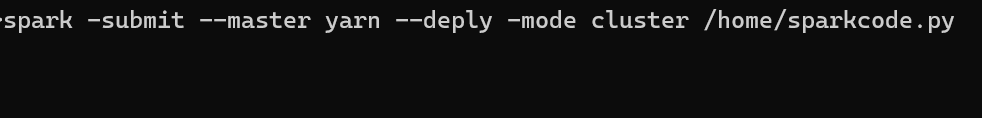

在 AKS 上的 HDInsight 中監視 Apache Spark 叢集上的查詢
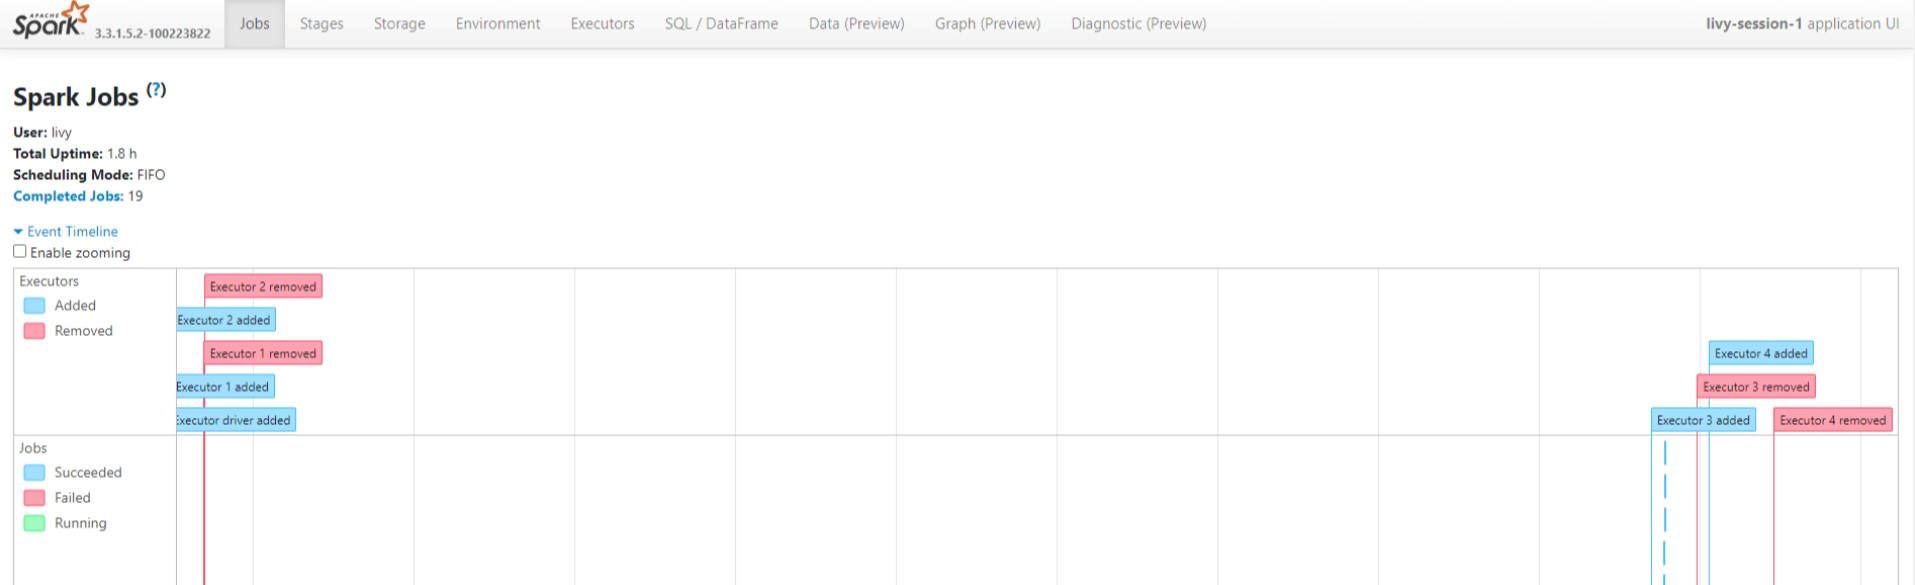
Spark 歷程記錄 UI
在總覽標籤中點擊 [Spark 歷程記錄伺服器 UI]。
使用相同的應用程式識別碼,從UI選取最近的執行。
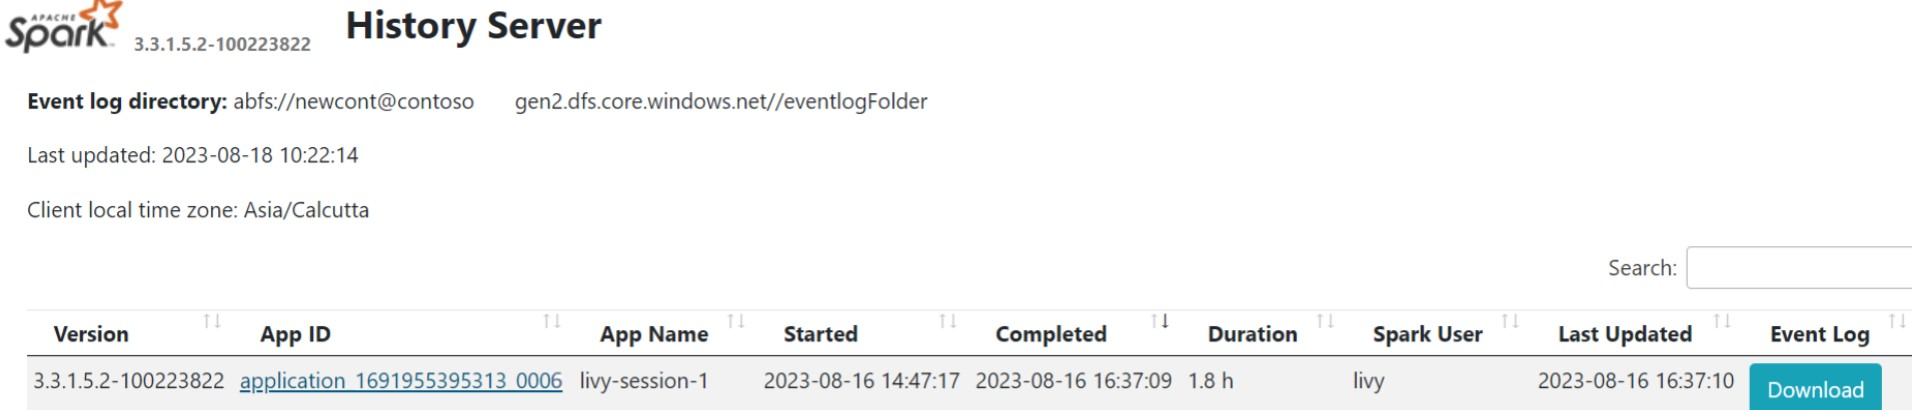
在 Spark 歷程記錄伺服器介面中檢視有向無環圖和作業階段。


Livy 會話 UI
若要開啟 Livy 工作階段 UI,請在瀏覽器中輸入下列命令
https://<CLUSTERNAME>.<CLUSTERPOOLNAME>.<REGION>.projecthilo.net/p/livy/ui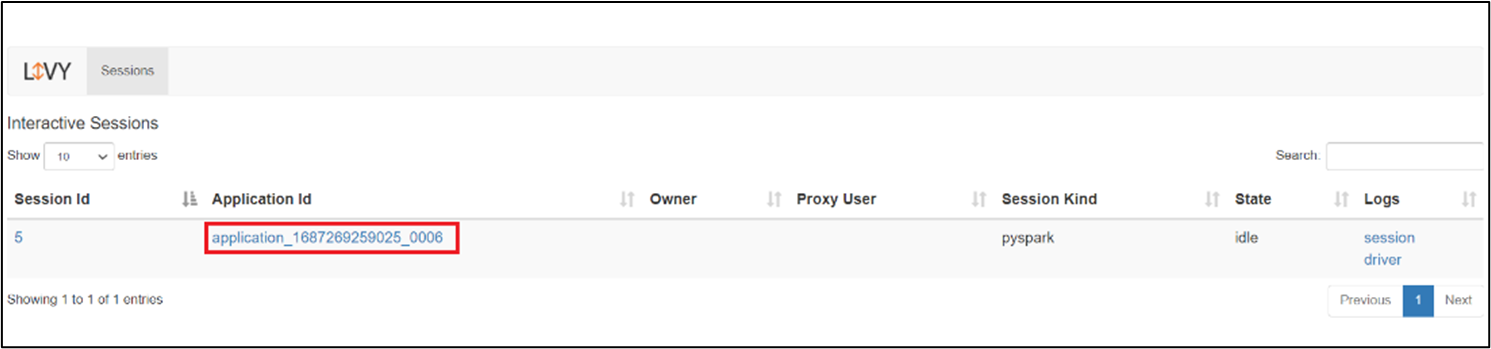
按兩下 [記錄] 底下的 [驅動程式] 選項,以檢視驅動程序記錄。

Yarn UI
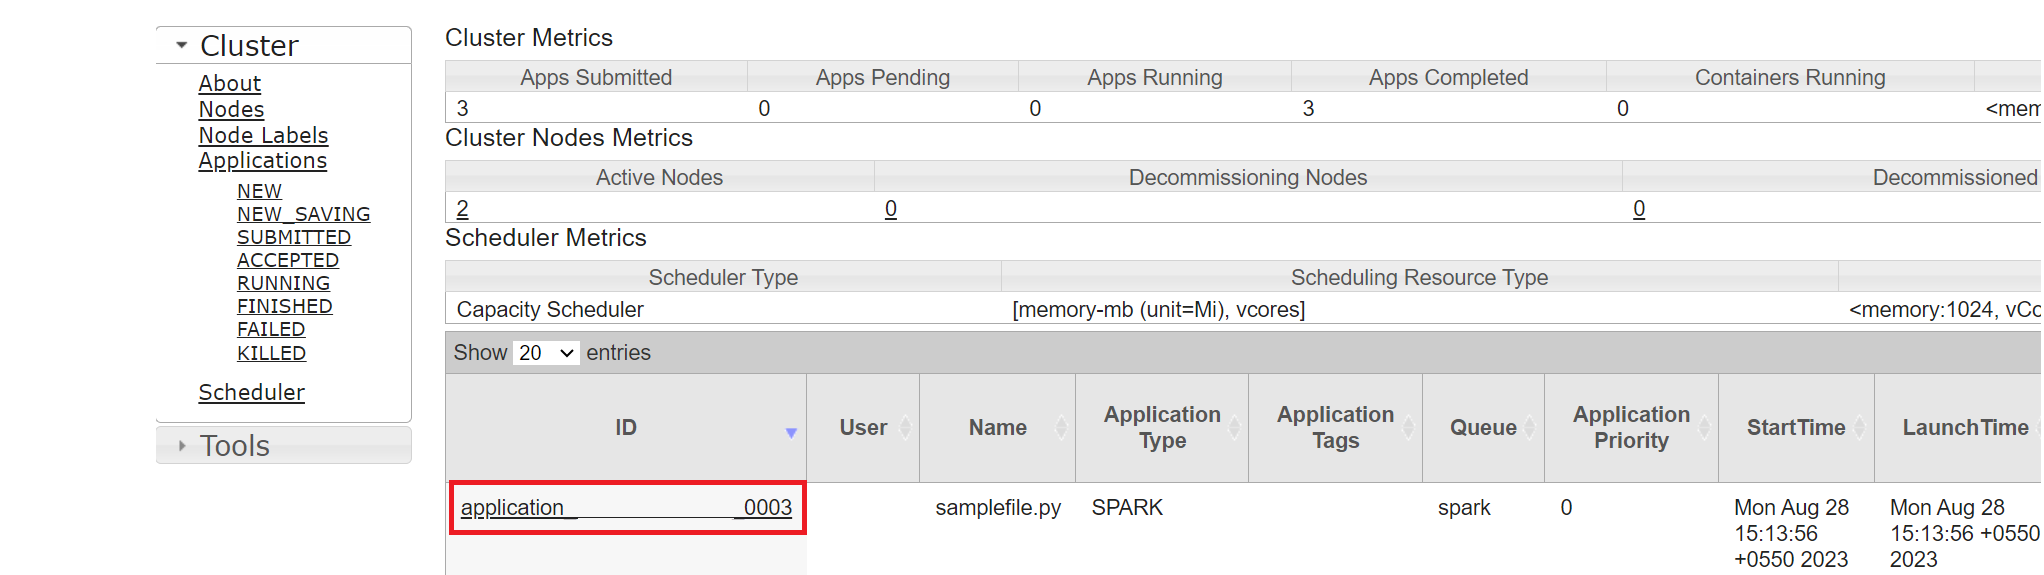
從 [概觀] 索引標籤按兩下 [Yarn],然後開啟 Yarn UI。
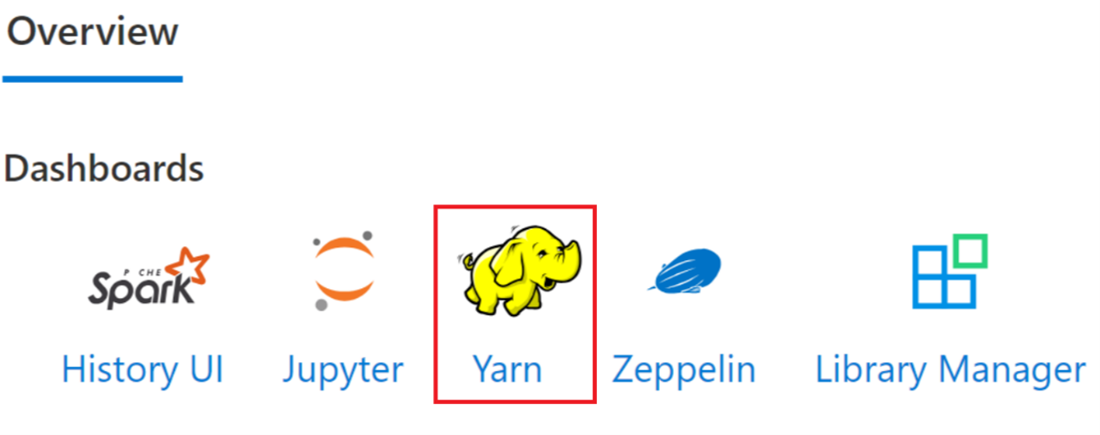
您可以使用相同的應用程式識別碼來追蹤您最近執行的作業。
按兩下Yarn中的應用程式識別碼,以檢視作業的詳細記錄。


參考
- Apache、Apache Spark、Spark 和相關開放原始碼專案名稱 是 Apache Software Foundation (ASF) 商標。