在 Jupyter 筆記本中快速建立報表
若您使用 Jupyter 筆記本,只需幾個步驟即可產生 Power BI 快速報表,不需要離開筆記本。 快速報表可讓您使用筆記本體驗中的 Power BI 視覺效果功能,輕鬆地講述資料故事。
快速報告是不會自動儲存的暫存報表。 每次執行程式碼時,都會建立新的報表,並移除舊的報表。 您可以手動儲存報表,以供稍後在筆記本或 Power BI 中使用。
必要條件
匯入模組
在筆記本中使用 DataFrame 時,需要下列模組:
- 來自
powerbiclient的QuickVisualize和get_dataset_config pandas
from powerbiclient import QuickVisualize, get_dataset_config
import pandas as pd
建立 pandas DataFrame
建立 pandas DataFrame 並加以更新。 下列範例會示範從範例 CSV 檔案建立 DataFrame,但您可以以任何方式建立自己的 DataFrame。
# Import your own CSV as a pandas data frame
df = pd.read_csv('Financial Sample.csv')

# Perform preprocessing
df = df.drop(['Month Number', 'Month Name', 'Year'], axis=1)
df = df.loc[df['Units Sold'] > 1000]
df['Discounted'] = df['Discount Band'] != 'None'
向 Power BI 驗證
# Import the DeviceCodeLoginAuthentication class to authenticate against Power BI
from powerbiclient.authentication import DeviceCodeLoginAuthentication

# Initiate device authentication
device_auth = DeviceCodeLoginAuthentication()
如需有關驗證的詳細資訊,請參閱 GitHub wiki 頁面。
建立及轉譯快速視覺化執行個體
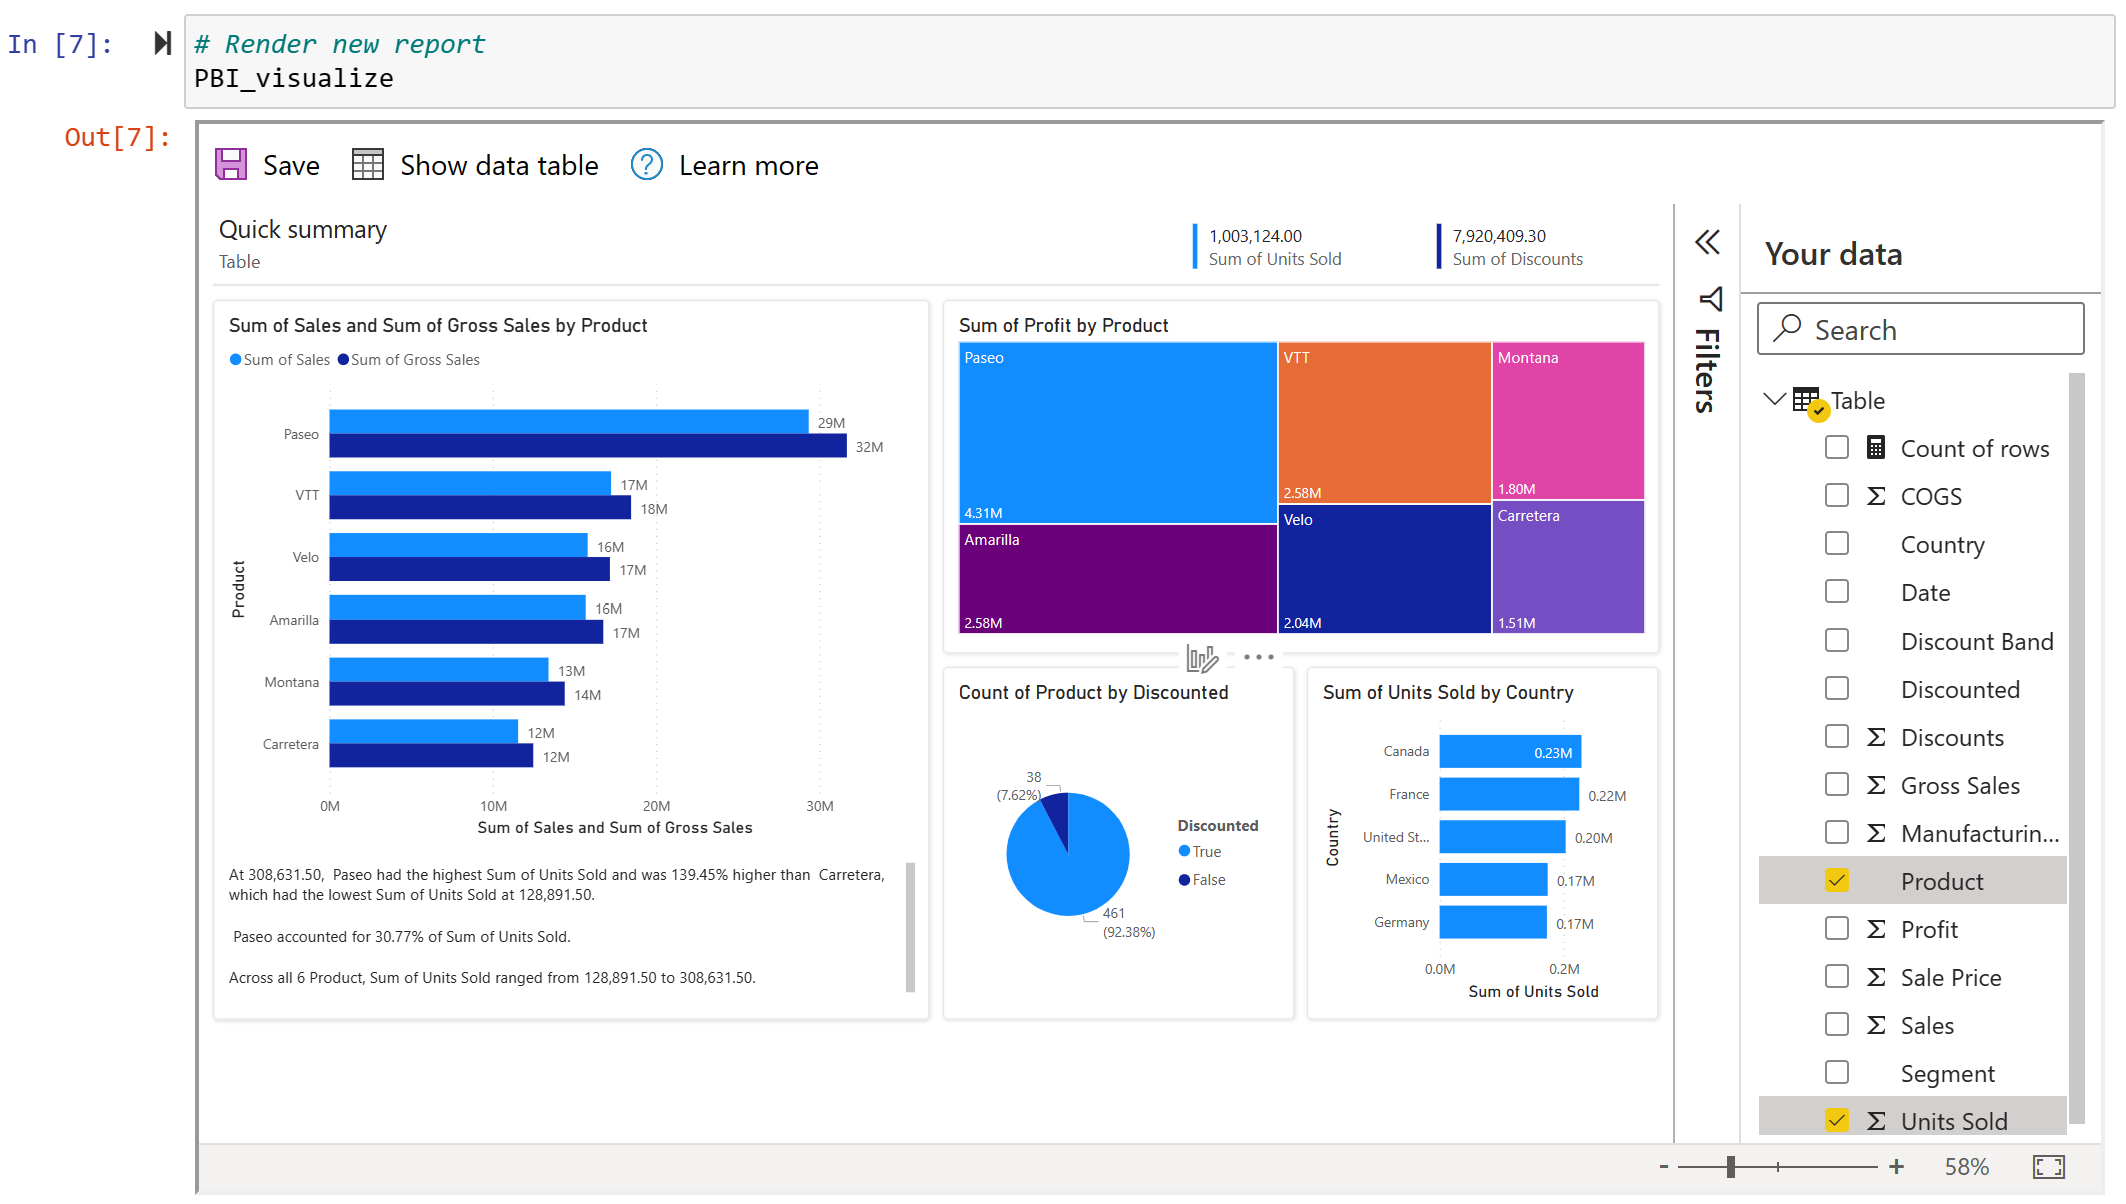
從您已建立的 DataFrame 建立 QuickVisualize 執行個體。 若您使用 pandas DataFrame,可以使用如以下程式碼片段所示的公用程式函式來建立報表。 若您使用 pandas 以外的 DataFrame,請自行剖析資料。
# Create a Power BI report from your data
PBI_visualize = QuickVisualize(get_dataset_config(df), auth=device_auth)

# Render new report
PBI_visualize

自訂報表 (選擇性)
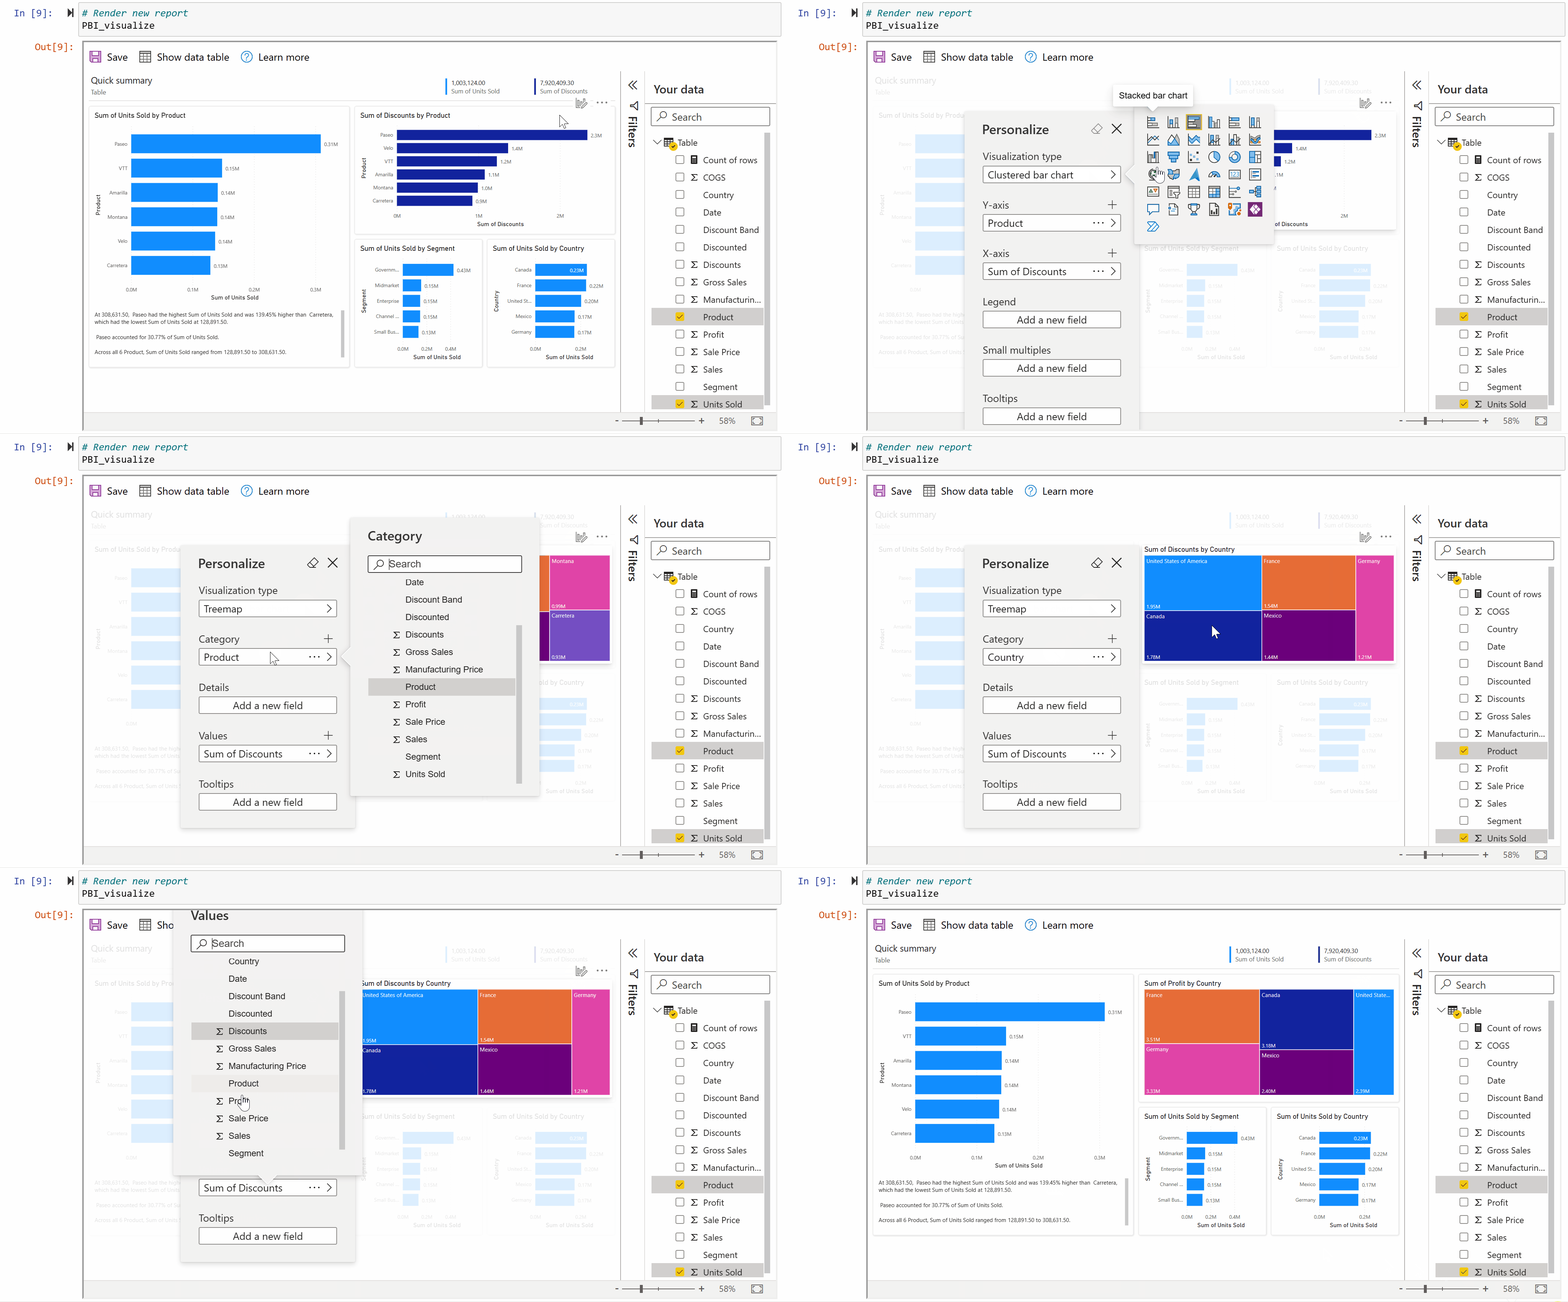
建立報表之後,您可以自訂報表,以從您的資料中取得最有價值的見解,並為您筆記本中的報表建立最合適的內容。
編輯視覺效果並加以儲存。

如需詳細資訊,請參閱與 Power BI 服務中自動產生的「快速」報表互動 (部分機器翻譯)。
定義容器的大小。
# Set new width and height for the container
PBI_visualize.set_size(400, 600)
如需示範 Jupyter 筆記本,請參閱 GitHub 存放庫 (英文)。
相關內容
更多問題嗎? 嘗試在 Power BI 社群提問