教學課程第 2 部分:使用 Microsoft Fabric 筆記本探索和視覺化資料
在本教學課程中,您將了解如何進行探索式資料分析 (EDA),以檢查和調查資料,同時透過使用資料視覺效果技術來摘要其重要特性。
您將使用作為 Python 資料視覺效果程式庫的 seaborn,該程式庫提供高階介面,可在 DataFrame 和陣列上建置視覺效果。 如需 seaborn 的詳細資訊,請參閱 Seaborn:統計資料視覺效果。
您也將使用筆記本型工具 Data Wrangler 來提供沉浸式體驗,方便進行探索式資料分析和清除。
本教學課程中的主要步驟如下:
- 讀取從 Lakehouse 中差異資料表儲存的資料。
- 將 Spark DataFrame 轉換成 Python 視覺效果程式庫支援的 Pandas DataFrame。
- 使用 Data Wrangler 執行初始資料清理和轉換。
- 使用
seaborn執行探索式資料分析。
必要條件
取得 Microsoft Fabric 訂用帳戶。 或註冊免費的 Microsoft Fabric 試用版。
登入 Microsoft Fabric。
使用首頁左下方的體驗切換器,切換至 Fabric。
![體驗切換器功能表的螢幕擷取畫面,顯示選取 [資料科學] 的位置。](media/tutorial-data-science-prepare-system/switch-to-data-science.png)
這是教學課程系列 5 部分中的第 2 部分。 若要完成本教學課程,請先完成:
遵循筆記本中的指示
2-explore-cleanse-data.ipynb 是本教學課程隨附的筆記本。
若要開啟本教學課程隨附的筆記本,請遵循 準備系統以進行數據科學教學課程中的指示,然後 把筆記本匯入到您的工作區。
如果您想要複製並貼上此頁面中的程式碼,則可以建立新的筆記本。
開始執行程式碼之前,請務必將 Lakehouse 連結至筆記本。
重要
連結您在第 1 部分中使用的相同 Lakehouse。
從 Lakehouse 讀取未經處理資料
從 Lakehouse 的 [檔案] 區段讀取未經處理資料。 您已在上一個筆記本中上傳此資料。 在執行此程式碼之前,請確定您已將第 1 部分中使用的相同 Lakehouse 連結至此筆記本。
df = (
    spark.read.option("header", True)
    .option("inferSchema", True)
    .csv("Files/churn/raw/churn.csv")
    .cache()
)
從資料集建立 Pandas DataFrame
將 spark DataFrame 轉換成 pandas DataFrame,以方便處理和取得視覺效果。
df = df.toPandas()
顯示未經處理資料
使用 display 探索未經處理資料,執行一些基本統計資料並顯示圖表檢視。 請注意,您必須先匯入必要的程式庫,例如 Numpy、Pnadas、Seaborn 和 Matplotlib,以進行資料分析和穝視覺效果。
import seaborn as sns
sns.set_theme(style="whitegrid", palette="tab10", rc = {'figure.figsize':(9,6)})
import matplotlib.pyplot as plt
import matplotlib.ticker as mticker
from matplotlib import rc, rcParams
import numpy as np
import pandas as pd
import itertools
display(df, summary=True)
使用 Data Wrangler 執行初始資料清理
若要探索及轉換筆記本中的任何 pandas DataFrame,請直接從筆記本啟動 Data Wrangler。
注意
當筆記本核心忙碌時,無法開啟 Data Wrangler。 儲存格執行必須在啟動 Data Wrangler 之前完成。
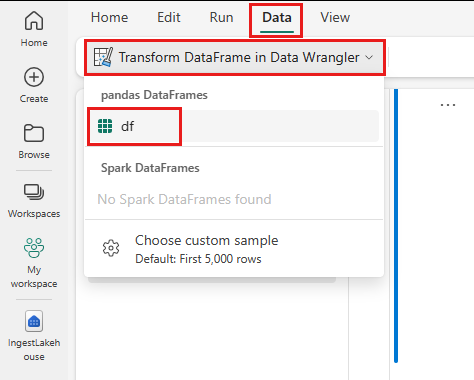
- 在 [筆記本] 功能區 [資料] 索引標籤下,選取 [啟動 Data Wrangler]。 您會看到可供編輯的已啟動 pandas DataFrame 清單。
- 選取您想要在 Data Wrangler 中開啟的 DataFrame。 由於此筆記本只包含一個 DataFrame
df,請選取df。
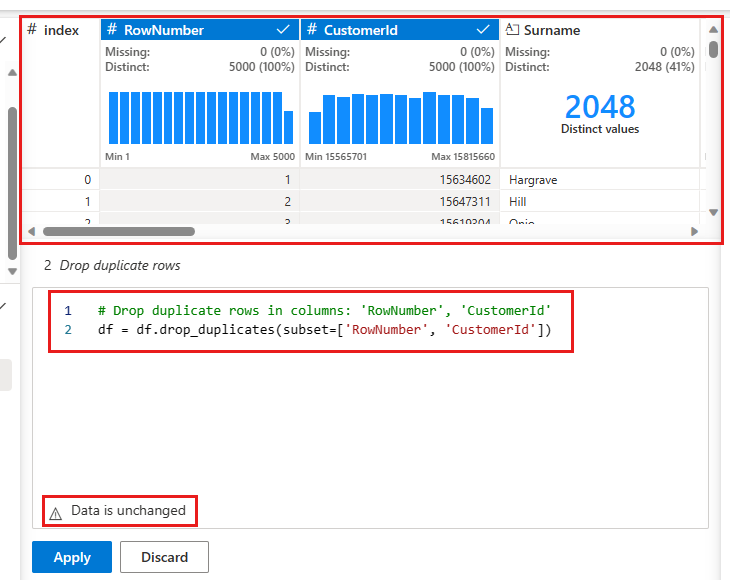
Data Wrangler 會啟動並產生資料的描述性概觀。 中間的資料表會顯示每個資料行。 資料表旁的 [摘要] 面板會顯示 DataFrame 的相關資訊。 當您在資料表中選取資料行時,摘要會更新有關所選資料行的資訊。 在某些情況下,顯示和摘要的資料將會是 DataFrame 的截斷檢視。 出現這種情況時,您會在摘要窗格中看到警告影像。 將滑鼠停留在此警告上方,檢視說明情況的文字。
您所做的每項作業都只需按下即可套用,即時更新資料顯示並產生程式碼,您可以將其作為可重複使用的函數儲存回筆記本。
本節的其餘部分會逐步引導您完成使用 Data Wrangler 執行資料清理的步驟。
卸除重複資料列
左側面板上是您可以對資料集執行的作業清單 (例如 [尋找並取代]、[格式]、[公式]、[數值])。
展開 [尋找並取代],然後選取 [卸除重複資料列]。
![此螢幕擷取畫面在 [尋找並取代] 下顯示 [卸除重複資料列]。](media/tutorial-data-science-explore-notebook/expand-section.png)
此時會出現一個面板,供您選取要比較的資料行清單,以定義重複資料列。 選取 [RowNumber] 和 [CustomerId]。
中間面板中是此作業結果的預覽。 預覽底下是執行作業的程式碼。 在此執行個體中,資料似乎不會變更。 但由於您正在查看截斷的檢視,所以最好仍然套用該作業。
選取 [套用] (位於側邊或底部),以移至下一個步驟。
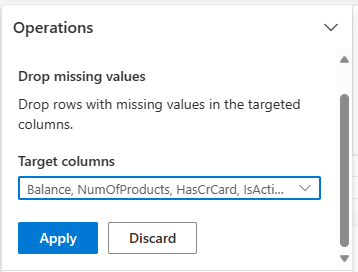
卸除遺漏資料的資料列
使用 Data Wrangler 卸除所有資料行遺漏資料的資料列。
卸除資料行
使用 Data Wrangler 卸除不需要的資料行。
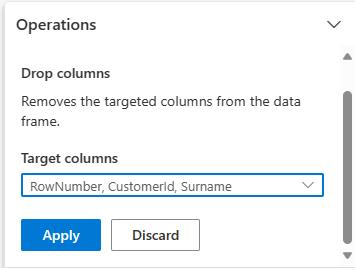
展開 [結構描述],然後選取 [卸除資料行]。
選取 [RowNumber]、[CustomerId]、[Surname]。 這些資料行會在預覽中以紅色顯示,以顯示程式碼已變更的資料行 (在此案例中為已卸除。)
選取 [套用] 以移至下一個步驟。
將程式碼新增至筆記本
每次選取 [套用] 時,會在左下方的 [清除步驟] 面板中建立新的步驟。 在面板底部,選取 [針對所有步驟的預覽程式碼],以檢視所有單獨步驟的組合。
選取左上方的 [將程式碼新增至筆記本],以關閉 Data Wrangler 並自動新增程式碼。 [將程式碼新增至筆記本] 會將程式碼包裝在函數中,然後呼叫函數。
![螢幕擷取畫面顯示預覽程式碼,以及存取 [新增至筆記本] 的位置。](media/tutorial-data-science-explore-notebook/add-to-notebook.png)
提示
在您手動執行新的儲存格之前,將不會套用 Data Wrangler 所產生的程式碼。
如果您未使用 Data Wrangler,可以改用此下一個程式碼儲存格。
此程式碼類似於 Data Wrangler 所產生的程式碼,但會將引數 inplace=True 新增至每個產生的步驟。 藉由設定 inplace=True,pandas 會覆寫原始 DataFrame,而不是產生新的 DataFrame 作為輸出。
# Modified version of code generated by Data Wrangler
# Modification is to add in-place=True to each step

# Define a new function that include all above Data Wrangler operations
def clean_data(df):
    # Drop rows with missing data across all columns
    df.dropna(inplace=True)
    # Drop duplicate rows in columns: 'RowNumber', 'CustomerId'
    df.drop_duplicates(subset=['RowNumber', 'CustomerId'], inplace=True)
    # Drop columns: 'RowNumber', 'CustomerId', 'Surname'
    df.drop(columns=['RowNumber', 'CustomerId', 'Surname'], inplace=True)
    return df

df_clean = clean_data(df.copy())
df_clean.head()
探索資料
顯示已清理資料的一些摘要和視覺效果。
判定類別、數值和目標屬性
使用此程式碼來判定類別、數值和目標屬性。
# Determine the dependent (target) attribute
dependent_variable_name = "Exited"
print(dependent_variable_name)
# Determine the categorical attributes
categorical_variables = [col for col in df_clean.columns if col in "O"
                        or df_clean[col].nunique() <=5
                        and col not in "Exited"]
print(categorical_variables)
# Determine the numerical attributes
numeric_variables = [col for col in df_clean.columns if df_clean[col].dtype != "object"
                        and df_clean[col].nunique() >5]
print(numeric_variables)
五個數位摘要
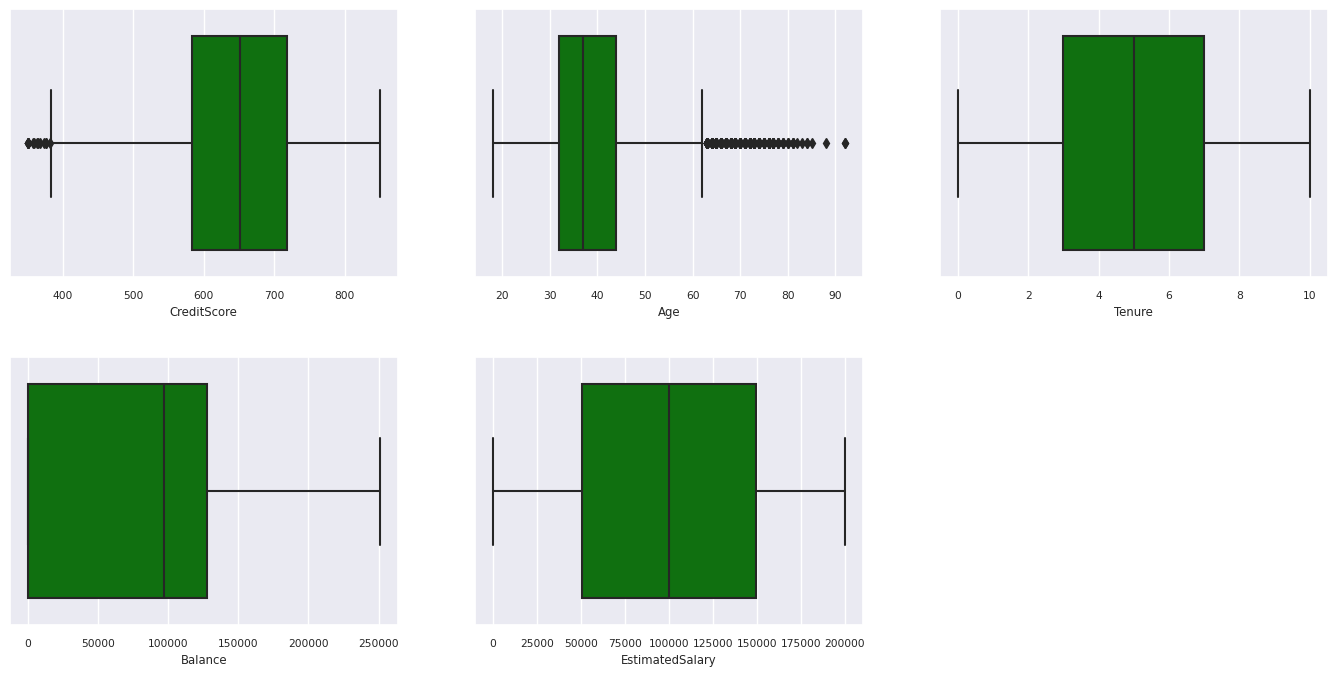
使用方塊圖顯示數值屬性的五個數位摘要 (最小值、第一分位數、中位數、第三分位數、最大分數)。
df_num_cols = df_clean[numeric_variables]
sns.set(font_scale = 0.7)
fig, axes = plt.subplots(nrows = 2, ncols = 3, gridspec_kw =  dict(hspace=0.3), figsize = (17,8))
fig.tight_layout()
for ax,col in zip(axes.flatten(), df_num_cols.columns):
    sns.boxplot(x = df_num_cols[col], color='green', ax = ax)
fig.delaxes(axes[1,2])
離開和未離開客戶的分佈
顯示已離開與未離開客戶在類別屬性之間的分佈。
attr_list = ['Geography', 'Gender', 'HasCrCard', 'IsActiveMember', 'NumOfProducts', 'Tenure']
fig, axarr = plt.subplots(2, 3, figsize=(15, 4))
for ind, item in enumerate (attr_list):
    sns.countplot(x = item, hue = 'Exited', data = df_clean, ax = axarr[ind%2][ind//2])
fig.subplots_adjust(hspace=0.7)
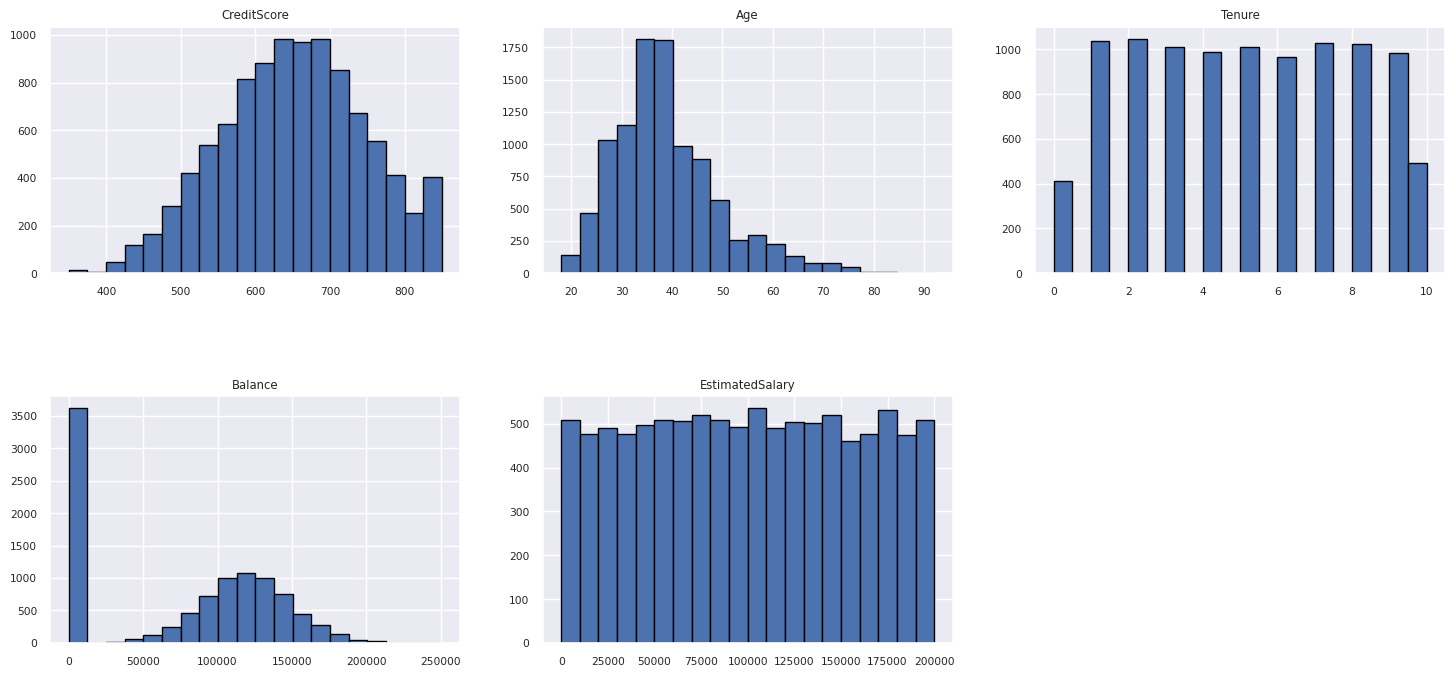
數值屬性的分佈
使用色階分佈圖顯示數值屬性的頻率分佈。
columns = df_num_cols.columns[: len(df_num_cols.columns)]
fig = plt.figure()
fig.set_size_inches(18, 8)
length = len(columns)
for i,j in itertools.zip_longest(columns, range(length)):
    plt.subplot((length // 2), 3, j+1)
    plt.subplots_adjust(wspace = 0.2, hspace = 0.5)
    df_num_cols[i].hist(bins = 20, edgecolor = 'black')
    plt.title(i)
plt.show()
執行特徵工程
執行特徵工程,根據目前屬性產生新的屬性:
df_clean["NewTenure"] = df_clean["Tenure"]/df_clean["Age"]
df_clean["NewCreditsScore"] = pd.qcut(df_clean['CreditScore'], 6, labels = [1, 2, 3, 4, 5, 6])
df_clean["NewAgeScore"] = pd.qcut(df_clean['Age'], 8, labels = [1, 2, 3, 4, 5, 6, 7, 8])
df_clean["NewBalanceScore"] = pd.qcut(df_clean['Balance'].rank(method="first"), 5, labels = [1, 2, 3, 4, 5])
df_clean["NewEstSalaryScore"] = pd.qcut(df_clean['EstimatedSalary'], 10, labels = [1, 2, 3, 4, 5, 6, 7, 8, 9, 10])
使用 Data Wrangler 執行獨熱編碼
Data Wrangler 也可用於執行獨熱編碼。 若要這樣做,請重新開啟 Data Wrangler。 這次,請選取 df_clean 資料。
- 展開 [公式],然後選取 [獨熱編碼]。
- 此時會出現一個面板,供您選取要執行獨熱編碼的資料行清單。 選取 [地理位置] 和 [性別]。
您可以複製產生的程式碼、關閉 Data Wrangler 以返回筆記本,然後貼到新的儲存格中。 或者,選取左上方的 [將程式碼新增至筆記本],以關閉 Data Wrangler 並自動新增程式碼。
如果您未使用 Data Wrangler,可以改用此下一個程式碼儲存格:
# This is the same code that Data Wrangler will generate

import pandas as pd

def clean_data(df_clean):
    # One-hot encode columns: 'Geography', 'Gender'
    df_clean = pd.get_dummies(df_clean, columns=['Geography', 'Gender'])
    return df_clean

df_clean_1 = clean_data(df_clean.copy())
df_clean_1.head()
探索式資料分析的觀察摘要
- 與西班牙和德國相比,大部分客戶來自法國,而與法國和德國相比,西班牙的客戶流失率最低。
- 大部分的客戶都擁有信用卡。
- 有些客戶年齡和信用分數分別在 60 歲以上和 400 分以下,但不能被視為極端值。
- 只有極少客戶擁有兩個以上的銀行產品。
- 未在作用中的客戶流失率較高。
- 性別和會員年資似乎不會影響客戶關閉銀行賬戶的決定。
建立已清理資料的差異資料表
您將在本系列的下一個筆記本中使用此資料。
table_name = "df_clean"
# Create Spark DataFrame from pandas
sparkDF=spark.createDataFrame(df_clean_1)
sparkDF.write.mode("overwrite").format("delta").save(f"Tables/{table_name}")
print(f"Spark dataframe saved to delta table: {table_name}")
後續步驟
使用此資料訓練和註冊機器學習模型:

