在 Power BI 服务中通过 Excel 文件创建报表
适用范围:Power BI Desktop
Power BI 服务
你已经阅读了 Power BI 中的报表,并且现在想要创建你自己的仪表板。 有不同的方法可创建报表。 在本文中,我们首先通过 Excel 文件在 Power BI 服务中创建基本报表。 了解创建报表的基础知识后,请查看相关内容阅读更多文章。
先决条件
导入 Excel 文件
此创建报表的方法从文件和空白报表画布开始。 如果希望进一步了解,下载零售分析示例 Excel 文件并将其保存到计算机或 OneDrive 工作版或学校版。
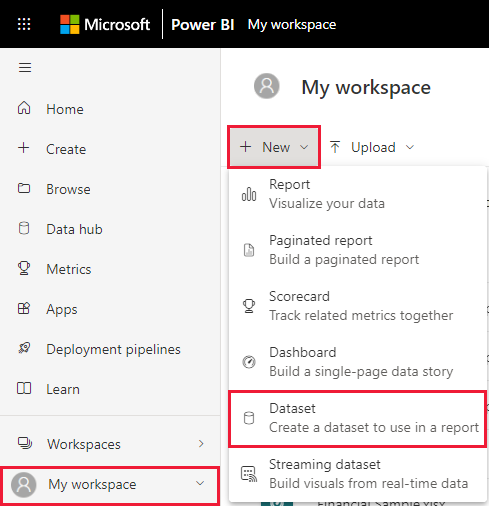
在导航窗格中,选择“我的工作区” 。 然后选择“新建”>“语义模型”。
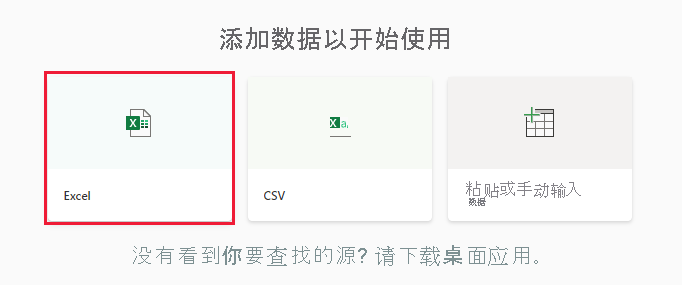
选择“Excel”。
选择“浏览此设备”。 转到你保存零售分析示例的位置,然后选择“打开”。

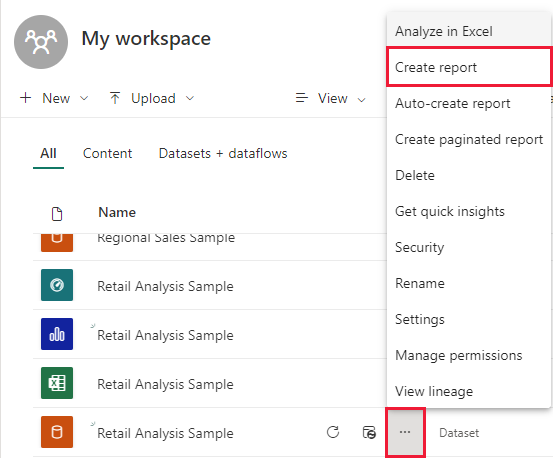
导入 Excel 文件后,该文件将作为语义模型列于工作区列表中。
在语义模型旁边,选择“更多选项(...)”,然后选择“创建报表”。
此时将打开报表编辑器。
提示
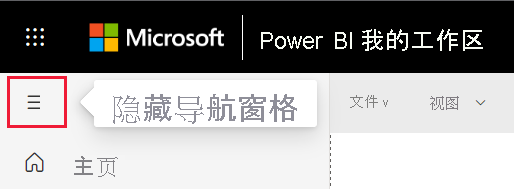
选择菜单图标以隐藏导航窗格,从而留出更多空间。
向报表添加径向仪表
在导入语义模型后,我们来回答一些问题。 我们的首席营销官 (CMO) 想要知道公司距离本年度的销售目标还有多远。 了解对于使用 Power BI 报表中的可视化效果显示此类信息而言,仪表如何是一个不错的可视化效果选择。
在“数据”窗格中,选择“销售额”>“本年度销售额”>“总销售额差额”。
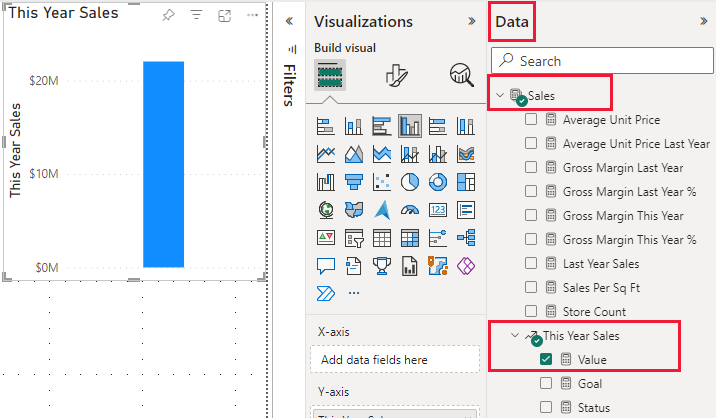
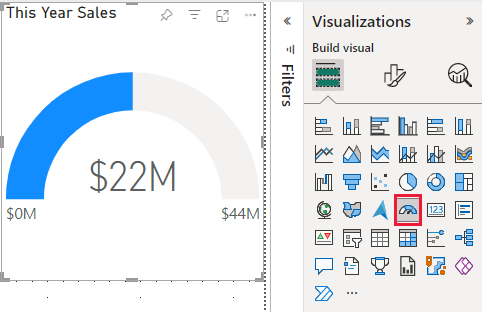
从“可视化效果”窗格中,选择仪表模板
 图标,将视觉对象转换为仪表。
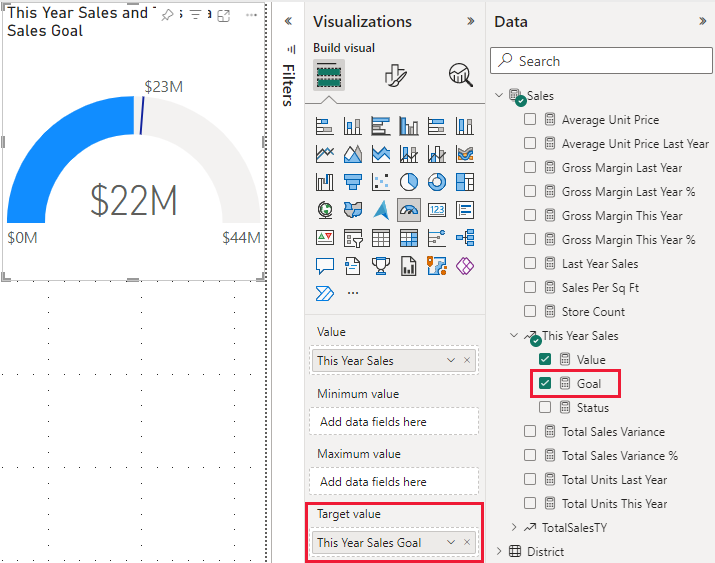
将“销售额”>“本年度销售额”>“目标”拖动到“目标值”框。 似乎已经接近我们的目标。
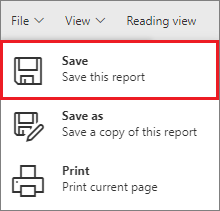
现在就可以保存报表了。
向报表添加区域图表和切片器
CMO 还需要我们回答一些其他问题。 他们还希望了解本年度销售额与去年销售额的对比情况。 他们还希望按地区查看结果。
首先,我们在画布上腾出一些空间。 选择仪表,并将它移动到右上角。 然后拖拽任一角并使其变小。
取消选中仪表。 在“数据”窗格中,选择“销售额”>“本年度销售额”>“值”,然后选择“销售额”>“去年销售额”。
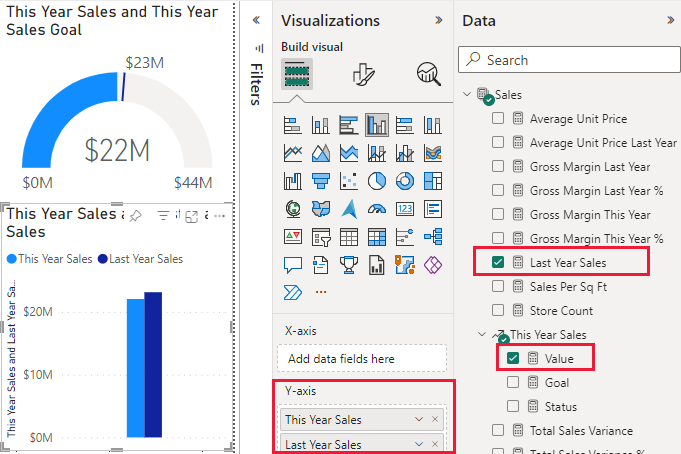
从“可视化效果”窗格中,选择区域图表模板
 ,将视觉对象转换为区域图表。
选择“时间”>“时间段”以将其添加到“X 轴”框。
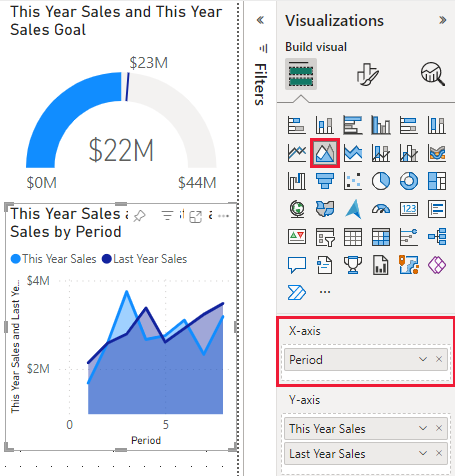
若要对可视化效果按时间段排序,请选择省略号,然后选择“按时间段排序”。
现在添加切片器。 选择画布上的空白区域,然后选择切片器
 模板。 现在画布上有一个空切片器。
从“数据”窗格中,选择“地区”>“地区”。 移动切片器并重设切片器大小。
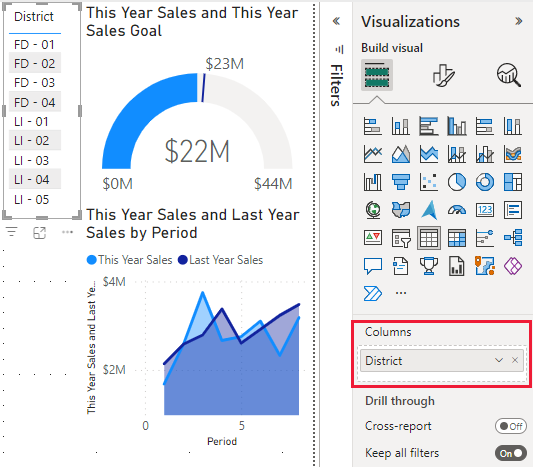
使用切片器按地区查找模式和见解。
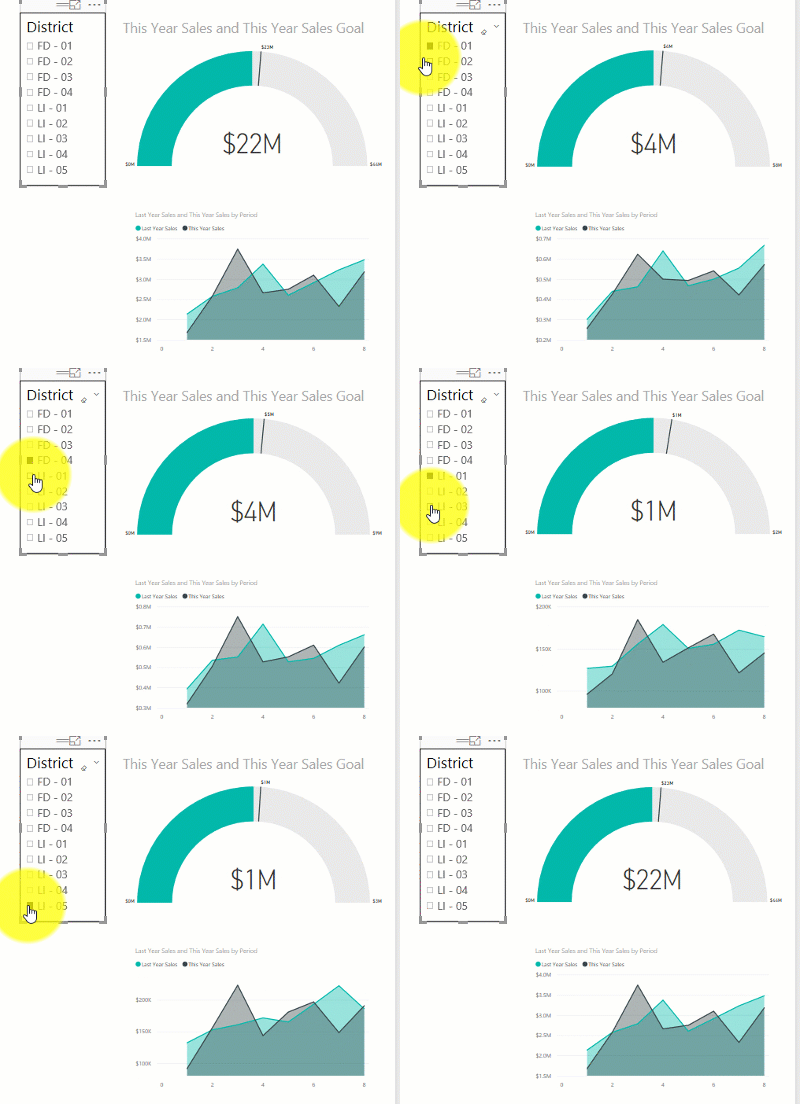
继续浏览数据并添加可视化效果。 当你发现尤为值得关注的见解时,了解如何使用从报表创建 Power BI 仪表板将它们固定到仪表板。
