你当前正在访问 Microsoft Azure Global Edition 技术文档网站。 如果需要访问由世纪互联运营的 Microsoft Azure 中国技术文档网站,请访问 https://docs.azure.cn。
将气泡层添加地图
本文介绍如何将数据源中的点数据呈现为地图上的气泡层。 气泡层将点呈现为地图上具有固定像素半径的圆。
提示
默认情况下,气泡层将呈现数据源中所有几何图形的坐标。 若要限制该层以便仅呈现点几何功能,请将该层的 filter 属性设置为 ['==', ['geometry-type'], 'Point'] 或 ['any', ['==', ['geometry-type'], 'Point'], ['==', ['geometry-type'], 'MultiPoint']](如果还想包含 MultiPoint 特征)。
添加气泡层
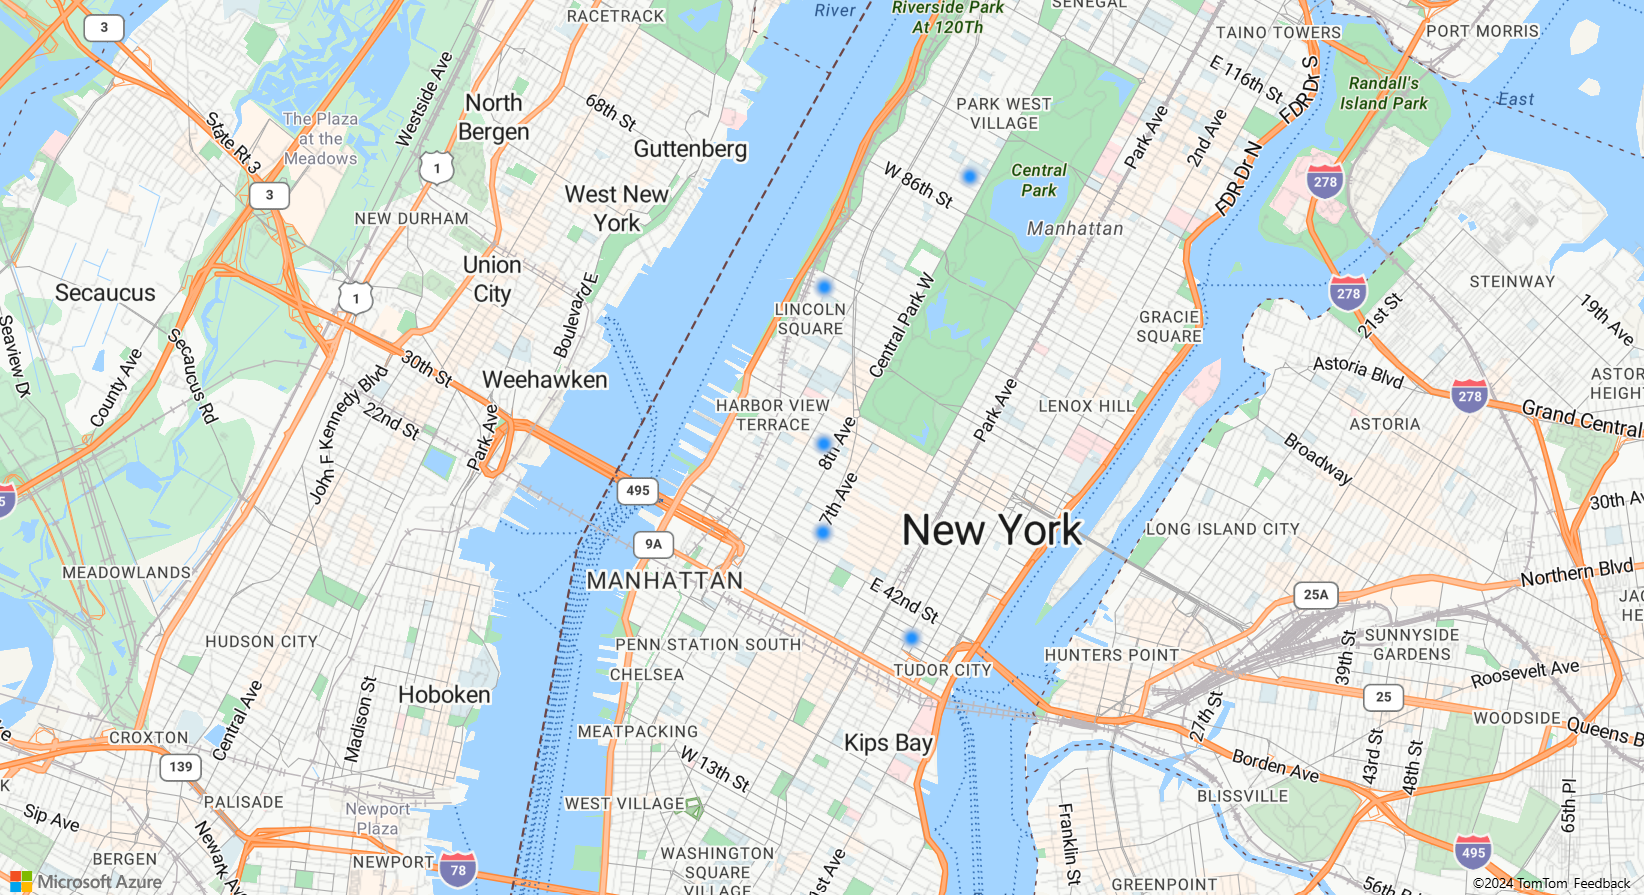
下面的代码将一个点数组加载到数据源中。 然后会将数据点连接到气泡层。 气泡层以六个像素的半径和三个像素的笔画宽度渲染每个气泡。
/*Ensure that the map is fully loaded*/
map.events.add("load", function () {

  /*Add point locations*/
  var points = [
    new atlas.data.Point([-73.985708, 40.75773]),
    new atlas.data.Point([-73.985600, 40.76542]),
    new atlas.data.Point([-73.985550, 40.77900]),
    new atlas.data.Point([-73.975550, 40.74859]),
    new atlas.data.Point([-73.968900, 40.78859])]

  /*Create a data source and add it to the map*/
  var dataSource = new atlas.source.DataSource();
  map.sources.add(dataSource);
  /*Add the points to the data source*/
  dataSource.add(points);

  //Create a bubble layer to render the filled in area of the circle, and add it to the map.*/
  map.layers.add(new atlas.layer.BubbleLayer(dataSource, null, {
    radius: 6,
    strokeColor: "LightSteelBlue",
    strokeWidth: 3,
    color: "DodgerBlue",
    blur: 0.5
  }));
});

显示具有气泡层的标签
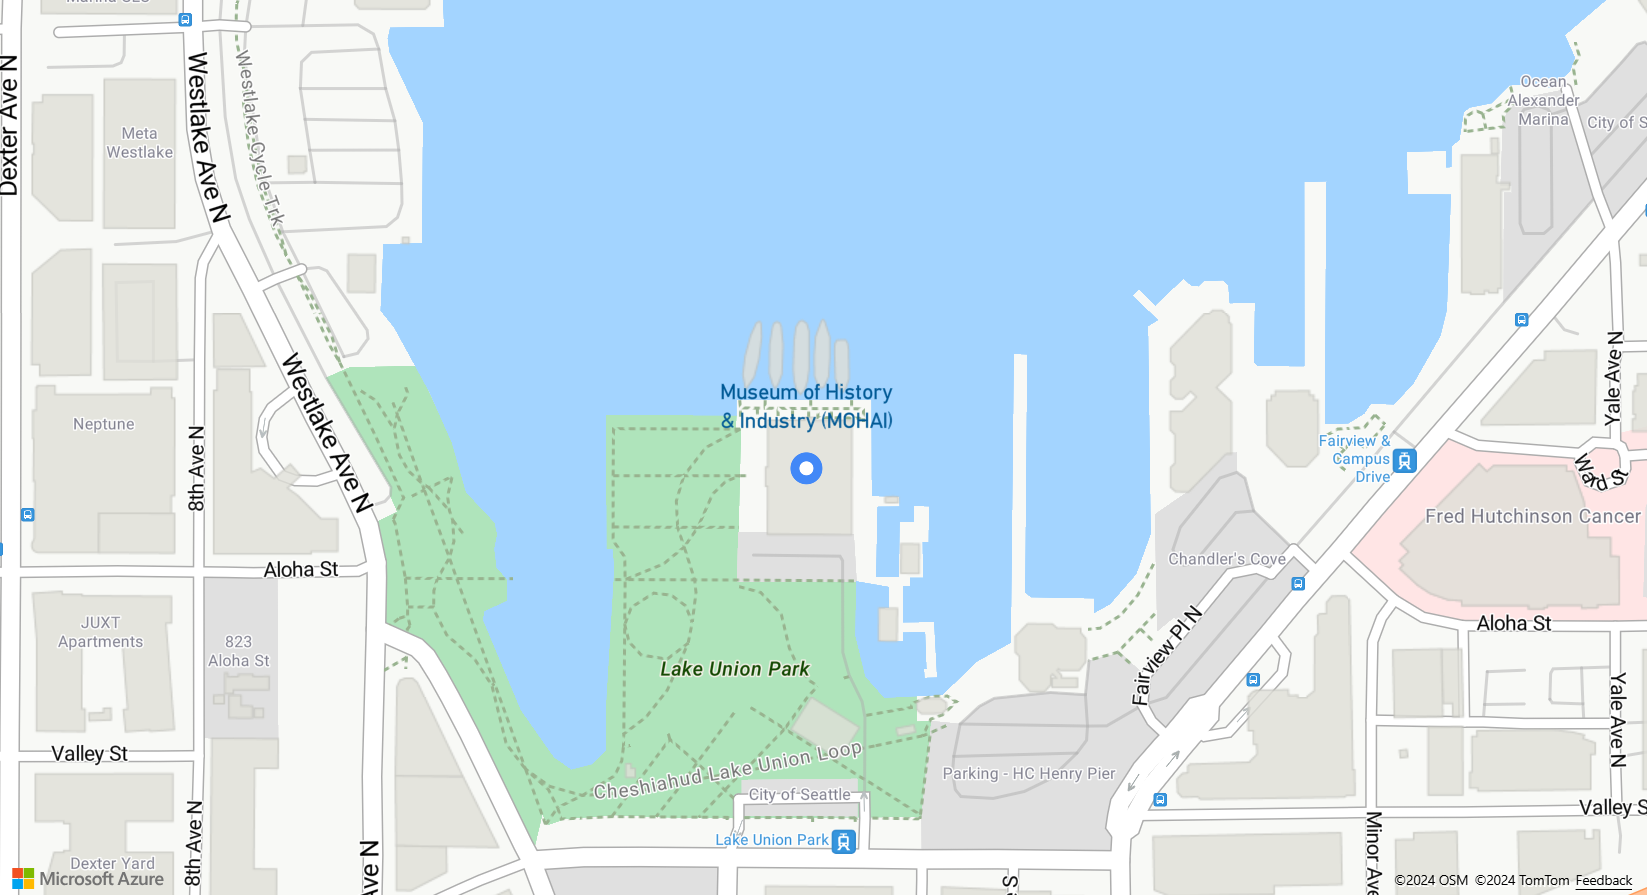
此代码演示如何使用气泡层在地图上呈现点,以及如何使用符号层来呈现标签。 若要隐藏符号层的图标,请将图标选项的 image 属性设置为 none。
//Create an instance of the map control and set some options.
 function InitMap() {

    var map = new atlas.Map('myMap', {
    center: [-122.336641, 47.627631],
    zoom: 16,
    view: "Auto",
        authOptions: {
            authType: 'subscriptionKey',
            subscriptionKey: '{Your-Azure-Maps-Subscription-key}'
        }
    });

    /*Ensure that the map is fully loaded*/
    map.events.add("load", function () {

        /*Create point object*/
        var point =  new atlas.data.Point([-122.336641,47.627631]);

        /*Create a data source and add it to the map*/
        var dataSource = new atlas.source.DataSource();
        map.sources.add(dataSource);
        dataSource.add(point);

        map.layers.add(new atlas.layer.BubbleLayer(dataSource, null, {
            radius: 5,
            strokeColor: "#4288f7",
            strokeWidth: 6,
            color: "white"
        }));

        //Add a layer for rendering point data.
        map.layers.add(new atlas.layer.SymbolLayer(dataSource, null, {
            iconOptions: {
                //Hide the icon image.
                image: "none"
            },

            textOptions: {
                textField: "Museum of History & Industry (MOHAI)",
                color: "#005995",
                offset: [0, -2.2]
            },
        }));
    });
}

自定义气泡层
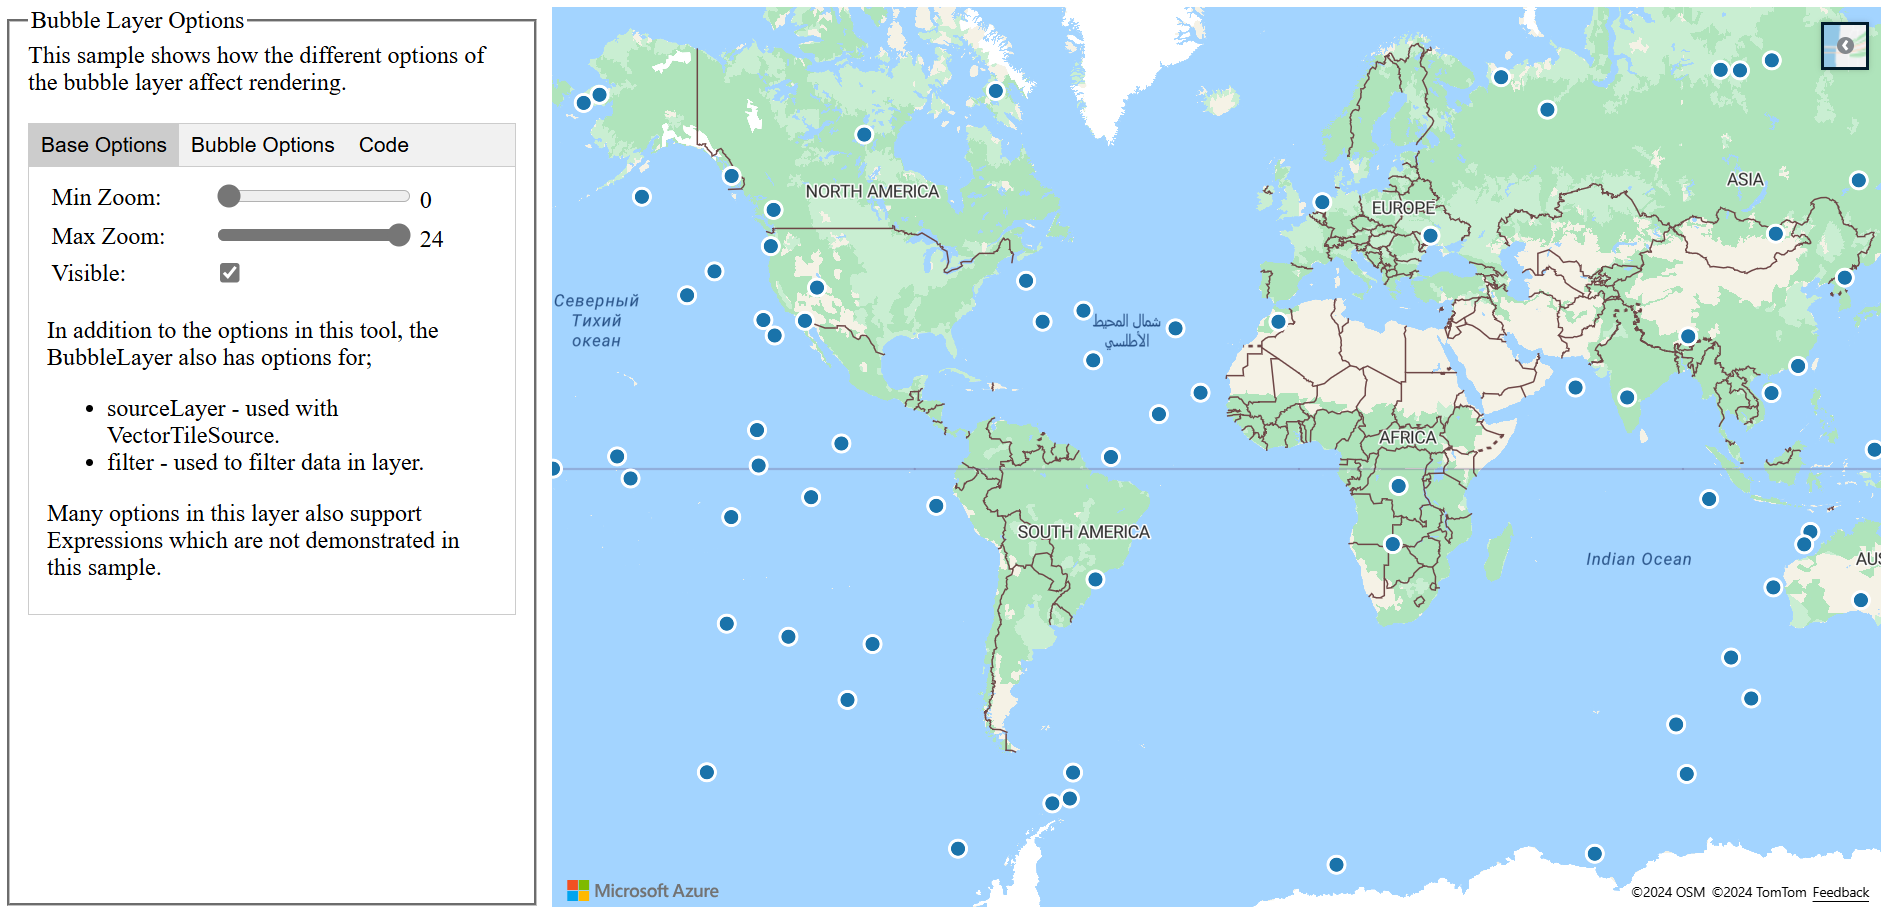
气泡层只有几个样式选项。 使用气泡层选项示例来尝试操作。有关此示例的源代码,请参阅气泡层选项源代码。

后续步骤
详细了解本文中使用的类和方法:
有关可向地图添加的更多代码示例,请参阅以下文章: