你当前正在访问 Microsoft Azure Global Edition 技术文档网站。 如果需要访问由世纪互联运营的 Microsoft Azure 中国技术文档网站,请访问 https://docs.azure.cn。
创建数据源
Azure Maps Web SDK 将数据存储在数据源中。 使用数据源可优化用于查询和渲染的数据操作。 目前数据源有两种类型:
- GeoJSON 源:在本地管理 GeoJSON 格式的原始位置数据。 适合中小型数据集(数十万个形状以上)。
- 矢量图块源:基于地图图块系统,为当前的地图视图加载矢量图块格式的数据。 适合大型乃至超大型数据集(数百万或数十亿个形状)。
GeoJSON 数据源
基于 GeoJSON 的数据源使用 DataSource 类本地加载和存储数据。 GeoJSON 数据可以手动创建,也可以使用 atlas.data 命名空间中的帮助程序类创建。 DataSource 类提供导入本地或远程 GeoJSON 文件的功能。 远程 GeoJSON 文件必须托管在已启用 COR 的终结点上。 DataSource 类提供聚集点数据的功能。 而且,使用 DataSource 类可以轻松地添加、删除和更新数据。 以下代码演示了如何在 Azure Maps 中创建 GeoJSON 数据。
//Create raw GeoJSON object.
var rawGeoJson = {
     "type": "Feature",
     "geometry": {
         "type": "Point",
         "coordinates": [-100, 45]
     },
     "properties": {
         "custom-property": "value"
     }
};

//Create GeoJSON using helper classes (less error prone and less typing).
var geoJsonClass = new atlas.data.Feature(new atlas.data.Point([-100, 45]), {
    "custom-property": "value"
});
创建后,可以通过 map.sources 属性将数据源添加到地图中,作为 SourceManager。 以下代码演示了如何创建 DataSource 并将其添加到地图中。
//Create a data source and add it to the map.
var source = new atlas.source.DataSource();
map.sources.add(source);
以下代码演示了将 GeoJSON 数据添加到 DataSource 的不同方式。
//GeoJsonData in the following code can be a single or array of GeoJSON features or geometries, a GeoJSON feature collection, or a single or array of atlas.Shape objects.

//Add geoJSON object to data source.
source.add(geoJsonData);

//Load geoJSON data from URL. URL should be on a CORs enabled endpoint.
source.importDataFromUrl(geoJsonUrl);

//Overwrite all data in data source.
source.setShapes(geoJsonData);
提示
假设你希望覆盖 DataSource 中的所有数据。 如果依次调用 clear 和 add 函数,则地图可能会重新渲染两次,这可能会导致一些延迟。 相反,使用 setShapes 函数将删除和替代数据源中的所有数据,并且仅触发一次映射重新渲染。
矢量图块源
矢量图块源介绍如何访问矢量图块层。 使用 VectorTileSource 类实例化矢量图块源。 矢量图块层与图块层类似,但不同。 图块层是光栅图像。 矢量图块层是压缩文件,为 PBF 格式。 此压缩文件包含矢量地图数据以及一个或多个层。 根据每层的样式,可以在客户端渲染文件并设计文件样式。 矢量图块中的数据包含点、线和多边形形式的地理功能。 相比光栅图块层,使用矢量图块层有多种优势:
- 矢量图块的文件大小通常比等效的光栅图块小得多。 因此,使用的带宽更少。 这意味着延迟较低、地图较快和用户体验更好。
- 由于矢量图块在客户端渲染,所以它们会适应要显示它们的设备的分辨率。 因此,渲染的地图看起来更清晰,可清楚地看到标签。
- 更改矢量地图中的数据样式不需要重新下载数据,因为新样式可应用于客户端。 相反,更改光栅图块层的样式通常需要从服务器加载图块,然后再应用新样式。
- 由于数据以矢量形式传递,所以准备数据所需的服务器端处理更少。 因此,可以更快地提供较新的数据。
Azure Maps 遵循开放式标准 - Mapbox 矢量图块规范。 Azure Maps 在平台中提供以下矢量图块服务:
- 道路图块
- 交通事故
- 流量流
- 使用 Azure Maps Creator,还可以通过 Render - 获取地图图块 API 创建和访问自定义矢量图块
提示
通过 Web SDK 使用 Azure Maps 渲染服务中的矢量或光栅图块时,可以使用占位符 {azMapsDomain} 替代 atlas.microsoft.com。 此占位符将替换为地图使用的相同域,还会自动附加相同的身份验证详细信息。 这样可大大简化使用 Microsoft Entra 身份验证时通过呈现服务进行的身份验证。
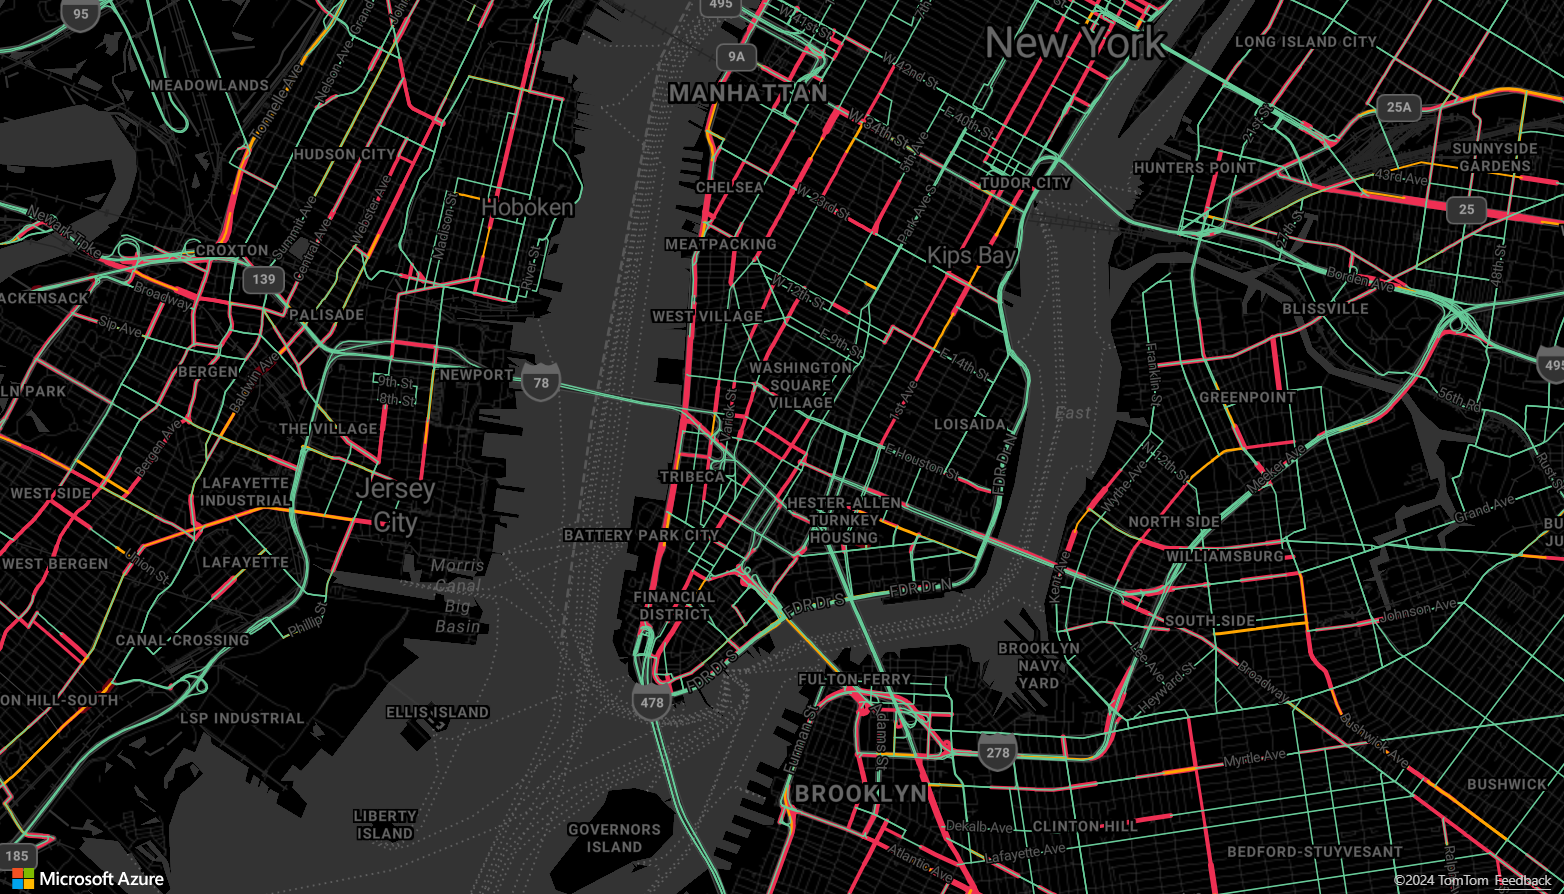
要在地图上显示矢量图块源中的数据,请将该源连接到数据渲染层之一。 使用矢量源的所有层都必须在选项中指定一个 sourceLayer 值。 以下代码可将 Azure Maps 交通流矢量图块服务加载为矢量图块源,然后使用线条层在地图上进行显示。 该矢量图块源在源层中有一个数据集,称为“交通流”。 此数据集中的线条数据包含一个 traffic_level 属性,在此代码中用于选择颜色和缩放线条大小。
//Create a vector tile source and add it to the map.
var source = new atlas.source.VectorTileSource(null, {
    tiles: ['https://{azMapsDomain}/traffic/flow/tile/pbf?api-version=1.0&style=relative&zoom={z}&x={x}&y={y}'],
    maxZoom: 22
});
map.sources.add(source);

//Create a layer for traffic flow lines.
var flowLayer = new atlas.layer.LineLayer(source, null, {
    //The name of the data layer within the data source to pass into this rendering layer.
    sourceLayer: 'Traffic flow',

    //Color the roads based on the traffic_level property.
    strokeColor: [
        'interpolate',
        ['linear'],
        ['get', 'traffic_level'],
        0, 'red',
        0.33, 'orange',
        0.66, 'green'
    ],

    //Scale the width of roads based on the traffic_level property.
        strokeWidth: [
        'interpolate',
        ['linear'],
        ['get', 'traffic_level'],
        0, 6,
        1, 1
    ]
});

//Add the traffic flow layer below the labels to make the map clearer.
map.layers.add(flowLayer, 'labels');
有关如何在地图上显示矢量图块源数据的完整有效示例,请参阅 Azure Maps 示例中的矢量图块线条层。 有关此示例的源代码,请参阅矢量图块线条层示例代码。

将数据源连接到层
使用渲染层在地图上渲染数据。 一个或多个呈现层可以引用单个数据源。 以下渲染层需要数据源:
- 气泡层 - 将点数据渲染为地图上的缩放圆圈。
- 符号层 - 将点数据呈现为图标或文本。
- 热度地图层 - 将点数据渲染为密度热度地图。
- 线条层 - 渲染线条和/或渲染多边形边框。
- 多边形层 - 使用纯色或图像图案填充多边形区域。
以下代码演示了如何创建数据源,将其添加到地图中,然后将其连接到气泡层。 然后,从远程位置向数据源中导入 GeoJSON 点数据。
//Create a data source and add it to the map.
var source = new atlas.source.DataSource();
map.sources.add(source);

//Create a layer that defines how to render points in the data source and add it to the map.
map.layers.add(new atlas.layer.BubbleLayer(source));

//Load the earthquake data.
source.importDataFromUrl('https://earthquake.usgs.gov/earthquakes/feed/v1.0/summary/significant_month.geojson');
还有其他渲染层不会连接到这些数据源,而是直接加载数据以进行渲染。
包含多个层的单个数据源
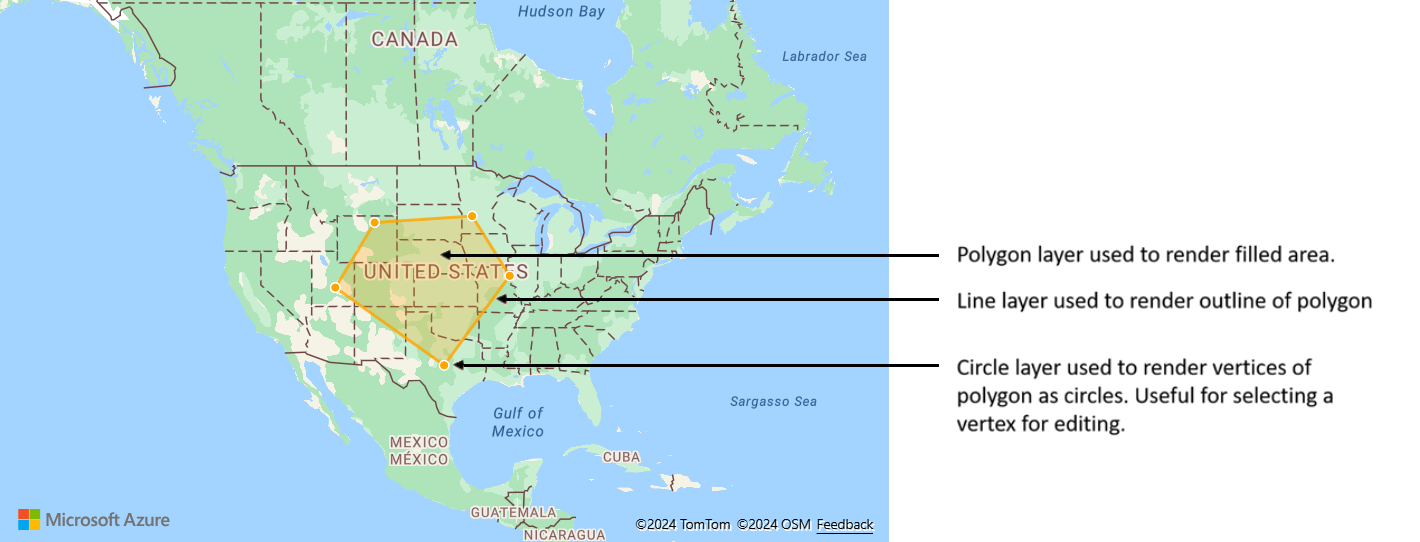
可将多个层连接到单个数据源。 在许多不同方案中,这种选择都很有用。 例如,假设用户绘制多边形的场景。 当用户向地图中添加点时,我们应渲染并填充多边形区域。 如果对多边形边框添加样式化的线条,用户在绘制时则可以更清晰地看到多边形的边缘。 若要方便地编辑多边形中的单个位置,可以在每个位置上添加图柄,如单边锁定或标记。

大多数地图平台中都需要一个多边形对象、一个线条对象以及用于多边形中各个位置的单边锁定。 由于修改了多边形,因此你需要手动更新线条和单边锁定,这可能很快就变得复杂起来。
使用 Azure Maps,只需在数据源中创建一个多边形,如以下代码所示。
//Create a data source and add it to the map.
var source = new atlas.source.DataSource();
map.sources.add(source);

//Create a polygon and add it to the data source.
source.add(new atlas.data.Feature(
        new atlas.data.Polygon([[[/* Coordinates for polygon */]]]));

//Create a polygon layer to render the filled in area of the polygon.
var polygonLayer = new atlas.layer.PolygonLayer(source, 'myPolygonLayer', {
     fillColor: 'rgba(255,165,0,0.2)'
});

//Create a line layer for greater control of rendering the outline of the polygon.
var lineLayer = new atlas.layer.LineLayer(source, 'myLineLayer', {
     strokeColor: 'orange',
     strokeWidth: 2
});

//Create a bubble layer to render the vertices of the polygon as scaled circles.
var bubbleLayer = new atlas.layer.BubbleLayer(source, 'myBubbleLayer', {
     color: 'orange',
     radius: 5,
     strokeColor: 'white',
     strokeWidth: 2
});

//Add all layers to the map.
map.layers.add([polygonLayer, lineLayer, bubbleLayer]);
提示
使用 map.layers.add 函数向地图中添加层时,可以将现有层的 ID 或实例作为第二个参数传递。 这会告知地图将要添加的新层插入到现有层下方。 除传递层 ID 之外,这种方法还支持以下值。
"labels"- 将新层插入到地图标签层之下。"transit"- 将新层插入到地图道路和中转层之下。
后续步骤
详细了解本文中使用的类和方法:
有关可向地图添加的更多代码示例,请参阅以下文章: