Resource Performance report in Microsoft Intune Advanced Analytics
The resource performance report provides visibility into the performance of processors and RAM in cloud-managed Windows devices and its influence on user experience.
The score helps you identify emerging hardware issues that might be impacting user productivity so you can proactively make improvements before users generate support tickets.
The insights show not only how much your score can improve by upgrading the CPU or RAM in affected devices, but also help you identify resources for replacement before warranties expire.
License requirements
With a Windows 365 license, you get access to this report for the Cloud PCs in your organization.
However, the report for physical devices is part of Intune Advanced Analytics and is included as an Intune-add on under Microsoft Intune Suite and requires an extra cost to the licensing options that include Microsoft Intune.
Prerequisites
For Advanced Analytics capabilities, including resource performance, devices should be cloud-managed; either Intune-only managed or Co-managed.
After enrollment, client devices require a restart to fully enable all analytics.
Note
It may take up to 48 hours after you buy licenses or start a trial to see Resource performance data in your tenant.
Note
Resource performance report is currently not supported in US Government Community Cloud (GCC) High or U.S. Department of Defense (DoD) environments.
Resource performance report
Sign in to the Microsoft Intune admin center.
Select Report > Endpoint analytics > Resource performance.
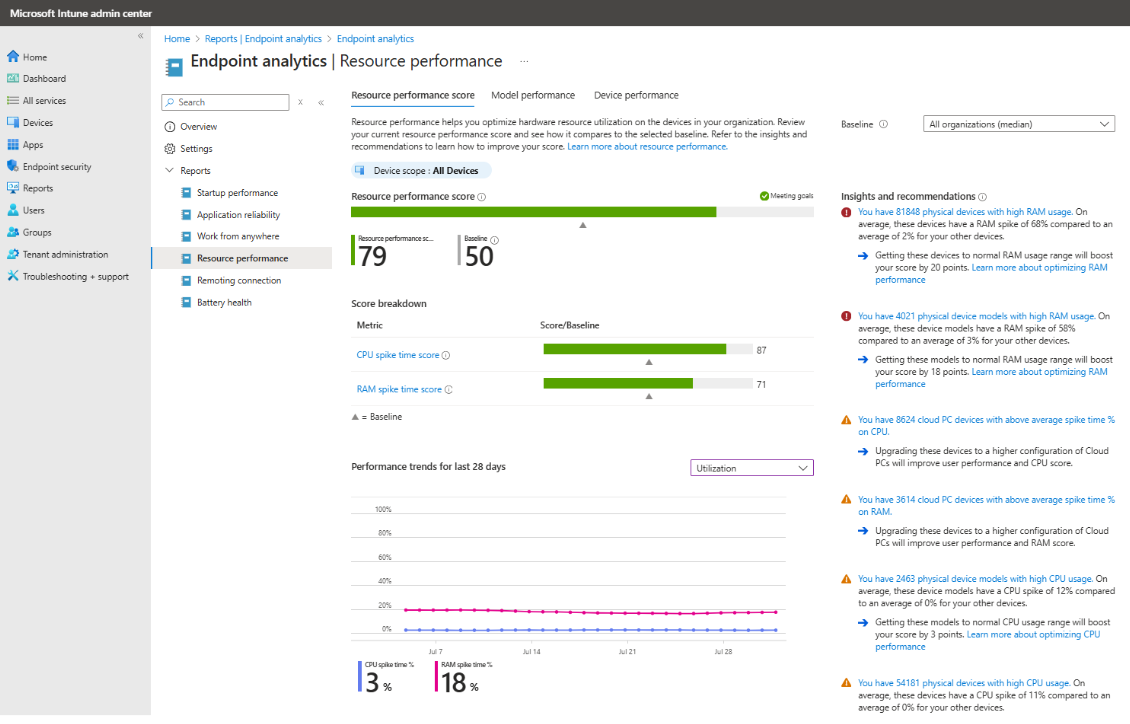
The Resource performance report page shows a Resource performance score tab, Device performance tab, and a Model performance tab. For more information on each of the tabs, see Reporting Tabs.
Resource performance score
The Resource performance score provides an overall performance rating (from 0 to 100) of CPU and RAM for your organization’s Windows physical devices and Cloud PCs.
This score is a weighted average of CPU spike time score and RAM Spike time score.
This score helps identify device resources that need to be replaced to improve user experience and boost productivity.
CPU spike time score
The CPU spike time score (from 0 to 100) is assigned based on the device’s usage duration and the CPU spike time %, which is the percentage of the usage duration in which the device experiences CPU spikes. High usage and spikes indicate a poor experience with the device and result in low scores. Conversely, low spikes indicate a good experience with the device and result in high scores.
CPU spike time %: The daily metric trends graph plots the ratio of CPU spike times to total usage time. This CPU spike % data is averaged over a 14-day period ending on the date at the bottom of the graph.
Usage over 50% is considered a spike.
To improve the performance of CPU in Windows physical devices, you could upgrade the processors by increasing the number of cores or the clock speed, optimize the operating system or adjust power settings.
To improve the performance of CPU in Cloud PCs, you could upgrade to a higher configuration of Cloud PCs.
RAM spike time score
The RAM spike time score (from 0 to 100) is assigned based on the device’s usage duration and the RAM spike time %, which is the percentage of the usage duration in which the device experiences RAM spikes. High usage and spikes indicate a poor experience with the device and result in low scores. Conversely, low spikes indicate a good experience with the device and result in high scores.
RAM spike time %: The daily metric trends graph plots the ratio of RAM spike times to total usage time. This RAM spike % data is averaged over a 14-day period ending on the date at the bottom of the graph. Usage over 50% is considered a spike.
To improve the performance of RAM in Windows physical devices, you could add more RAM, upgrade to higher-speed RAM, or modify UEFI/BIOS settings to optimize utilization.
To improve the performance of RAM in Cloud PCs, you could upgrade to a higher configuration of Cloud PCs.
Baseline helps you see if you're meeting goals. You can set the baseline to the organizational median or a custom value.
Insights and recommendations suggest actions that you can take to improve your scores.
Insights and recommendations
The Resource performance page provides a prioritized list of insights and recommendations, described in this section:
High CPU usage in physical devices
These Windows physical devices experience higher CPU spike % than the rest of the devices in your organization, resulting in poor user experience and lower productivity.
This category has two sub-categories:
Physical devices that experience high CPU spike %.
Physical device models that experience high CPU spike %.
Besides giving visibility into devices that aren’t supporting your user’s goals, these insights also allow you to identify devices with underperforming CPUs that are within warranty and eligible for replacement.
High RAM usage in physical devices
These Windows physical devices experience higher RAM spike % than the rest of the devices in your organization, resulting in poor user experience and lower productivity.
This category has two sub-categories: (1) physical devices that experience high RAM spike % and (2) physical device models that experience high RAM spike %.
Besides giving visibility into devices that aren’t supporting your user’s goals, these insights also allow you to identify devices with underperforming RAM that are within warranty and eligible for replacement.
Cloud PCs
These Windows 365 Cloud PCs experience higher CPU or RAM spike % than the rest of the devices in your organization, resulting in poor user experience and lower productivity.
These insights provide visibility into Cloud PCs that aren’t supporting your user’s goals. Upgrading these devices to a higher configuration of Cloud PCs will improve the user experience.
Reporting tabs
The Resource performance page has reporting tabs that provide support for insights.
The tabs are:
Device performance
Model performance
Device performance tab
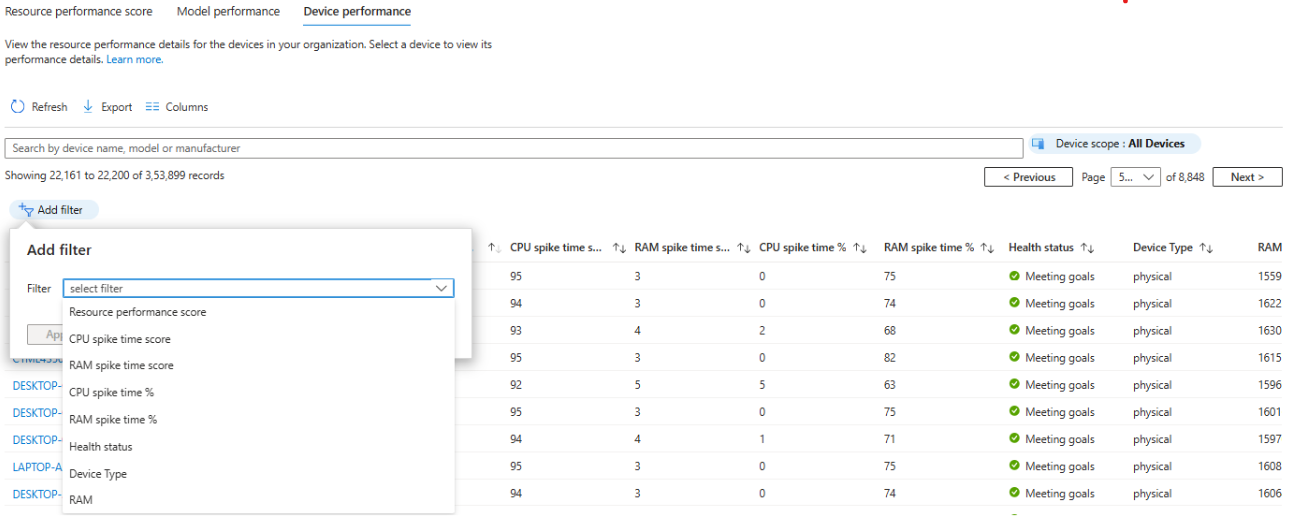
This tab provides CPU and RAM performance metrics and scores for all your Windows physical and Cloud PC devices. You can sort by a particular metric (for example, CPU spike time %) to see which devices have the worst scores for that metric to help with troubleshooting. You can filter the list of devices based on a range of a particular metric (for example, devices with RAM spike time score between 0 and 40). You can also search for a device by name.
Model performance tab
This tab lets you see the CPU and RAM performance metrics and scores by device model, which can help you identify whether problems are isolated to particular models.
Device-level details
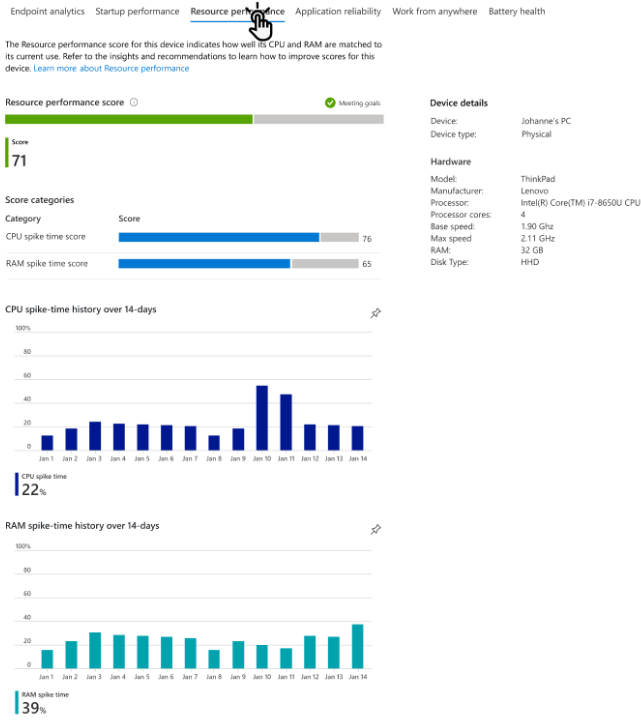
To get details on a specific Windows device in your organization, you can select a device’s name in the Device performance tab. You can also use the filters or search for a device to view the row corresponding to the device you're interested in learning more about.
The device-level details page includes the CPU and RAM spike-time history over the last 14 days for which this data is available. The page also includes device details such as model, manufacturer, processor name, number of processor cores, the processor base speed, RAM, and disk type.
Limitations
Some data points in the report might show -- when not available. When you export the report, data points that aren't available appear as -1 in the generated .csv file.
Health status appears differently in the report and the exported .csv
- HealthStatus .csv value:
0: Unknown1: Insufficient data2: Needs attention3: Meeting goals
- HealthStatus .csv value:
Some columns such as ResourcePerfScore and TotalRamInMB in the generated .csv file have data type double whereas the corresponding columns Resource performance score and RAM in the report have data type int.
Column MachineType in the generated .csv file can take values Physical, CPC, and Others whereas the corresponding column Device Type in the report takes values physical, virtual, and unknown respectively.
Next steps
For more information, go to:


