Use patient outreach analytics (preview) in healthcare data solutions
[This article is prerelease documentation and is subject to change.]
Patient outreach analytics (preview) unifies critical data to enhance patient engagement strategies and evaluate the effectiveness of outreach efforts on appointment scheduling. To learn more about the capability and understand how to deploy and configure it, see:
- Overview of patient outreach analytics (preview)
- Deploy and configure patient outreach analytics (preview)
Understand the transformation mapping
Here are the high-level consecutive steps for the end-to-end execution of the patient outreach analytics (preview) capabilities:
- Ingest & convert bronze lakehouse delta tables into Industry Data Model (IDM) tables in the silver lakehouse.
- Ingest & convert silver lakehouse tables into a semantic model that populates the patient outreach analytics Power BI report.
Bronze to silver conversion
The healthcare#_msft_poa_bronze_silver_transformation notebook transforms and ingests patient outreach analytics data from the bronze lakehouse to the IDM table in the silver lakehouse. Before running the associated data pipeline, ensure you set the configuration constants correctly in the notebook parameters:
Open the notebook healthcare#_msft_poa_bronze_silver_transformation in your healthcare data solutions environment.
Under the Configuration Constants parameters section, provide a value for
customer_insight_profile_id. This value should be the attribute name used for the Dynamics 365 Customer Insights profile ID.
If you don't have the Customer Insights solution installed, skip these steps.
Silver to gold conversion
The healthcare#_msft_poa_silver_gold_tranformation notebook generates a gold model that provides data to the patient outreach analytics Power BI report.
Appointments attribution
The Appointments to Journey Event attribution functionality links appointments to journey events, enabling the report to display which appointments result from specific journeys. This heuristic applies the following predefined assumptions:
- The patient in the appointment record must have one or more marketing interactions, such as emails, SMS, or push notifications.
- The marketing interaction must occur a set number of days before the appointment is booked.
- The appointment’s service type should match the service type of the journey. The service type, a FHIR codeable concept, references an appointment in FHIR.
During capability installation, you can adjust the Minimum days_from_journey variable to set the interval between the appointment booking date and the marketing event. The default value is 30 days.
Run the patient outreach analytics data pipeline
To load patient engagement data into your healthcare data solutions environment:
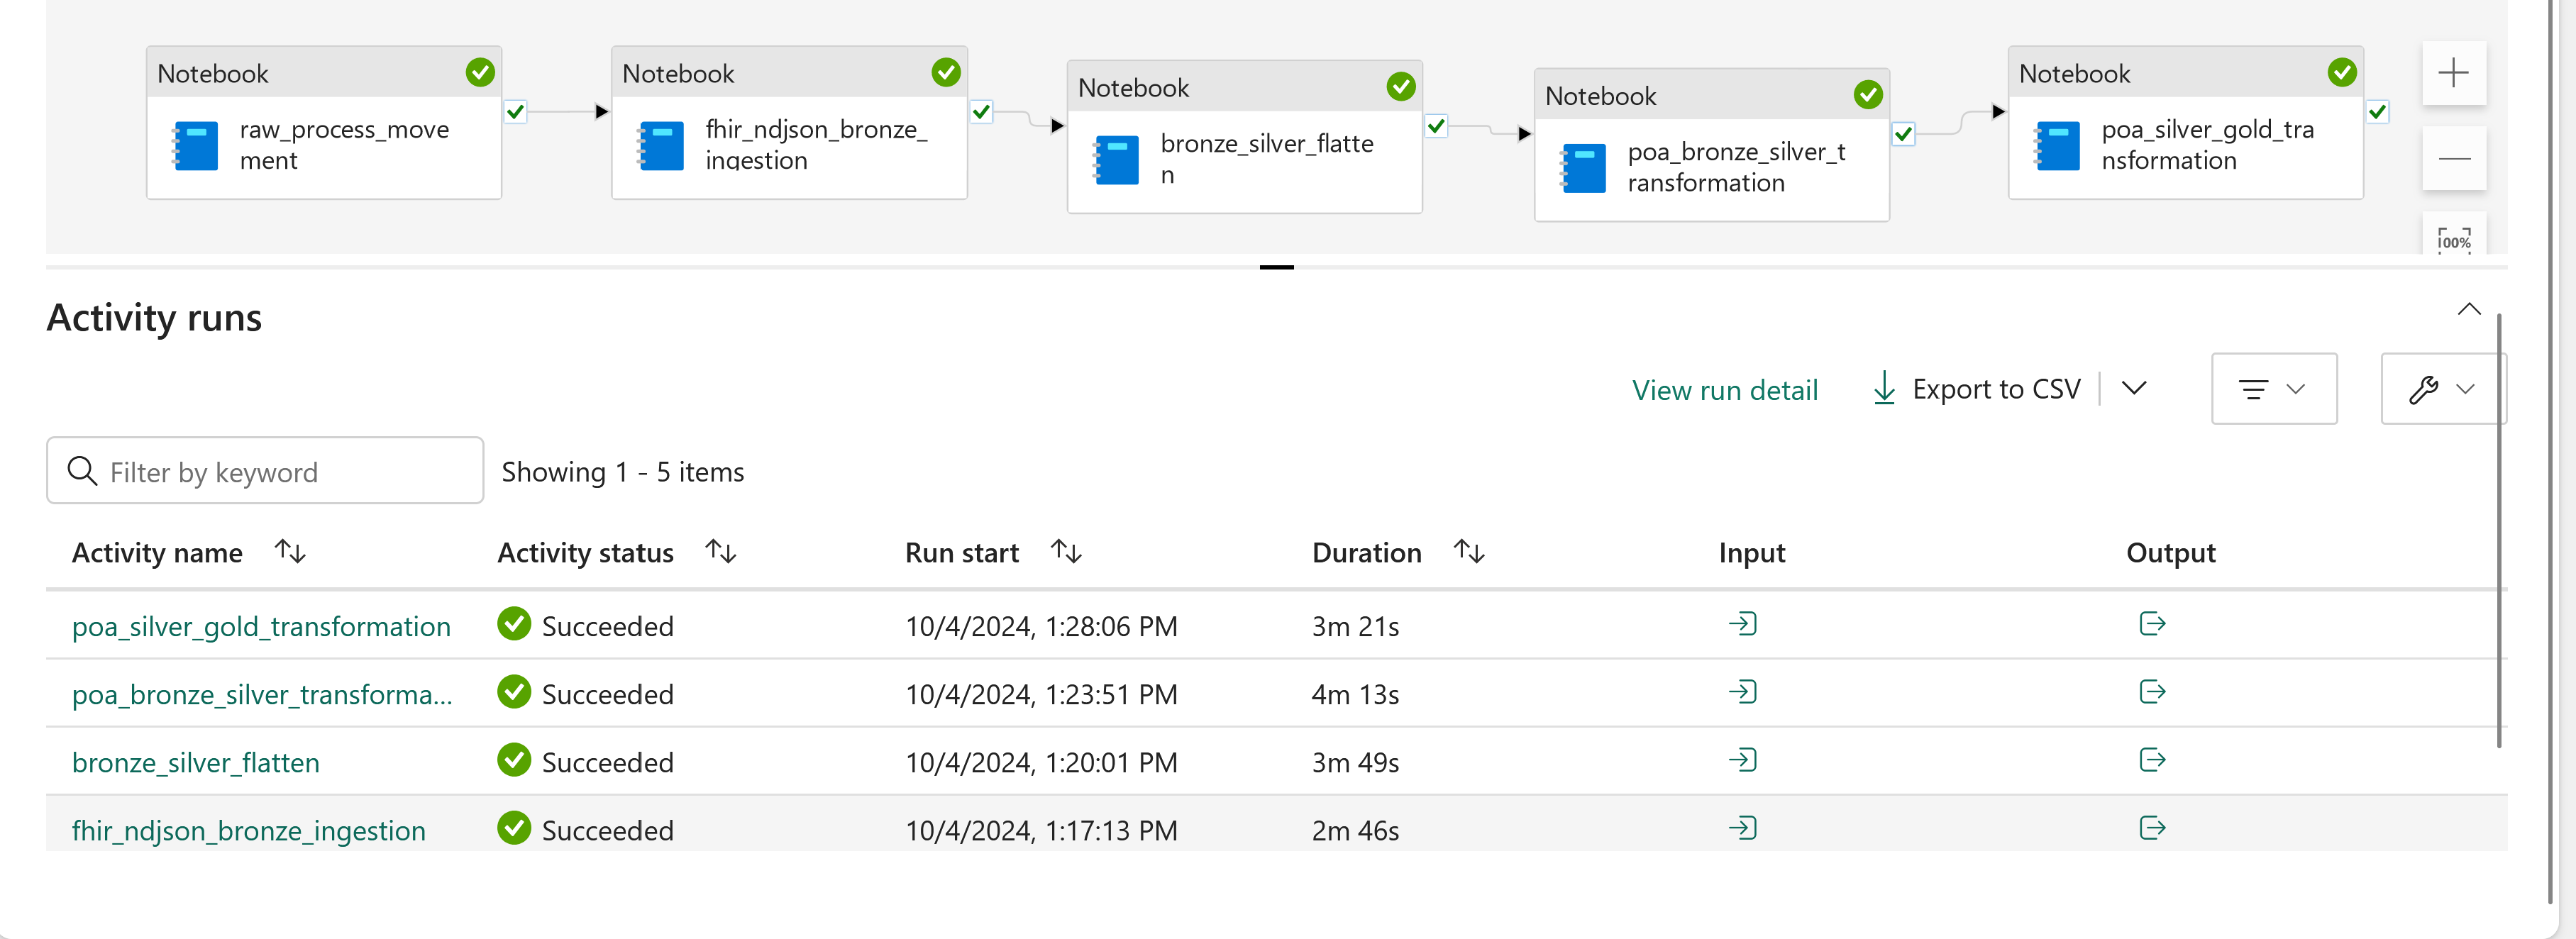
Open the healthcare#_msft_poa_ingestion data pipeline.
Select the Run button.
The pipeline typically takes around 10 minutes to complete. After successful execution, it loads data into the healthcare#_msft_poa_gold lakehouse.
Configure the patient outreach analytics Power BI report
After running the data pipeline, data should populate in the gold lakehouse. To enable the Power BI report, update the sign-in details for the data source connection used by the Power BI semantic model. Follow these steps:
In your healthcare data solutions workspace view, select the ellipsis (...) beside healthcare#_msft_poa_semantic_model.
From the overflow menu, select Settings.
In the semantic model tab, select the patient outreach analytics semantic model and expand the Gateway and cloud connections section.
To set up a new connection, select Create a connection.
In the new connection form, select the OAuth 2.0 authentication method and select Edit credentials to sign in.
Complete the other fields in the form.
Select Create.
On the semantic model's cloud connections page, select the new connection you created, and then select Apply.
The report updates within a few minutes.
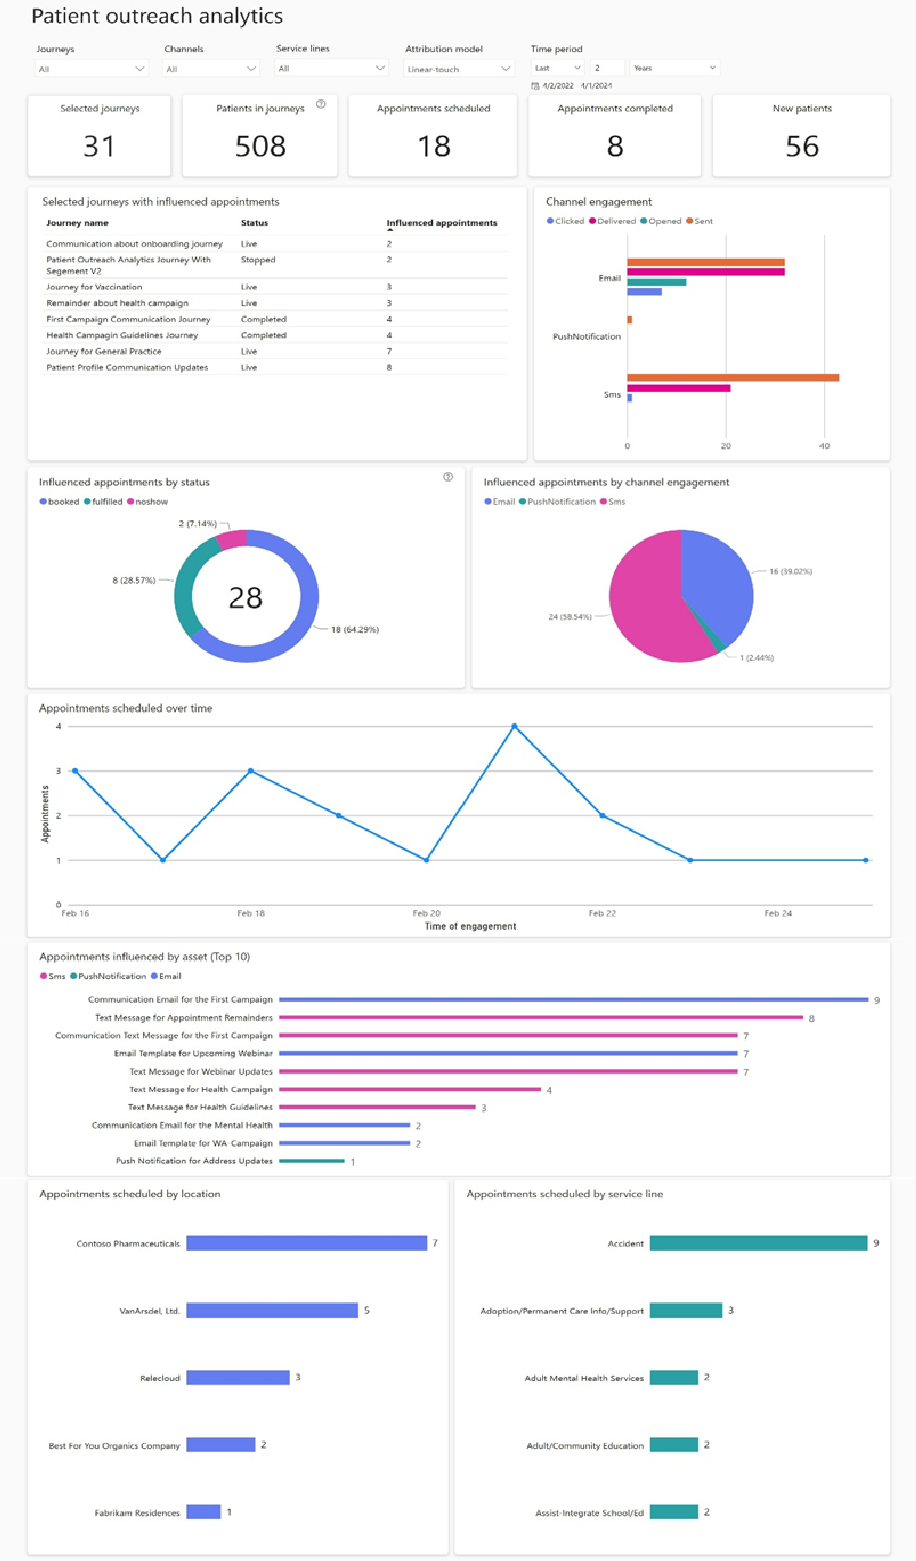
In your healthcare data solutions environment, open healthcare#_msft_poa_report to view the Power BI template dashboard for patient outreach analytics (preview).
Explore attribution models
Change the attribution model type using the dashboard filters:
- Last touch: This single-touch model assigns all credit for the influenced appointment to the last patient interaction. Use this model to identify the most recent journey, channel, or marketing asset patients engaged with before booking an appointment.
- Linear touch: This model distributes equal credit across each patient interaction leading up to the appointment. Use it to analyze common journeys, channels, and assets that patients interacted with before scheduling an appointment.
View dashboard tiles
Use the top-level filters to filter by journeys, channels, service lines, attribution models, and time period.
The following table lists the default tiles in the dashboard. Select the information icon in each tile's top right corner for more details. You can modify the default tiles to fit your organization's requirements:
| Tile | Definition |
|---|---|
| Patients in journeys | Total number of patients in the selected journeys. |
| New patients | Patients without any prior appointments or encounters before the start date specified in the date filter. |
| Appointments scheduled | Appointments scheduled within the time filter. |
| Appointments completed | Appointments completed within the specified time filter. |
| Selected journeys with influenced appointments | List of selected journeys that resulted in influenced appointments, including their statuses, the number of patients in each journey, and the count of influenced appointments. |
| Channel engagement | Count of engagements by channel type. |
| Influenced appointments by status | Total number of influenced appointments, grouped by status. |
| Appointments influenced by channel engagement | Total number of influenced appointments following an engagement via email, SMS, or push notification. |
| Appointments influenced by asset (Top 10) | Total count of appointments influenced by asset type and name. |
| Appointments scheduled over time | Appointments booked as a result of engagement with an event within the specified time filter. |
| Appointments scheduled by location | Count of booked appointments by location. |
| Appointments scheduled by service line | Count of appointments booked by service line. |
Configure the appointment attribution logic
Configure the appointment attribution logic according to your use case. For more accurate results, enter the optional service line field value when you create a journey.
The default logic is as follows:
- The patient on the appointment record must have at least one marketing interaction.
- An appointment must be booked within a specified number of days following the marketing interaction (default value is 30 days).
- The service type of the appointment must match the service type of the journey.
Use Copilot for Power BI
To gather more insights on your dashboard using Copilot for Power BI, enable the Copilot tenant settings using the guidance in Copilot tenant settings. To learn how to enable Copilot for Power BI, see Overview of Copilot for Power BI.
Note
Copilot for Power BI can only provide information found on the tiles.

