Manage and monitor costs for Microsoft Sentinel
After you've started using Microsoft Sentinel resources, use Cost Management features to set budgets and monitor costs. You can also review forecasted costs and identify spending trends to identify areas where you might want to act.
Costs for Microsoft Sentinel are only a portion of the monthly costs in your Azure bill. Although this article explains how to manage and monitor costs for Microsoft Sentinel, you're billed for all Azure services and resources your Azure subscription uses, including Partner services.
Important
Microsoft Sentinel is generally available within Microsoft's unified security operations platform in the Microsoft Defender portal. For preview, Microsoft Sentinel is available in the Defender portal without Microsoft Defender XDR or an E5 license. For more information, see Microsoft Sentinel in the Microsoft Defender portal.
Prerequisites
To view cost data and perform cost analysis in Cost Management, you must have a supported Azure account type, with at least read access.
While cost analysis in Cost Management supports most Azure account types, not all are supported. To view the full list of supported account types, see Understand Cost Management data.
For information about assigning access to Microsoft Cost Management data, see Assign access to data.
View costs by using cost analysis
As you use Azure resources with Microsoft Sentinel, you incur costs. Azure resource usage unit costs vary by time intervals such as seconds, minutes, hours, and days, or by unit usage, like bytes and megabytes. As soon as Microsoft Sentinel starts to analyze billable data, it incurs costs. View these costs by using cost analysis in the Azure portal. For more information, see Start using cost analysis.
When you use cost analysis, you view Microsoft Sentinel costs in graphs and tables for different time intervals. Some examples are by day, current and prior month, and year. You also view costs against budgets and forecasted costs. Switching to longer views over time can help you identify spending trends. And you see where overspending might have occurred. If you created budgets, you can also easily see where they're exceeded.
The Microsoft Cost Management + Billing hub provides useful functionality. After you open Cost Management + Billing in the Azure portal, select Cost Management in the left navigation and then select the scope or set of resources to investigate, such as an Azure subscription or resource group.
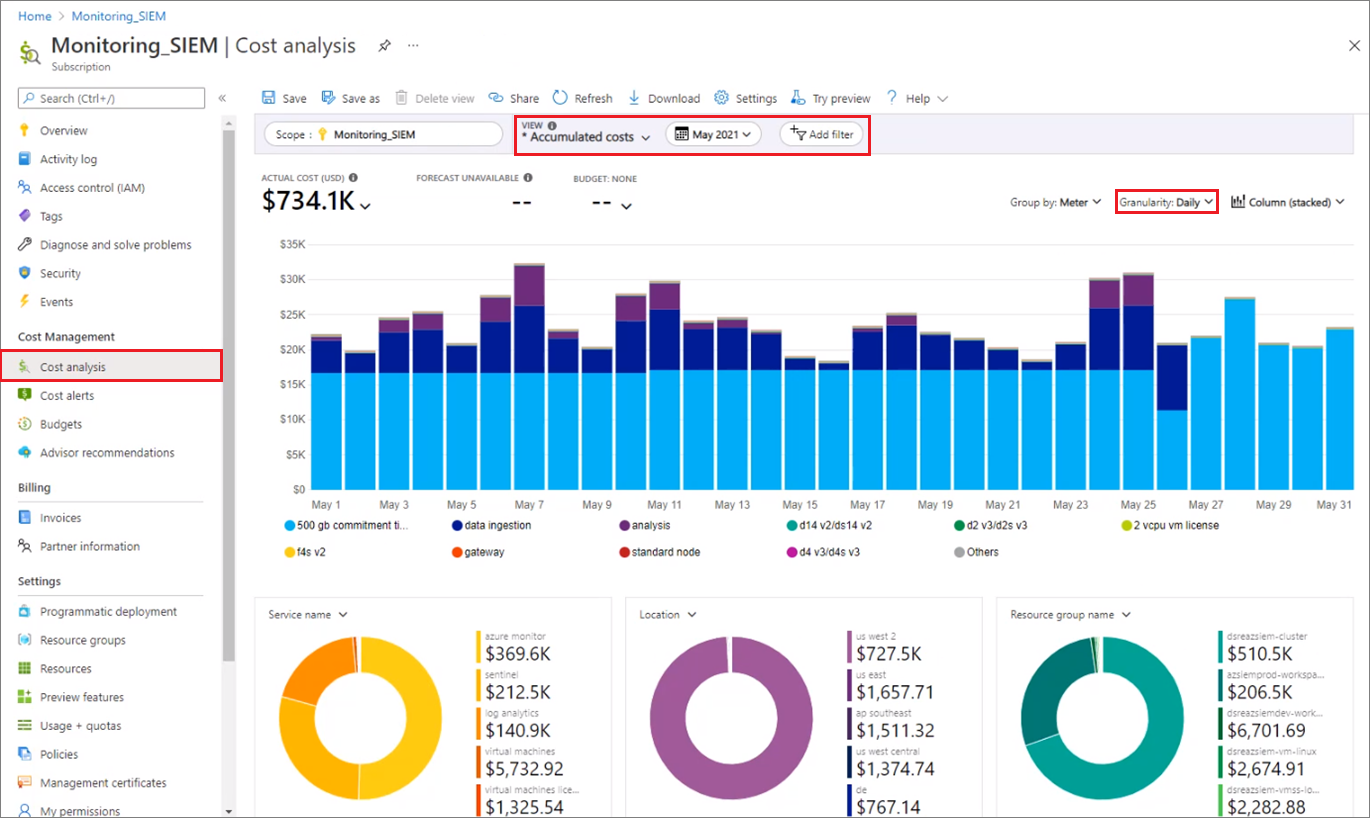
The Cost Analysis screen shows detailed views of your Azure usage and costs, with the option to apply various controls and filters.
For example, to see charts of your daily costs for a certain time frame:
Select the drop-down caret in the View field and select Accumulated costs or Daily costs.
Select the drop-down caret in the date field and select a date range.
Select the drop-down caret next to Granularity and select Daily.
The costs shown in the following image are for example purposes only. They're not intended to reflect actual costs.
You could also apply further controls. For example, to view only the costs associated with Microsoft Sentinel, select Add filter, select Service name, and then select the service names Sentinel, Log Analytics, and Azure Monitor.
Microsoft Sentinel data ingestion volumes appear under Security Insights in some portal Usage Charts.
The Microsoft Sentinel classic pricing tiers don't include Log Analytics charges, so you might see those charges billed separately. Microsoft Sentinel simplified pricing combines the two costs into one set of tiers. To learn more about Microsoft Sentinel's simplified pricing tiers, see Simplified pricing tiers.
For more information on reducing costs, see Create budgets and Reduce costs in Microsoft Sentinel.
Using Azure Prepayment with Microsoft Sentinel
You can pay for Microsoft Sentinel charges with your Azure Prepayment credit. However, you can't use Azure Prepayment credit to pay bills to non-Microsoft organizations for their products and services, or for products from the Azure Marketplace.
Run queries to understand your data ingestion
Microsoft Sentinel uses an extensive query language to analyze, interact with, and derive insights from huge volumes of operational data in seconds. Here are some Kusto queries you can use to understand your data ingestion volume.
Run the following query to show data ingestion volume by solution:
Usage
| where StartTime >= startofday(ago(31d)) and EndTime < startofday(now())
| where IsBillable == true
| summarize BillableDataGB = sum(Quantity) / 1000. by bin(StartTime, 1d), Solution
| extend Solution = iff(Solution == "SecurityInsights", "AzureSentinel", Solution)
| render columnchart
Run the following query to show data ingestion volume by data type:
Usage
| where StartTime >= startofday(ago(31d)) and EndTime < startofday(now())
| where IsBillable == true
| summarize BillableDataGB = sum(Quantity) / 1000. by bin(StartTime, 1d), DataType
| render columnchart
Run the following query to show data ingestion volume by both solution and data type:
Usage
| where TimeGenerated > ago(32d)
| where StartTime >= startofday(ago(31d)) and EndTime < startofday(now())
| where IsBillable == true
| summarize BillableDataGB = sum(Quantity) / 1000. by Solution, DataType
| extend Solution = iff(Solution == "SecurityInsights", "AzureSentinel", Solution)
| sort by Solution asc, DataType asc
See more information on the following items used in the preceding examples, in the Kusto documentation:
- where operator
- extend operator
- summarize operator
- render operator
- sort operator
- iff() function
- ago() function
- now() function
- bin() function
- startofday() function
- count() aggregation function
- sum() aggregation function
For more information on KQL, see Kusto Query Language (KQL) overview.
Other resources:
Deploy a workbook to visualize data ingestion
The Workspace Usage Report workbook provides your workspace's data consumption, cost, and usage statistics. The workbook gives the workspace's data ingestion status and amount of free and billable data. You can use the workbook logic to monitor data ingestion and costs, and to build custom views and rule-based alerts.
This workbook also provides granular ingestion details. The workbook breaks down the data in your workspace by data table, and provides volumes per table and entry to help you better understand your ingestion patterns.
To enable the Workspace Usage Report workbook:
- In the Microsoft Sentinel left navigation, select Threat management > Workbooks.
- Enter workspace usage in the Search bar, and then select Workspace Usage Report.
- Select View template to use the workbook as is, or select Save to create an editable copy of the workbook. If you save a copy, select View saved workbook.
- In the workbook, select the Subscription and Workspace you want to view, and then set the TimeRange to the time frame you want to see. You can set the Show help toggle to Yes to display in-place explanations in the workbook.
Export cost data
You can also export your cost data to a storage account. Exporting cost data is helpful when you need or others to do more data analysis for costs. For example, a finance team can analyze the data using Excel or Power BI. You can export your costs on a daily, weekly, or monthly schedule and set a custom date range. Exporting cost data is the recommended way to retrieve cost datasets.
Create budgets
You can create budgets to manage costs and create alerts that automatically notify stakeholders of spending anomalies and overspending risks. Alerts are based on spending compared to budget and cost thresholds. Budgets and alerts are created for Azure subscriptions and resource groups, so they're useful as part of an overall cost monitoring strategy.
You can create budgets with filters for specific resources or services in Azure if you want more granularity in your monitoring. Filters help ensure that you don't accidentally create new resources that cost you more money. For more information about the filter options available when you create a budget, see Group and filter options.
Use a playbook for cost management alerts
To help you control your Microsoft Sentinel budget, you can create a cost management playbook. The playbook sends you an alert if your Microsoft Sentinel workspace exceeds a budget, which you define, within a given timeframe.
The Microsoft Sentinel GitHub community provides the Send-IngestionCostAlert cost management playbook on GitHub. This playbook is activated by a recurrence trigger, and gives you a high level of flexibility. You can control execution frequency, ingestion volume, and the message to trigger, based on your requirements.
Define a data volume cap in Log Analytics
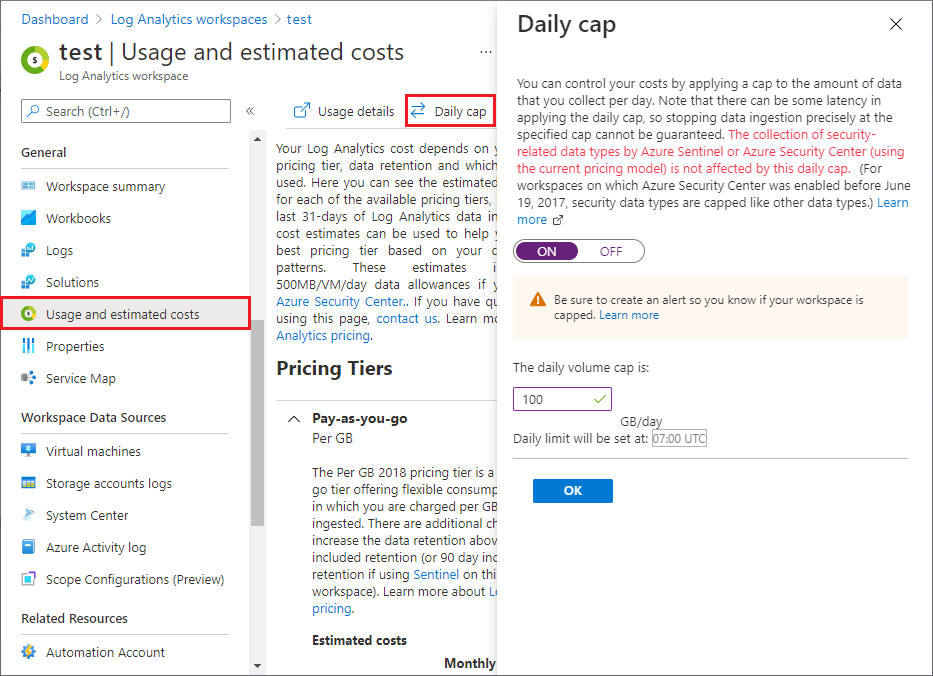
In Log Analytics, you can enable a daily volume cap that limits the daily ingestion for your workspace. The daily cap can help you manage unexpected increases in data volume, stay within your limit, and limit unplanned charges.
To define a daily volume cap, select Usage and estimated costs in the left navigation of your Log Analytics workspace, and then select Daily cap. Select On, enter a daily volume cap amount, and then select OK.

The Usage and estimated costs screen also shows your ingested data volume trend in the past 31 days, and the total retained data volume.
For more information, see Set daily cap on Log Analytics workspace.
Next steps
- Reduce costs for Microsoft Sentinel
- Learn how to optimize your cloud investment with Microsoft Cost Management.
- Learn more about managing costs with cost analysis.
- Learn about how to prevent unexpected costs.
- Take the Cost Management guided learning course.
- For more tips on reducing Log Analytics data volume, see Azure Monitor best practices - Cost management.
