Introduction to TestApi – Part 7: Memory Leak Detection API
Series Index
- Overview of TestApi
- Part 1: Input Injection APIs
- Part 2: Command-Line Parsing APIs
- Part 3: Visual Verification APIs
- Part 4: Combinatorial Variation Generation APIs
- Part 5: Managed Code Fault Injection APIs
- Part 6: Text String Generation APIs
- Part 7: Memory Leak Detection APIs
- Part 8: Object Comparison APIs
+++
General Notes
A memory leak is the inability to release reserved memory. Memory leaks often lead to continuously increasing memory usage in applications, which in turn degrades the application and system performance.
Most modern operating systems free all the memory that is reserved by a process when the process terminates, which provides some protection against cumulative memory leaks that result from repeated execution of the same “leaky” application. However, this solution is at best only partially successful because all kinds of memory leaks are undesirable, and you need to catch and eliminate them.
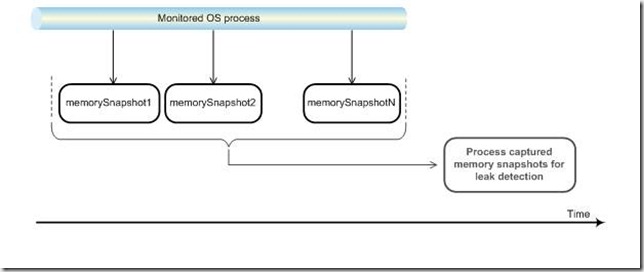
TestApi provides a simple memory-leak-detection mechanism, which takes memory snapshots of an executing process and then processes the snapshots with arbitrarily complex leak-detection algorithms, as the following figure shows. The leak detection APIs were designed and implemented by our engineer Shozub Qureshi in collaboration with other members of our team.
Fig.1 Leak detection workflow
TestApi currently only provides mechanisms for crude detection of leaks. If a leak is suspected, the TestApi user should use a profiler to narrow down possible memory leaks, and then confirm or disprove them.
Terminology
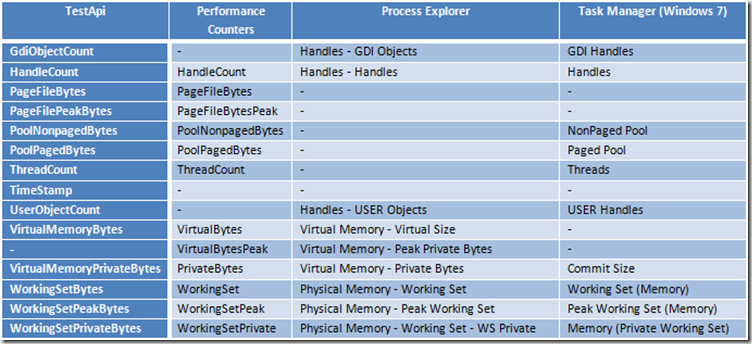
Different tools often use different names for the same memory metrics. The following table maps the naming across three popular tools – the OS-provided Performance Counters, Process Explorer and Task Manager (on Windows 7).
Except when necessary to resolve inconsistencies, TestApi typically follows the naming convention that is used by the Performance Counters. For an in-depth description of all metrics, refer to the TestApi reference documentation.
Usage
Now let’s demonstrate the usage of the API through a few examples...
Example #1
TestApi provides the MemorySnapshot class, which helps you capture, serialize, deserialize, and make initial comparisons of the memory state of a process. The following example demonstrates how to use the MemorySnapshot class to display memory usage differences for a given process.
MemorySnapshot gives you a very easy way to capture crude memory information for your process. In this first version of the API we don’t provide facilities to track individual memory allocations – we will provide these in a future revision of the API.
 //
// Taking two memory snapshots of Notepad and comparing them for leaks
//

// Start an instance of Notepad.exe, get its PID, and take a memory snapshot
Process p = Process.Start("notepad.exe");
p.WaitForInputIdle(5000);
int pid = p.Id;
MemorySnapshot s1 = MemorySnapshot.FromProcess(pid);

//
// Perform operations that may cause a leak in Notepad...
//

// Capture a second snapshot
MemorySnapshot s2 = MemorySnapshot.FromProcess(pid);

// Compare the two memory snapshots and generate a diff.
// Then display the diff to the console.
MemorySnapshot diff = s2.CompareTo(s1);

Console.WriteLine("Memory diff for process {0}:", pid);
Console.WriteLine("Start time: {0}", s1.TimeStamp);
Console.WriteLine("End time: {0}", s2.TimeStamp);
Console.WriteLine("\tGDI Object Count: {0}", diff.GdiObjectCount);
Console.WriteLine("\tHandle Count: {0}", diff.HandleCount);
Console.WriteLine("\tPageFile Bytes: {0}", diff.PageFileBytes);
Console.WriteLine("\tPageFile Peak Bytes: {0}", diff.PageFilePeakBytes);
Console.WriteLine("\tPool Nonpaged Bytes: {0}", diff.PoolNonpagedBytes);
Console.WriteLine("\tPool Paged Bytes: {0}", diff.PoolPagedBytes);
Console.WriteLine("\tThread Count: {0}", diff.ThreadCount);
Console.WriteLine("\tUser Object Count: {0}", diff.UserObjectCount);
Console.WriteLine("\tVM Bytes: {0}", diff.VirtualMemoryBytes);
Console.WriteLine("\tVM Private Bytes: {0}", diff.VirtualMemoryPrivateBytes);
Console.WriteLine("\tWS Bytes: {0}", diff.WorkingSetBytes);
Console.WriteLine("\tWS Peak Bytes: {0}", diff.WorkingSetPeakBytes);
Console.WriteLine("\tWS Private Bytes: {0}", diff.WorkingSetPrivateBytes);

// Close the process.
p.CloseMainWindow();
p.Close();
Example #2
In addition to MemorySnapshot, TestApi provides the MemorySnapshotCollection class, which allows serialization / deserialization of a series of memory snapshots. The use of this class is demonstrated below:
 //
// Taking multiple memory snapshots of Notepad and storing them for
// later analysis
//

// Create a memory snapshot collection and add the snapshots to it.
MemorySnapshotCollection c = new MemorySnapshotCollection();

// Start an instance of the target process and wait for it to reach steady state.
// Then take a memory snapshot.

Process p = Process.Start("notepad.exe");
p.WaitForInputIdle(5000);
MemorySnapshot s1 = MemorySnapshot.FromProcess(p.Id);
c.Add(s1);

// Perform operations that may cause a leak in the target process...
// Then take a second memory snapshot
MemorySnapshot s2 = MemorySnapshot.FromProcess(p.Id);
c.Add(s2);

// Save the collection to a XML file for later analysis.
c.ToFile(@"C:\mySnapshots.xml");

// Close the process.
p.CloseMainWindow();
p.Close();
Conclusion
Although admittedly crude in its first version, the memory leak detection API provided by TestApi enable easy creation of memory leak detection tests and tools. The documentation provides a lot of information about how the different metrics are calculated with pointers to the relevant articles and OS APIs.
We will be expanding this API in the future to include allocation tracking as well as advanced leak detection analysis (currently, you have the perform the analysis yourself based on the collected data or fire up a debugger or profiler to analyze a leaky process), so let us know of specific needs, feature requests and ideas, etc.
Comments
Anonymous
September 14, 2010
I took the test api version 5 code and added a custom trigger. compiled the code, replaced the testapitestApicore.dll with the newly created dll. I could access my trigger when i refer the dll in my test application. but the injecting part does not work properly. I tried compiling a fresh source code of testpi (i.e without any changes just compiled the code) and created the testApicore.dll. when this dll is refered from my test applicatoin still a basic test sample does not work. However when i replace the testApiCore.dll with the original dll i got from your site with the FaultInjectionSample.zip found in "Part 5: Managed Code Fault Injection APIs", the basic test sample (example in Part 5) works perfectly. Please let me know your thoughts and if you have any solution for this.Anonymous
September 15, 2010
if i understand the issue correctly, you mean the original testapicore.dll works fine, but it won't work if you compile the source code to build the new one? this sounds like your compiling enviornment issue, i'm not exactly sure what went wrong. in your working folder, there should be some log file, can you copy/paste ? also your os version 32/64bit, Visual studio version, .net version.

