Pushing the Limits of Windows: Processes and Threads
This is the fourth post in my Pushing the Limits of Windows series that explores the boundaries of fundamental resources in Windows. This time, I’m going to discuss the limits on the maximum number of threads and processes supported on Windows. I’ll briefly describe the difference between a thread and a process, survey thread limits and then investigate process limits. I cover thread limits first since every active process has at least one thread (a process that’s terminated, but is kept referenced by a handle owned by another process won’t have any), so the limit on processes is directly affected by the caps that limit threads.
Unlike some UNIX variants, most resources in Windows have no fixed upper bound compiled into the operating system, but rather derive their limits based on basic operating system resources that I’ve already covered. Process and threads, for example, require physical memory, virtual memory, and pool memory, so the number of processes or threads that can be created on a given Windows system is ultimately determined by one of these resources, depending on the way that the processes or threads are created and which constraint is hit first. I therefore recommend that you read the preceding posts if you haven’t, because I’ll be referring to reserved memory, committed memory, the system commit limit and other concepts I’ve covered. Here’s the index of the entire Pushing the Limits series. While they can stand on their own, they assume that you read them in order.
Pushing the Limits of Windows: Physical Memory
Pushing the Limits of Windows: Virtual Memory
Pushing the Limits of Windows: Paged and Nonpaged Pool
Pushing the Limits of Windows: Processes and Threads
Pushing the Limits of Windows: Handles
Pushing the Limits of Windows: USER and GDI Objects – Part 1
Pushing the Limits of Windows: USER and GDI Objects – Part 2
Processes and Threads
A Windows process is essentially container that hosts the execution of an executable image file. It is represented with a kernel process object and Windows uses the process object and its associated data structures to store and track information about the image’s execution. For example, a process has a virtual address space that holds the process’s private and shared data and into which the executable image and its associated DLLs are mapped. Windows records the process’s use of resources for accounting and query by diagnostic tools and it registers the process’s references to operating system objects in the process’s handle table. Processes operate with a security context, called a token, that identifies the user account, account groups, and privileges assigned to the process.
Finally, a process includes one or more threads that actually execute the code in the process (technically, processes don’t run, threads do) and that are represented with kernel thread objects. There are several reasons applications create threads in addition to their default initial thread: processes with a user interface typically create threads to execute work so that the main thread remains responsive to user input and windowing commands; applications that want to take advantage of multiple processors for scalability or that want to continue executing while threads are tied up waiting for synchronous I/O operations to complete also benefit from multiple threads.
Thread Limits
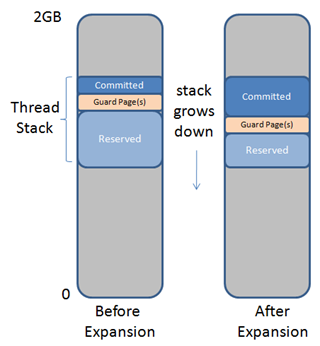
Besides basic information about a thread, including its CPU register state, scheduling priority, and resource usage accounting, every thread has a portion of the process address space assigned to it, called a stack, which the thread can use as scratch storage as it executes program code to pass function parameters, maintain local variables, and save function return addresses. So that the system’s virtual memory isn’t unnecessarily wasted, only part of the stack is initially allocated, or committed and the rest is simply reserved. Because stacks grow downward in memory, the system places guard pages beyond the committed part of the stack that trigger an automatic commitment of additional memory (called a stack expansion) when accessed. This figure shows how a stack’s committed region grows down and the guard page moves when the stack expands, with a 32-bit address space as an example (not drawn to scale):
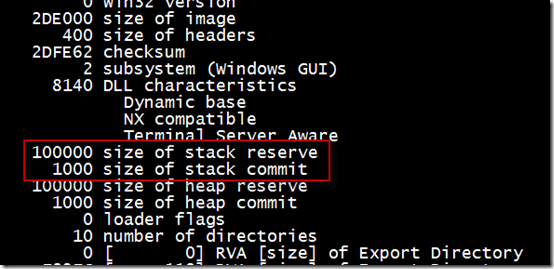
The Portable Executable (PE) structures of the executable image specify the amount of address space reserved and initially committed for a thread’s stack. The linker defaults to a reserve of 1MB and commit of one page (4K), but developers can override these values either by changing the PE values when they link their program or for an individual thread in a call to CreateThread. You can use a tool like Dumpbin that comes with Visual Studio to look at the settings for an executable. Here’s the Dumpbin output with the /headers option for the executable generated by a new Visual Studio project:
Converting the numbers from hexadecimal, you can see the stack reserve size is 1MB and the initial commit is 4K and using the new Sysinternals VMMap tool to attach to this process and view its address space, you can clearly see a thread stack’s initial committed page, a guard page, and the rest of the reserved stack memory:
Because each thread consumes part of a process’s address space, processes have a basic limit on the number of threads they can create that’s imposed by the size of their address space divided by the thread stack size.
32-bit Thread Limits
Even if the thread had no code or data and the entire address space could be used for stacks, a 32-bit process with the default 2GB address space could create at most 2,048 threads. Here’s the output of the Testlimit tool running on 32-bit Windows with the –t switch (create threads) confirming that limit:
Again, since part of the address space was already used by the code and initial heap, not all of the 2GB was available for thread stacks, thus the total threads created could not quite reach the theoretical limit of 2,048.
I linked the Testlimit executable with the large address space-aware option, meaning that if it’s presented with more than 2GB of address space (for example on 32-bit systems booted with the /3GB or /USERVA Boot.ini option or its equivalent BCD option on Vista and later increaseuserva), it will use it. 32-bit processes are given 4GB of address space when they run on 64-bit Windows, so how many threads can the 32-bit Testlimit create when run on 64-bit Windows? Based on what we’ve covered so far, the answer should be roughly 4096 (4GB divided by 1MB), but the number is actually significantly smaller. Here’s 32-bit Testlimit running on 64-bit Windows XP:
The reason for the discrepancy comes from the fact that when you run a 32-bit application on 64-bit Windows, it is actually a 64-bit process that executes 64-bit code on behalf of the 32-bit threads, and therefore there is a 64-bit thread stack and a 32-bit thread stack area reserved for each thread. The 64-bit stack has a reserve of 256K (except that on systems prior to Vista, the initial thread’s 64-bit stack is 1MB). Because every 32-bit thread begins its life in 64-bit mode and the stack space it uses when starting exceeds a page, you’ll typically see at least 16KB of the 64-bit stack committed. Here’s an example of a 32-bit thread’s 64-bit and 32-bit stacks (the one labeled “Wow64” is the 32-bit stack):
32-bit Testlimit was able to create 3,204 threads on 64-bit Windows, which given that each thread uses 1MB+256K of address space for stack (again, except the first on versions of Windows prior to Vista, which uses 1MB+1MB), is exactly what you’d expect. I got different results when I ran 32-bit Testlimit on 64-bit Windows 7, however:
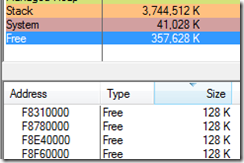
The difference between the Windows XP result and the Windows 7 result is caused by the more random nature of address space layout introduced in Windows Vista, Address Space Load Randomization (ASLR), that leads to some fragmentation. Randomization of DLL loading, thread stack and heap placement, helps defend against malware code injection. As you can see from this VMMap output, there’s 357MB of address space still available, but the largest free block is only 128K in size, which is smaller than the 1MB required for a 32-bit stack:
As I mentioned, a developer can override the default stack reserve. One reason to do so is to avoid wasting address space when a thread’s stack usage will always be significantly less than the default 1MB. Testlimit sets the default stack reservation in its PE image to 64K and when you include the –n switch along with the –t switch, Testlimit creates threads with 64K stacks. Here’s the output on a 32-bit Windows XP system with 256MB RAM (I did this experiment on a small system to highlight this particular limit):
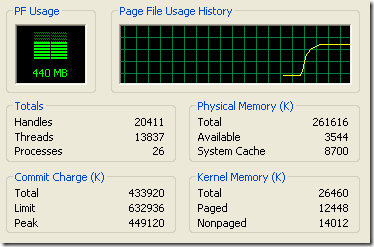
Note the different error, which implies that address space isn’t the issue here. In fact, 64K stacks should allow for around 32,000 threads (2GB/64K = 32,768). What’s the limit that’s being hit in this case? A look at the likely candidates, including commit and pool, don’t give any clues, as they’re all below their limits:
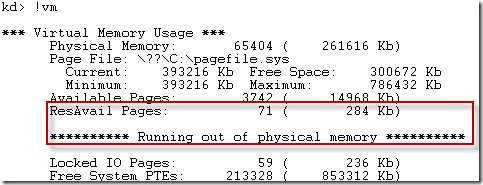
It’s only a look at additional memory information in the kernel debugger that reveals the threshold that’s being hit, resident available memory, which has been exhausted:
Resident available memory is the physical memory that can be assigned to data or code that must be kept in RAM. Nonpaged pool and nonpaged drivers count against it, for example, as does memory that’s locked in RAM for device I/O operations. Every thread has both a user-mode stack, which is what I’ve been talking about, but they also have a kernel-mode stack that’s used when they run in kernel mode, for example while executing system calls. When a thread is active its kernel stack is locked in memory so that the thread can execute code in the kernel that can’t page fault.
A basic kernel stack is 12K on 32-bit Windows and 24K on 64-bit Windows. 14,225 threads require about 170MB of resident available memory, which corresponds to exactly how much is free on this system when Testlimit isn’t running:
Once the resident available memory limit is hit, many basic operations begin failing. For example, here’s the error I got when I double-clicked on the desktop’s Internet Explorer shortcut:
As expected, when run on 64-bit Windows with 256MB of RAM, Testlimit is only able to create 6,600 threads – roughly half what it created on 32-bit Windows with 256MB RAM - before running out of resident available memory:
The reason I said “basic” kernel stack earlier is that a thread that executes graphics or windowing functions gets a “large” stack when it executes the first call that’s 20K on 32-bit Windows and 48K on 64-bit Windows. Testlimit’s threads don’t call any such APIs, so they have basic kernel stacks.
64-bit Thread Limits
Like 32-bit threads, 64-bit threads also have a default of 1MB reserved for stack, but 64-bit processes have a much larger user-mode address space (8TB), so address space shouldn’t be an issue when it comes to creating large numbers of threads. Resident available memory is obviously still a potential limiter, though. The 64-bit version of Testlimit (Testlimit64.exe) was able to create around 6,600 threads with and without the –n switch on the 256MB 64-bit Windows XP system, the same number that the 32-bit version created, because it also hit the resident available memory limit. However, on a system with 2GB of RAM, Testlimit64 was able to create only 55,000 threads, far below the number it should have been able to if resident available memory was the limiter (2GB/24K = 89,000):
In this case, it’s the initial thread stack commit that causes the system to run out of virtual memory and the “paging file is too small” error. Once the commit level reached the size of RAM, the rate of thread creation slowed to a crawl because the system started thrashing, paging out stacks of threads created earlier to make room for the stacks of new threads, and the paging file had to expand. The results are the same when the –n switch is specified, because the threads have the same initial stack commitment.
Process Limits
The number of processes that Windows supports obviously must be less than the number of threads, since each process has one thread and a process itself causes additional resource usage. 32-bit Testlimit running on a 2GB 64-bit Windows XP system created about 8,400 processes:
A look in the kernel debugger shows that it hit the resident available memory limit:
If the only cost of a process with respect to resident available memory was the kernel-mode thread stack, Testlimit would have been able to create far more than 8,400 threads on a 2GB system. The amount of resident available memory on this system when Testlimit isn’t running is 1.9GB:
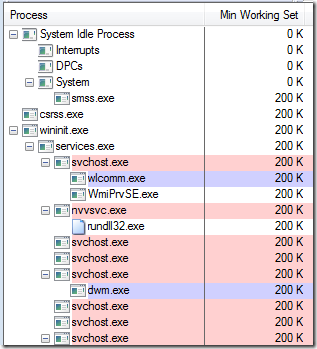
Dividing the amount of resident memory Testlimit used (1.9GB) by the number of processes it created (8,400) yields 230K of resident memory per process. Since a 64-bit kernel stack is 24K, that leaves about 206K unaccounted for. Where’s the rest of the cost coming from? When a process is created, Windows reserves enough physical memory to accommodate the process’s minimum working set size. This acts as a guarantee to the process that no matter what, there will enough physical memory available to hold enough data to satisfy its minimum working set. The default working set size happens to be 200KB, a fact that’s evident when you add the Minimum Working Set column to Process Explorer’s display:
The remaining roughly 6K is resident available memory charged for additional non-pageable memory allocated to represent a process. A process on 32-bit Windows will use slightly less resident memory because its kernel-mode thread stack is smaller.
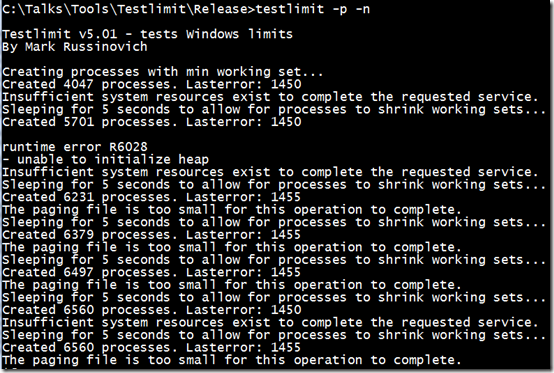
As they can for user-mode thread stacks, processes can override their default working set size with the SetProcessWorkingSetSize function. Testlimit supports a –n switch, that when combined with –p, causes child processes of the main Testlimit process to set their working set to the minimum possible, which is 80K. Because the child processes must run to shrink their working sets, Testlimit sleeps after it can’t create any more processes and then tries again to give its children a chance to execute. Testlimit executed with the –n switch on a Windows 7 system with 4GB of RAM hit a limit other than resident available memory: the system commit limit:
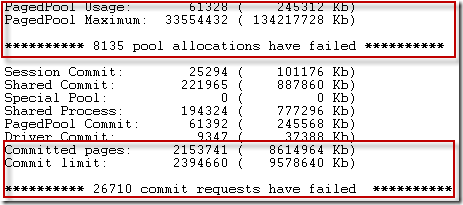
Here you can see the kernel debugger reporting not only that the system commit limit had been hit, but that there have been thousands of memory allocation failures, both virtual and paged pool allocations, following the exhaustion of the commit limit (the system commit limit was actually hit several times as the paging file was filled and then grown to raise the limit):
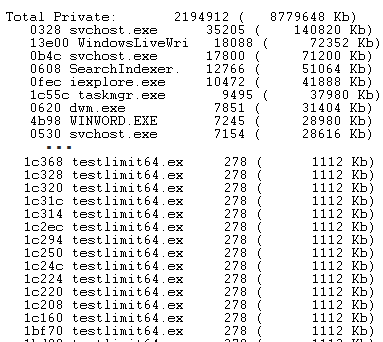
The baseline commitment before Testlimit ran was about 1.5GB, so the threads had consumed about 8GB of committed memory. Each process therefore consumed roughly 8GB/6,600, or 1.2MB. The output of the kernel debugger’s !vm command, which shows the private memory allocated by each active process, confirms that calculation:
The initial thread stack commitment, described earlier, has a negligible impact with the rest coming from the memory required for the process address space data structures, page table entries, the handle table, process and thread objects, and private data the process creates when it initializes.
How Many Threads and Processes are Enough?
So the answer to the questions, “how many threads does Windows support?” and “how many processes can you run concurrently on Windows?” depends. In addition to the nuances of the way that the threads specify their stack sizes and processes specify their minimum working sets, the two major factors that determine the answer on any particular system include the amount of physical memory and the system commit limit. In any case, applications that create enough threads or processes to get anywhere near these limits should rethink their design, as there are almost always alternate ways to accomplish the same goals with a reasonable number. For instance, the general goal for a scalable application is to keep the number of threads running equal to the number of CPUs (with NUMA changing this to consider CPUs per node) and one way to achieve that is to switch from using synchronous I/O to using asynchronous I/O and rely on I/O completion ports to help match the number of running threads to the number of CPUs.
Comments
Anonymous
January 01, 2003
@mlynch Ah, I see, sorry! It was a typo. Fixed.Anonymous
January 01, 2003
@Tony: Good catch, I've fixed the text. ASLR in Vista originally stood for Address Space Load Randomization, so I accidentally use that sometimes.Anonymous
January 01, 2003
I don't see that. Email me the .mmp file and I'll take a look.Anonymous
January 01, 2003
@Ross Presser: Take a look in VMMap at the stack reserves.Anonymous
January 01, 2003
@Raymond: good point, you'll see that if the last thread in the process exits, but an application has a handle open to the process or a driver has a reference to the process object.Anonymous
January 01, 2003
@mingbo wan: No, because a 32-bit thread has both 32-bit and 64-bit stack reserves.Anonymous
July 08, 2009
Hi Mark, I am looking at a VMMap snap of Notepad.exe on Win7 x64, and I am seeing a "Thread Stack (Wow64)" with a commit of 224K. Why does a 64-bit process have a Wow64 stack?Anonymous
July 09, 2009
Great article. I love the VMMap utility too. I'm a software developer myself, and the system I help maintain runs under Interix (SUA/SFU). We were having a problem recently whereby one of our applications was vaporizing under heavy load. We finally discovered that it was running out of stack space because, under Interix, the maximum stack size is hardcoded (possibly a GCC thing). I just reran our application using VMMap and it shows the stack growing from ~100K to 16MB. I only wish we'd had this utility then :-) JamesAnonymous
July 09, 2009
The comment has been removedAnonymous
July 09, 2009
Yesterday I posted a comment showing that my Windows XP 32-bit system, running on a 64-bit capable processor but installed as 32-bit Windows XP, not booted with the /3GB or any other special switch, but with 3GB of RAM, can produce over 50,000 threads with "testlimit -t" (no -n). That comment has not shown up here. What's the explanation?Anonymous
July 09, 2009
zizebra, I sometimes get the an error about low virtual memory, do you mean that kind of warnings/alerts? However it would be nice to have a built-in tool that could somehow report status of particular resources on Windows. For instance, CPU is over 80% or available memory is low for considerable amount of time - issue warningAnonymous
July 09, 2009
I wonder what's the limit on the number of fibers? Like say if I want to use a fiber per each concurrent user session of my web app...Anonymous
July 09, 2009
The comment has been removedAnonymous
July 10, 2009
I always thought that ASLR stands for "Address Space Layout Randomization" not "Address Space Load Randomization".Anonymous
July 10, 2009
The 64-bit stack has a reserve of 256MB (except that on systems prior to Vista, the initial thread’s 64-bit stack is 1MB). 32-bit Testlimit was able to create 3,204 threads on 64-bit Windows, which given that each thread uses 1MB+256MB of address space for stack should be 256KB?Anonymous
July 10, 2009
I just want to make sure you understood what mingbo wan is saying, because I'm confused as well: "The 64-bit stack has a reserve of 256MB (except that on systems prior to Vista, the initial thread’s 64-bit stack is 1MB)." ... "32-bit Testlimit was able to create 3,204 threads on 64-bit Windows, which given that each thread uses 1MB+256MB of address space for stack (again, except the first on versions of Windows prior to Vista, which uses 1MB+1MB), is exactly what you’d expect." mingbo wan was saying that these should read 256 kilobytes not megabytes. If you wrote MB deliberately, then I'm a bit confused because your accompanying VMMap output shows the 64-bit thread stack as 256 KB and mathematically 256 MB doesn't add up. 3,204 threads * (1 MB + 256 MB stack) = 813 GB address space whereas 3,204 threads * (1 MB + 256 KB stack) = 4,005 MB = ~ 4 GB address space Which is roughly the expected address space size of a 32-bit process on 64-bit Windows. Is it really not a typo?Anonymous
July 13, 2009
The comment has been removedAnonymous
July 13, 2009
Marcel: the compiler emits instructions to touch all of the stack pages in the frame (if it's larger than one page) to address this issue. One more reason not to have large stack allocated buffers if you can help it.Anonymous
July 14, 2009
@Micheal Grier: You're right, thanks a lot! I've disassembled and reverse engineered a good deal of code in my time, but never noticed this behaviour before. Weird, but very interesting.Anonymous
July 14, 2009
>Please forgive my amateur question, but is it possible for me to "Empty Working Set" directly in my program? Sure is. There is a Win32 function confusingly called "EmptyWorkingSet" which does what you want :-) This is a relatively newly-documented function, I think. You have always been able to achieve the same effect by SetProcessWorkingSetSize(hProc, -1, -1) (Side note: I just looked up the defn of SetProcessWorkingSetSize in the SDK doc. Who let the words "physical RAM memory" pass review? Bah...) Generally speaking, it may be useful for a service to trim its working set after once-only initialization, and possibly when it becomes idle, if it's a mostly-idle sort of service. But you have to take care to avoid pessimising performance: releasing real memory is not an automatic performance win.Anonymous
July 14, 2009
I've been eagerly following this series. It's amazing. One minor issue, the article mentions that the PE specifies an initial commit size of 4k for the thread stack but I believe in hex 0x1000 = 8k? BTW, VMMap shows 8k...Anonymous
July 14, 2009
About my previous statement, it looks like dumpbin is showing the total initial memory committed for thread stack space - 4k for stack, 4k for guard page. Sorry about that!Anonymous
July 17, 2009
The comment has been removedAnonymous
July 22, 2009
Scotty, I like the fact that in response to Mark's technical criticism of Linux, all you could really do is offer a "works better for me" citation and make fun of Mark's credentials and education. Like most zealots you are heavy on dogma, light on substance. From that Usenet posting, looks like the only thing that hasn't matured in those 10 years is you.Anonymous
July 24, 2009
The comment has been removedAnonymous
July 27, 2009
Mark, I have one simple question related to paging. I have paging off because I have 8 GB of RAM and I figure that's enough for me to run without paging; however, I still get tons of page faults. Why? There's no page file, there shouldn't be anything to retrieve from disk back to memory. Thanks.Anonymous
July 30, 2009
Now that VMMap can actually RUN on my 32-bit Windows XP, thanks to today's update, I can do as you asked and look at the stack resources. I ran testlimit -t and hit control-S after a few seconds; the thread count was already up to 7100. I started VMMap and attached to the testlimit process. The first thread stack was Size=256K, committed=12K; the remaining 7199 or so thread stacks were all size=64K, committed=8k. Total stack shown in the upper summary area had size=461,056K, committed=57,612K; free showed Size=1,595,268K. If I let it run and it continues at this pace, I compute it should generate at least 30,000 threads. Letting it run ... Created 30645 threads. Lasterror: 8 My recollection is that when I tried this right after your blog post, I got over 50,000 threads. Later today I am going to shut down all unnecessary programs and services and try this again. Given this result, do you think you should revise your blog entry? Like I said, I haven't done anything to tweak the system to get these results. It's a stock Dell system; 3GB of RAM; the processor is 64-bit capable but running 32-bit Windows XP; no /3GB or any other boot switches. (Since the last few times I've posted to this blog, my comment has been ignored, I am going to post this same comment as a blog entry on my LJ, rpresser.livejournal.com.)Anonymous
August 05, 2009
Thanks for the great post Dr. RussinovichAnonymous
August 06, 2009
Will, Techically you have the pagefile turned off, but paging is still very active. EXEs are not brought into memory in full, they are brought into memory as needed in pages. So if a program attempts to access code/data that is not resident in memory yet, then a page fault occurs and the system loads the page. Even with the pagefile disabled, if the system starts to see memory pressure, then it can take code/data and discard it (because it can just load it again from the exe/dll if needed).Anonymous
August 06, 2009
Great article to look behind the scenes of the different Windows flavors.Anonymous
August 10, 2009
Hello Mark, I did my own test running multiple copies of IE 7 on Vista Enterprise SP2 (32-bit). And my result differs from your for 32-bit systems. I was running about 2150 threads when GDI died because of GDI objects limit. I can even show the video I've made from Vmware(it's russian locale): http://s785.photobucket.com/albums/yy136/hexello/?action=view¤t= VistaVMMovie.flv The better picture can be achieved if press "full size" and then resize the screen about 1.5 times. See the threads count shown by Task Manager.Anonymous
August 30, 2009
Using VMMap to attach to a managed process, i saw there was one thread with 2 guard pages. What is that means? Here is the content copied from the saved .mmp file (lines 17A000 and 175000 are marked as Read/Write/Guard): 1 80000 0 0 0 4096 0 0 2956 0 8192 1 Thread Stack; 1 81000 0 0 0 995328 995328 0 2956 4 131072 1 Thread Stack; 1 174000 0 0 0 4096 0 0 2956 0 8192 1 Thread Stack; 1 175000 0 0 0 4096 4096 0 2956 260 131072 1 Thread Stack; 1 176000 0 0 0 16384 16384 16384 2956 4 131072 1 Thread Stack; 1 17a000 0 0 0 8192 8192 0 2956 260 131072 1 Thread Stack; 1 17c000 0 0 0 16384 16384 16384 2956 4 131072 1 Thread Stack;Anonymous
September 04, 2009
What about Timer limits. I heard that Win32 has a limit of 10.000 per process and 32.000 for desktop. Do you know anyting about Timer limits on x64 Windows like Windows 2008 x64 ?Anonymous
September 05, 2009
I love the VMMap utility too. I'm a software developer myself, this article is useful for me to learn better about VM .I want to share it with more and more people by add this links in my foler/URL.Anonymous
September 15, 2009
Appreciated the article and of course the tools you have provided. It really helps when your trying to work out issues/ troubleshooting the whys and wherefores. Remember when windows first came out and you could just monitor the resources you were using? Thanks again Mark you are an asset to IT community.Anonymous
October 01, 2009
Note that strictly speaking, you can have more processes than threads if you use zombie processes (which have no threads). Mind you, zombie processes aren't runnable...Anonymous
October 03, 2009
Hi Mark, Could you please give me an example of a process and a thread in a simple program? Thank you very much. Regards.Anonymous
November 05, 2009
Mark, Someone already asked about fiber limits, but I didn't see any response to it and didn't find a later article on fibers. Could you shed any light on fiber limits? Thanks.Anonymous
November 13, 2009
Mark, I have an unusual problem with my OpenGL program regarding "Empty Working Set". Maybe you can help. On a 8GB XP64 workstation and 4 core, if I use a large amount of memory with my application (lets say about 4GB) suddenly, the rendering performance is slowing down dramatically (is getting a sort of stalled). First, after minimizing the window (enforcing EmptyWorkingSet) the renderer performs quite well again as he initially did. What can be the reason for this phenomenon. In case the application only uses about 2 GB the performance level is unchanged. I switched of the swap memory file as well. Thax!Anonymous
March 24, 2011
hi mark i need to know the type of thread if it is one to one or many to many for windows 7
