SQL Swiss Army Knife #13 – Exploring the plan cache – Part 2
Hello all,
This is long overdue, but here it is, the follow up on plan cache exploration queries part 1 post. There are many "hidden" gems inside a query plan XML that allow us to know our workloads in greater and better detail. Here are a few more xqueries snippets for various purposes.
These are the scripts detailed further below:
- Finding index usage
- Plans with Parameterization
- Cost of Parallel Plans
- Cost of Parallel Plans with detail per Operator
- Parallel plans where Avg. Worker Time > Avg. Elapsed Time
- Parallel plans where Avg. Worker Time > Avg. Elapsed Time with detail per Operator
EDIT (15-04-2014): Changed the query looking in the plan cache for plans that use parallelism and their cost.
Download scripts here: xqueries_plancache_part2
Querying the plan cache for index usage (change @IndexName below)
Using the missing index xquery in the previous post, let’s say we found an index that has great potential, and after we create it, we want to see where it is being used – perhaps it is even being used in other queries.
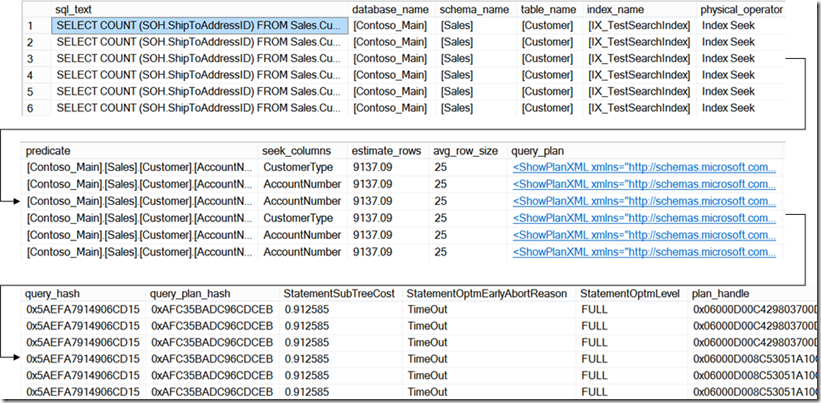
So, this one will allow you to search for usage information about a specific index. This can of course be achieved by other means other than an xquery, but in this fashion we get many useful information such as the type of operators in which indexes are used, predicates used and estimations.
 -- Querying the plan cache for index usage (change @IndexName below)
SET TRANSACTION ISOLATION LEVEL READ UNCOMMITTED;
DECLARE @IndexName sysname = 'IX_TestSearchIndex';
SET @IndexName = QUOTENAME(@IndexName,'[');
WITH XMLNAMESPACES (DEFAULT 'https://schemas.microsoft.com/sqlserver/2004/07/showplan'),
    IndexSearch AS (SELECT qp.query_plan, cp.usecounts, ix.query('.') AS StmtSimple, cp.plan_handle
                    FROM sys.dm_exec_cached_plans cp (NOLOCK)
                    CROSS APPLY sys.dm_exec_query_plan(cp.plan_handle) qp
                    CROSS APPLY qp.query_plan.nodes('//StmtSimple') AS p(ix)
                    WHERE cp.cacheobjtype = 'Compiled Plan'
                        AND ix.exist('//Object[@Index = sql:variable("@IndexName")]') = 1
                    )
SELECT StmtSimple.value('StmtSimple[1]/@StatementText', 'VARCHAR(4000)') AS sql_text,
    c2.value('@Database','sysname') AS database_name,
    c2.value('@Schema','sysname') AS [schema_name],
    c2.value('@Table','sysname') AS table_name,
    c2.value('@Index','sysname') AS index_name,
    c1.value('@PhysicalOp','NVARCHAR(50)') as physical_operator,
    c3.value('@ScalarString[1]','VARCHAR(4000)') AS predicate,
    c4.value('@Column[1]','VARCHAR(256)') AS seek_columns,
    c1.value('@EstimateRows','sysname') AS estimate_rows,
    c1.value('@AvgRowSize','sysname') AS avg_row_size,
    ixs.query_plan,
    StmtSimple.value('StmtSimple[1]/@QueryHash', 'VARCHAR(100)') AS query_hash,
    StmtSimple.value('StmtSimple[1]/@QueryPlanHash', 'VARCHAR(100)') AS query_plan_hash,
    StmtSimple.value('StmtSimple[1]/@StatementSubTreeCost', 'sysname') AS StatementSubTreeCost,
    c1.value('@EstimatedTotalSubtreeCost','sysname') AS EstimatedTotalSubtreeCost,
    StmtSimple.value('StmtSimple[1]/@StatementOptmEarlyAbortReason', 'sysname') AS StatementOptmEarlyAbortReason,
    StmtSimple.value('StmtSimple[1]/@StatementOptmLevel', 'sysname') AS StatementOptmLevel,
    ixs.plan_handle
FROM IndexSearch ixs
CROSS APPLY StmtSimple.nodes('//RelOp') AS q1(c1)
CROSS APPLY c1.nodes('IndexScan/Object[@Index = sql:variable("@IndexName")]') AS q2(c2)
OUTER APPLY c1.nodes('IndexScan/Predicate/ScalarOperator') AS q3(c3)
OUTER APPLY c1.nodes('IndexScan/SeekPredicates/SeekPredicateNew//ColumnReference') AS q4(c4)
OPTION(RECOMPILE, MAXDOP 1);
GO
Its output will resemble this:
Querying the plan cache for parameterization
Has I said before, I use some of these queries in PTO Clinic engagements. As part of the Clinic, we capture workload in production and replay it in a test server. As such, we need to get values to run parameterized queries, and while we can get to those values by other means, I am especially keen on using the values in which a plan was compiled.
This is also useful if you suspect you might be experiencing a parameter sniffing issue, and want to quickly list the parameterized values in query plans.
The xquery below gets us just that:
 -- Querying the plan cache for parameterization
SET TRANSACTION ISOLATION LEVEL READ UNCOMMITTED;
WITH XMLNAMESPACES (DEFAULT 'https://schemas.microsoft.com/sqlserver/2004/07/showplan'),
    PlanParameters AS (SELECT cp.plan_handle, qp.query_plan, qp.dbid, qp.objectid
                        FROM sys.dm_exec_cached_plans cp (NOLOCK)
                        CROSS APPLY sys.dm_exec_query_plan(cp.plan_handle) qp
                        WHERE qp.query_plan.exist('//ParameterList')=1
                            AND cp.cacheobjtype = 'Compiled Plan'
                        )
SELECT QUOTENAME(DB_NAME(pp.dbid)) AS database_name,
    ISNULL(OBJECT_NAME(pp.objectid, pp.dbid), 'No_Associated_Object') AS [object_name],
    c2.value('(@Column)[1]','sysname') AS parameter_name,
    c2.value('(@ParameterCompiledValue)[1]','VARCHAR(max)') AS parameter_compiled_value,
    pp.query_plan,
    pp.plan_handle
FROM PlanParameters pp
CROSS APPLY query_plan.nodes('//ParameterList') AS q1(c1)
CROSS APPLY c1.nodes('ColumnReference') as q2(c2)
WHERE pp.dbid > 4 AND pp.dbid < 32767
OPTION(RECOMPILE, MAXDOP 1);
GO
Its output resembling this:
Querying the plan cache for plans that use parallelism and their cost
The next few retrieve information about query plans that use parallelism.
DISCLAIMER: Although I refer to the Cost Threshold for Parallelism in the next example, I do not advise to change this value just because you might have read somewhere that the default value is low. If you are not having an issue that might warrant changes, there’s really no need to change this setting.
The above being said, let’s say we want to tune the Cost Threshold for Parallelism in your OLTP system.
Would you just guess which value you would configure?
Or would you prefer to make an informed decision based on actual query costs in your system?
Most reasonable people would choose the second, and the next xquery allows us to list costs for cached query plans that are using parallelism.
  SET TRANSACTION ISOLATION LEVEL READ UNCOMMITTED;
 WITH XMLNAMESPACES (DEFAULT 'https://schemas.microsoft.com/sqlserver/2004/07/showplan'),
 ParallelSearch AS (SELECT qp.query_plan, cp.usecounts, cp.objtype, ix.query('.') AS StmtSimple, cp.plan_handle
      FROM sys.dm_exec_cached_plans cp (NOLOCK)
      CROSS APPLY sys.dm_exec_query_plan(cp.plan_handle) qp
      CROSS APPLY qp.query_plan.nodes('//StmtSimple') AS p(ix)
      WHERE ix.exist('//RelOp[@Parallel = "1"]') = 1
       AND ix.exist('@QueryHash') = 1
      )
 SELECT StmtSimple.value('StmtSimple[1]/@StatementText', 'VARCHAR(4000)') AS sql_text,
 ps.plan_handle,
 ps.objtype,
 ps.usecounts,
 StmtSimple.value('StmtSimple[1]/@StatementSubTreeCost', 'sysname') AS StatementSubTreeCost,
 ps.query_plan,
 StmtSimple.value('StmtSimple[1]/@StatementOptmEarlyAbortReason', 'sysname') AS StatementOptmEarlyAbortReason,
 StmtSimple.value('StmtSimple[1]/@StatementOptmLevel', 'sysname') AS StatementOptmLevel,
 c1.value('@CachedPlanSize','sysname') AS CachedPlanSize,
 c2.value('@SerialRequiredMemory','sysname') AS SerialRequiredMemory,
 c2.value('@SerialDesiredMemory','sysname') AS SerialDesiredMemory,
 c3.value('@EstimatedAvailableMemoryGrant','sysname') AS EstimatedAvailableMemoryGrant,
 c3.value('@EstimatedPagesCached','sysname') AS EstimatedPagesCached,
 c3.value('@EstimatedAvailableDegreeOfParallelism','sysname') AS EstimatedAvailableDegreeOfParallelism,
 StmtSimple.value('StmtSimple[1]/@QueryHash', 'VARCHAR(100)') AS query_hash,
 StmtSimple.value('StmtSimple[1]/@QueryPlanHash', 'VARCHAR(100)') AS query_plan_hash
FROM ParallelSearch ps
CROSS APPLY StmtSimple.nodes('//QueryPlan') AS q1(c1)
CROSS APPLY c1.nodes('.//MemoryGrantInfo') AS q2(c2)
CROSS APPLY c1.nodes('.//OptimizerHardwareDependentProperties') AS q3(c3)
ORDER BY 5 DESC
OPTION(RECOMPILE, MAXDOP 1);
GO
Its output will resemble this:
Let's say I consider query 1 to be OLTP centric and I want it to run in serial, and for that purpose, I reconfigure the Cost Threshold for Parallelism for 70.
It may happen that the resulting plan is still parallelized, if the serial plan cost is above the new threshold of 70. Remember 70 became the cost threshold on which a decision to use parallelism or not will be used, but if the serial plan that is attempted always in the early stages of optimization is higher than the threshold, then as expected, you will still get a parallel plan.
This means that after identifying my sample workload that I want to make serial, I need to understand its serial cost before setting the Cost Threshold for Parallelism. This can be achieved, for example, by taking those sample queries, and adding the MAXDOP 1 query hint, and checking the cost for the resulting serial plan.
Querying the plan cache for plans that use parallelism, with more details
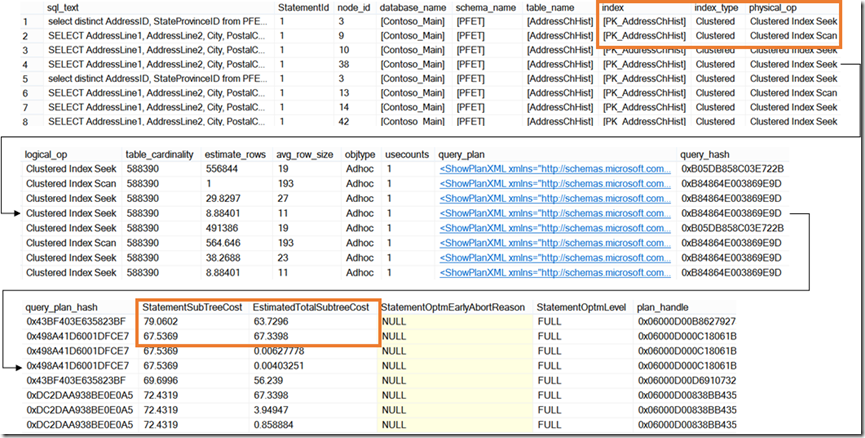
This one takes the previous example, but we now have visibility over several costly operators, and several details on those specific operators, including their estimated subtree cost over the overall statement cost.
 -- Querying the plan cache for plans that use parallelism, with more details
SET TRANSACTION ISOLATION LEVEL READ UNCOMMITTED;
WITH XMLNAMESPACES (DEFAULT 'https://schemas.microsoft.com/sqlserver/2004/07/showplan'),
    ParallelSearch AS (SELECT qp.query_plan, cp.usecounts, cp.objtype, ix.query('.') AS StmtSimple, cp.plan_handle
                        FROM sys.dm_exec_cached_plans cp (NOLOCK)
                        CROSS APPLY sys.dm_exec_query_plan(cp.plan_handle) qp
                        CROSS APPLY qp.query_plan.nodes('//StmtSimple') AS p(ix)
                        WHERE cp.cacheobjtype = 'Compiled Plan'
                            AND ix.exist('//RelOp[@Parallel = "1"]') = 1
                            AND ix.exist('@QueryHash') = 1
                        )
SELECT StmtSimple.value('StmtSimple[1]/@StatementText', 'VARCHAR(4000)') AS sql_text,
    StmtSimple.value('StmtSimple[1]/@StatementId', 'int') AS StatementId,
    c1.value('@NodeId','int') AS node_id,
    c2.value('@Database','sysname') AS database_name,
    c2.value('@Schema','sysname') AS [schema_name],
    c2.value('@Table','sysname') AS table_name,
    c2.value('@Index','sysname') AS [index],
    c2.value('@IndexKind','sysname') AS index_type,
    c1.value('@PhysicalOp','sysname') AS physical_op,
    c1.value('@LogicalOp','sysname') AS logical_op,
    c1.value('@TableCardinality','sysname') AS table_cardinality,
    c1.value('@EstimateRows','sysname') AS estimate_rows,
    c1.value('@AvgRowSize','sysname') AS avg_row_size,
    ps.objtype,
    ps.usecounts,
    ps.query_plan,
    StmtSimple.value('StmtSimple[1]/@QueryHash', 'VARCHAR(100)') AS query_hash,
    StmtSimple.value('StmtSimple[1]/@QueryPlanHash', 'VARCHAR(100)') AS query_plan_hash,
    StmtSimple.value('StmtSimple[1]/@StatementSubTreeCost', 'sysname') AS StatementSubTreeCost,
    c1.value('@EstimatedTotalSubtreeCost','sysname') AS EstimatedTotalSubtreeCost,
    StmtSimple.value('StmtSimple[1]/@StatementOptmEarlyAbortReason', 'sysname') AS StatementOptmEarlyAbortReason,
    StmtSimple.value('StmtSimple[1]/@StatementOptmLevel', 'sysname') AS StatementOptmLevel,
    ps.plan_handle
FROM ParallelSearch ps
CROSS APPLY StmtSimple.nodes('//Parallelism//RelOp') AS q1(c1)
CROSS APPLY c1.nodes('.//IndexScan/Object') AS q2(c2)
WHERE c1.value('@Parallel','int') = 1
    AND (c1.exist('@PhysicalOp[. = "Index Scan"]') = 1
    OR c1.exist('@PhysicalOp[. = "Clustered Index Scan"]') = 1
    OR c1.exist('@PhysicalOp[. = "Index Seek"]') = 1
    OR c1.exist('@PhysicalOp[. = "Clustered Index Seek"]') = 1
    OR c1.exist('@PhysicalOp[. = "Table Scan"]') = 1)
    AND c2.value('@Schema','sysname') <> '[sys]'
OPTION(RECOMPILE, MAXDOP 1);
GO
With this kind of output:
Querying the plan cache for plans that use parallelism, and worker time > elapsed time
One of the ways to find inefficient query plans in an OLTP environment is to look for parallel plans that use more scheduler time than the elapsed time it took to run a query. Although this is not always the case, looking for such patterns might allow us to identify opportunities to fix queries where parallelism is not being used to the workloads benefit.
 -- Querying the plan cache for plans that use parallelism, and worker time > elapsed time
SET TRANSACTION ISOLATION LEVEL READ UNCOMMITTED;
WITH XMLNAMESPACES (DEFAULT 'https://schemas.microsoft.com/sqlserver/2004/07/showplan'),
    ParallelSearch AS (SELECT qp.query_plan, cp.usecounts, cp.objtype, qs.[total_worker_time],
                            qs.[total_elapsed_time], qs.[execution_count],
                            ix.query('.') AS StmtSimple, cp.plan_handle
                        FROM sys.dm_exec_cached_plans cp (NOLOCK)
                        INNER JOIN sys.dm_exec_query_stats qs (NOLOCK) ON cp.plan_handle = qs.plan_handle
                        CROSS APPLY sys.dm_exec_query_plan(cp.plan_handle) qp
                        CROSS APPLY qp.query_plan.nodes('//StmtSimple') AS p(ix)
                        WHERE cp.cacheobjtype = 'Compiled Plan'
                            AND ix.exist('//RelOp[@Parallel = "1"]') = 1
                            AND ix.exist('@QueryHash') = 1
                            AND (qs.[total_worker_time]/qs.[execution_count]) >
                                (qs.[total_elapsed_time]/qs.[execution_count])
                        )
SELECT StmtSimple.value('StmtSimple[1]/@StatementText', 'VARCHAR(4000)') AS sql_text,
    ps.objtype,
    ps.usecounts,
    ps.[total_worker_time]/ps.[execution_count] AS avg_worker_time,
    ps.[total_elapsed_time]/ps.[execution_count] As avg_elapsed_time,
    ps.query_plan,
    StmtSimple.value('StmtSimple[1]/@QueryHash', 'VARCHAR(100)') AS query_hash,
    StmtSimple.value('StmtSimple[1]/@QueryPlanHash', 'VARCHAR(100)') AS query_plan_hash,
    StmtSimple.value('StmtSimple[1]/@StatementSubTreeCost', 'sysname') AS StatementSubTreeCost,
    StmtSimple.value('StmtSimple[1]/@StatementOptmEarlyAbortReason', 'sysname') AS StatementOptmEarlyAbortReason,
    StmtSimple.value('StmtSimple[1]/@StatementOptmLevel', 'sysname') AS StatementOptmLevel,
    ps.plan_handle
FROM ParallelSearch ps
CROSS APPLY StmtSimple.nodes('//RelOp[1]') AS q1(c1)
WHERE c1.value('@Parallel','int') = 1 AND c1.value('@NodeId','int') = 0
OPTION(RECOMPILE, MAXDOP 1);
GO
Its output will resemble this:
Querying the plan cache for plans that use parallelism, and worker time > elapsed time, with more details
The above can be completed with more details, such as below:
 -- Querying the plan cache for plans that use parallelism, and worker time > elapsed time and more detailed output
SET TRANSACTION ISOLATION LEVEL READ UNCOMMITTED;
WITH XMLNAMESPACES (DEFAULT 'https://schemas.microsoft.com/sqlserver/2004/07/showplan'),
    ParallelSearch AS (SELECT qp.query_plan, cp.usecounts, cp.objtype, qs.[total_worker_time], qs.[total_elapsed_time], qs.[execution_count],
                            ix.query('.') AS StmtSimple, cp.plan_handle
                        FROM sys.dm_exec_cached_plans cp (NOLOCK)
                        INNER JOIN sys.dm_exec_query_stats qs (NOLOCK) ON cp.plan_handle = qs.plan_handle
                        CROSS APPLY sys.dm_exec_query_plan(cp.plan_handle) qp
                        CROSS APPLY qp.query_plan.nodes('//StmtSimple') AS p(ix)
                        WHERE cp.cacheobjtype = 'Compiled Plan'
                            AND ix.exist('//RelOp[@Parallel = "1"]') = 1
                            AND ix.exist('@QueryHash') = 1
                            AND (qs.[total_worker_time]/qs.[execution_count]) > (qs.[total_elapsed_time]/qs.[execution_count])
                        )
SELECT StmtSimple.value('StmtSimple[1]/@StatementText', 'VARCHAR(4000)') AS sql_text,
    StmtSimple.value('StmtSimple[1]/@StatementId', 'int') AS StatementId,
    c1.value('@NodeId','int') AS node_id,
    c2.value('@Database','sysname') AS database_name,
    c2.value('@Schema','sysname') AS [schema_name],
    c2.value('@Table','sysname') AS table_name,
    c2.value('@Index','sysname') AS [index],
    c2.value('@IndexKind','sysname') AS index_type,
    c1.value('@PhysicalOp','sysname') AS physical_op,
    c1.value('@LogicalOp','sysname') AS logical_op,
    c1.value('@TableCardinality','sysname') AS table_cardinality,
    c1.value('@EstimateRows','sysname') AS estimate_rows,
    c1.value('@AvgRowSize','sysname') AS avg_row_size,
    ps.objtype,
    ps.usecounts,
    ps.[total_worker_time]/ps.[execution_count] AS avg_worker_time,
    ps.[total_elapsed_time]/ps.[execution_count] As avg_elapsed_time,
    ps.query_plan,
    StmtSimple.value('StmtSimple[1]/@QueryHash', 'VARCHAR(100)') AS query_hash,
    StmtSimple.value('StmtSimple[1]/@QueryPlanHash', 'VARCHAR(100)') AS query_plan_hash,
    StmtSimple.value('StmtSimple[1]/@StatementSubTreeCost', 'sysname') AS StatementSubTreeCost,
    c1.value('@EstimatedTotalSubtreeCost','sysname') AS EstimatedTotalSubtreeCost,
    StmtSimple.value('StmtSimple[1]/@StatementOptmEarlyAbortReason', 'sysname') AS StatementOptmEarlyAbortReason,
    StmtSimple.value('StmtSimple[1]/@StatementOptmLevel', 'sysname') AS StatementOptmLevel,
    ps.plan_handle
FROM ParallelSearch ps
CROSS APPLY StmtSimple.nodes('//Parallelism//RelOp') AS q1(c1)
OUTER APPLY c1.nodes('.//IndexScan/Object') AS q2(c2)
WHERE c1.value('@Parallel','int') = 1
    AND (c1.exist('@PhysicalOp[. = "Index Scan"]') = 1
    OR c1.exist('@PhysicalOp[. = "Clustered Index Scan"]') = 1
    OR c1.exist('@PhysicalOp[. = "Index Seek"]') = 1
    OR c1.exist('@PhysicalOp[. = "Clustered Index Seek"]') = 1
    OR c1.exist('@PhysicalOp[. = "Table Scan"]') = 1)
    AND c2.value('@Schema','sysname') <> '[sys]'
OPTION(RECOMPILE, MAXDOP 1);
GO
With a slightly different output:
That’s it, hope you find these useful.
Until next time!
Disclaimer: I hope that the information on these pages is valuable to you. Your use of the information contained in these pages, however, is at your sole risk. All information on these pages is provided "as -is", without any warranty, whether express or implied, of its accuracy, completeness, fitness for a particular purpose, title or non-infringement, and none of the third-party products or information mentioned in the work are authored, recommended, supported or guaranteed by Ezequiel. Further, Ezequiel shall not be liable for any damages you may sustain by using this information, whether direct, indirect, special, incidental or consequential, even if it has been advised of the possibility of such damages.
Comments
- Anonymous
August 24, 2016
Excellent pool of useful plan cache queries. Thanks


