Wyróżnianie punktów danych w wizualizacjach usługi Power BI
W tym artykule opisano sposób wyróżniania danych w wizualizacjach usługi Power BI.
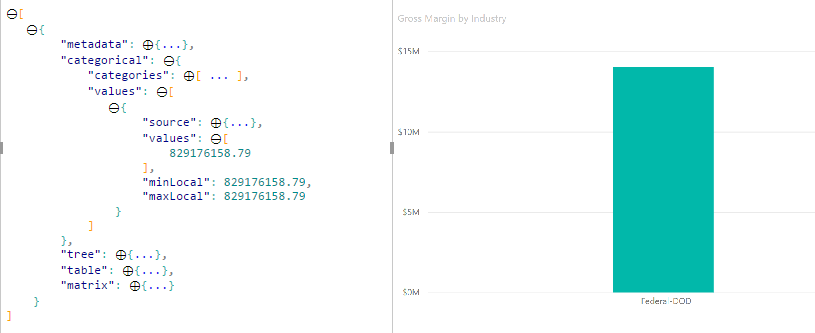
Domyślnie po wybraniu elementu tablica values w dataView obiekcie jest filtrowana tak, aby pokazywała tylko wybrane wartości. Gdy tablica values jest filtrowana, wszystkie inne wizualizacje na stronie pokazują tylko wybrane dane.
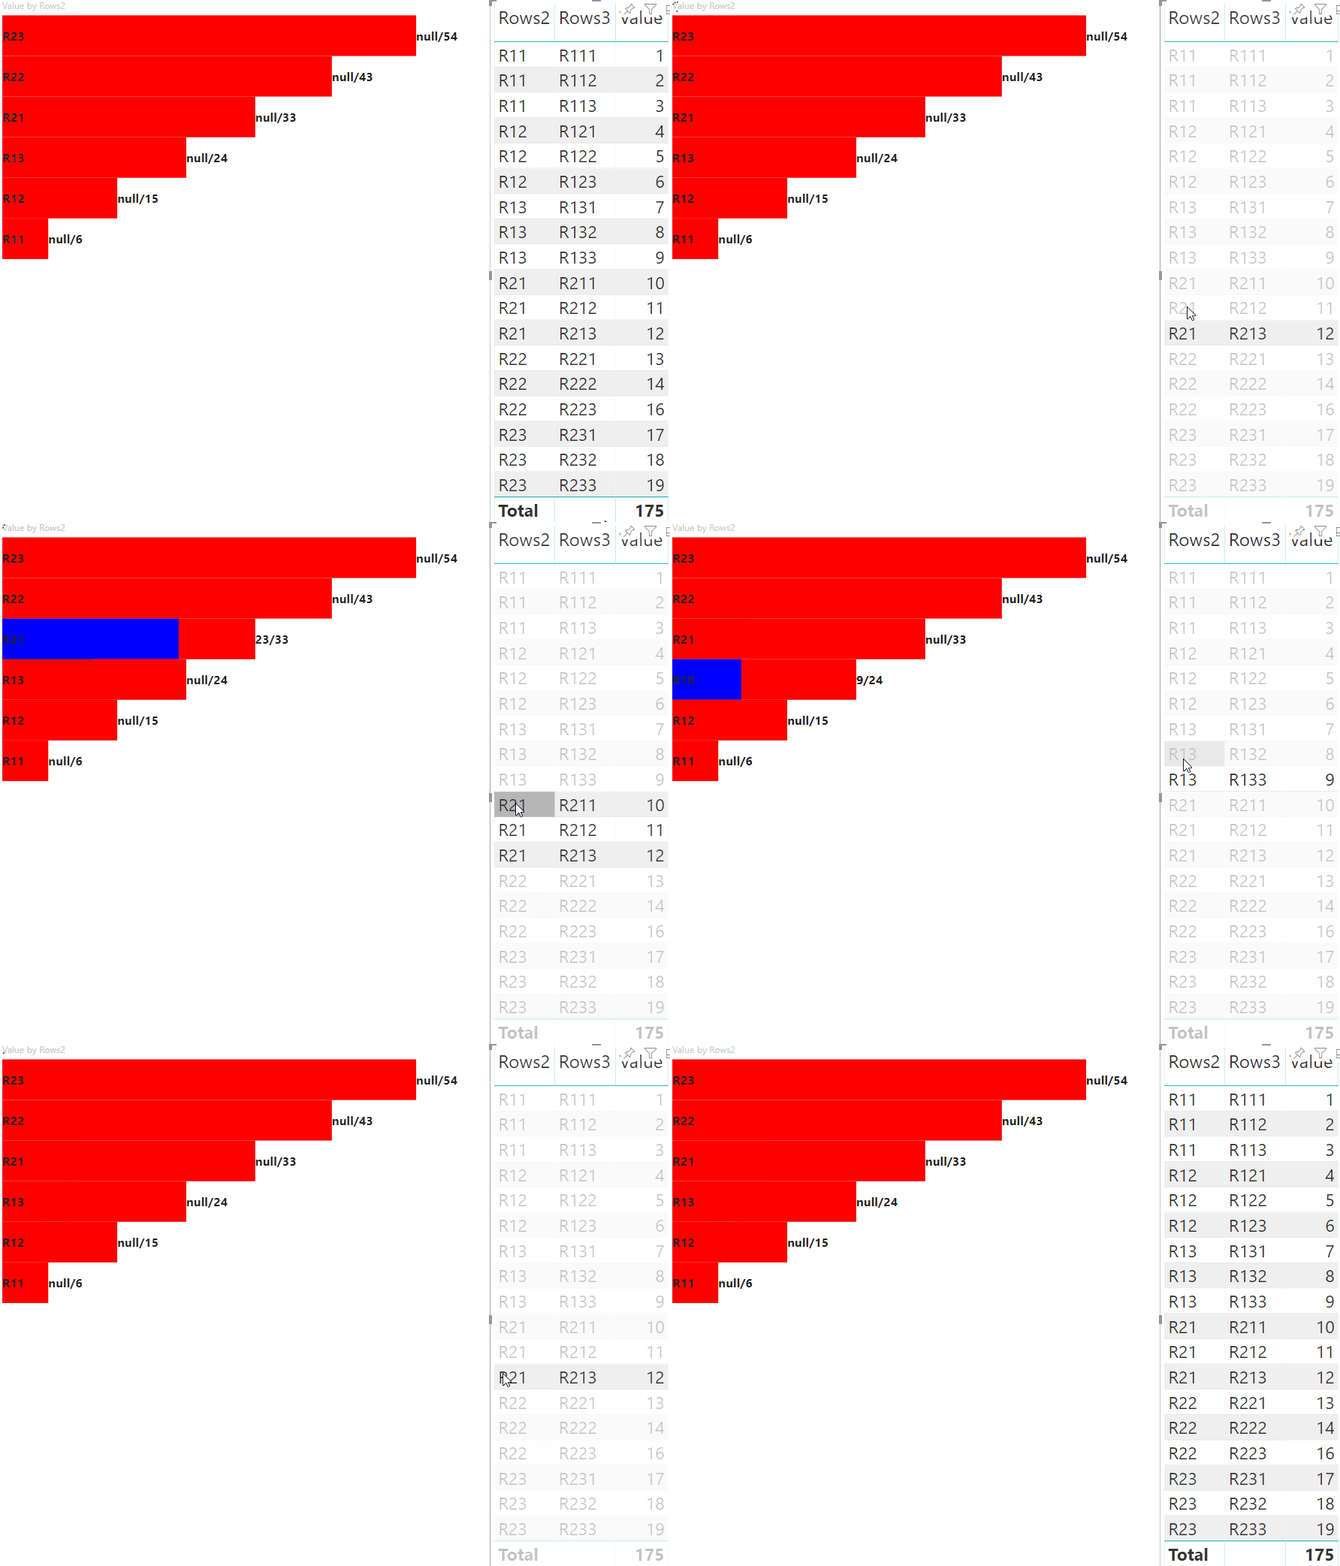
Jeśli właściwość w capabilities.json pliku zostanie ustawiona supportsHighlight na truewartość , spowoduje to wyświetlenie pełnej niefiltrowanej values tablicy wraz z tablicąhighlights. Tablica highlights ma taką samą długość jak tablica wartości, a wszystkie niezaznaczone wartości są ustawione na nullwartość . Po włączeniu tej właściwości odpowiednie dane w wizualizacji są wyróżnione przez porównanie values tablicy z tablicą highlights .
W przykładzie zwróć uwagę, że:
- Bez obsługi wyróżniania zaznaczenie jest jedyną wartością
valuesw tablicy i jedynym paskiem przedstawionym w widoku danych. - Dzięki obsłudze wyróżniania wszystkie wartości znajdują się w tablicy
values. Tablicahighlightszawieranullwartość elementów nie wyróżnionych. Wszystkie paski są wyświetlane w widoku danych, a wyróżniony pasek jest inny.
Można również zaznaczyć wiele opcji i częściowych wyróżnień. Wyróżnione wartości są prezentowane w widoku danych.
Uwaga
Mapowanie widoku danych tabeli nie obsługuje funkcji wyróżniania.
Wyróżnianie punktów danych za pomocą mapowania widoku danych kategorii
W przypadku wizualizacji z mapowaniem widoku danych kategorii dodaj "supportsHighlight": true do capabilities.json pliku. Na przykład:
{
    "dataRoles": [
        {
            "displayName": "Category",
            "name": "category",
            "kind": "Grouping"
        },
        {
            "displayName": "Value",
            "name": "value",
            "kind": "Measure"
        }
    ],
    "dataViewMappings": [
        {
            "categorical": {
                "categories": {
                    "for": {
                        "in": "category"
                    }
                },
                "values": {
                    "for": {
                        "in": "value"
                    }
                }
            }
        }
    ],
    "supportsHighlight": true
}
Po usunięciu niepotrzebnego kodu domyślny kod źródłowy wizualizacji wygląda podobnie do następującego przykładu:
"use strict";

// ... default imports list

import { FormattingSettingsService } from "powerbi-visuals-utils-formattingmodel";

import DataViewCategorical = powerbi.DataViewCategorical;
import DataViewCategoryColumn = powerbi.DataViewCategoryColumn;
import PrimitiveValue = powerbi.PrimitiveValue;
import DataViewValueColumn = powerbi.DataViewValueColumn;

import { VisualFormattingSettingsModel } from "./settings";

export class Visual implements IVisual {
    private target: HTMLElement;
    private formattingSettings: VisualFormattingSettingsModel;
    private formattingSettingsService: FormattingSettingsService;

    constructor(options: VisualConstructorOptions) {
        console.log('Visual constructor', options);
        this.formattingSettingsService = new FormattingSettingsService();
        this.target = options.element;
        this.host = options.host;
    }

    public update(options: VisualUpdateOptions) {
        this.formattingSettings = this.formattingSettingsService.populateFormattingSettingsModel(VisualFormattingSettingsModel, options.dataViews);
        console.log('Visual update', options);

    }

    // Returns properties pane formatting model content hierarchies, properties and latest formatting values, Then populate properties pane.
    // This method is called once every time we open properties pane or when the user edit any format property.
    public getFormattingModel(): powerbi.visuals.FormattingModel {
        return this.formattingSettingsService.buildFormattingModel(this.formattingSettings);
    }
}
Zaimportuj wymagane interfejsy do przetwarzania danych z usługi Power BI:
import DataViewCategorical = powerbi.DataViewCategorical;
import DataViewCategoryColumn = powerbi.DataViewCategoryColumn;
import PrimitiveValue = powerbi.PrimitiveValue;
import DataViewValueColumn = powerbi.DataViewValueColumn;
Utwórz element główny div dla wartości kategorii:
export class Visual implements IVisual {
    private target: HTMLElement;
    private formattingSettings: VisualFormattingSettingsModel;
    private formattingSettingsService: FormattingSettingsService;

    private div: HTMLDivElement; // new property

    constructor(options: VisualConstructorOptions) {
        console.log('Visual constructor', options);
        this.formattingSettingsService = new FormattingSettingsService();
        this.target = options.element;
        this.host = options.host;

        // create div element
        this.div = document.createElement("div");
        this.div.classList.add("vertical");
        this.target.appendChild(this.div);

    }
    // ...
}
Wyczyść zawartość elementów div przed renderowaniem nowych danych:
// ...
public update(options: VisualUpdateOptions) {
    this.formattingSettings = this.formattingSettingsService.populateFormattingSettingsModel(VisualFormattingSettingsModel, options.dataViews);
    console.log('Visual update', options);

    while (this.div.firstChild) {
        this.div.removeChild(this.div.firstChild);
    }
    // ...
}
Pobierz kategorie i wartości miar z dataView obiektu:
public update(options: VisualUpdateOptions) {
    this.formattingSettings = this.formattingSettingsService.populateFormattingSettingsModel(VisualFormattingSettingsModel, options.dataViews);
    console.log('Visual update', options);

    while (this.div.firstChild) {
        this.div.removeChild(this.div.firstChild);
    }

    const dataView: DataView = options.dataViews[0];
    const categoricalDataView: DataViewCategorical = dataView.categorical;
    const categories: DataViewCategoryColumn = categoricalDataView.categories[0];
    const categoryValues = categories.values;

    const measures: DataViewValueColumn = categoricalDataView.values[0];
    const measureValues = measures.values;
    const measureHighlights = measures.highlights;
    // ...
}
Gdzie categoryValues jest tablicą wartości kategorii, measureValues jest tablicą miar i measureHighlights jest wyróżnionych części wartości.
Uwaga
Jeśli wartości measureHighlights właściwości są mniejsze niż wartości categoryValues właściwości, wartość została częściowo wyróżniona.
Wylicz tablicę categoryValues i uzyskaj odpowiednie wartości i wyróżnienia:
// ...
const measureHighlights = measures.highlights;

categoryValues.forEach((category: PrimitiveValue, index: number) => {
    const measureValue = measureValues[index];
    const measureHighlight = measureHighlights && measureHighlights[index] ? measureHighlights[index] : null;
    console.log(category, measureValue, measureHighlight);

});
Tworzenie div elementów i p wyświetlanie i wizualizowanie wartości widoku danych w wizualizacji DOM:
categoryValues.forEach((category: PrimitiveValue, index: number) => {
    const measureValue = measureValues[index];
    const measureHighlight = measureHighlights && measureHighlights[index] ? measureHighlights[index] : null;
    console.log(category, measureValue, measureHighlight);

    // div element. it contains elements to display values and visualize value as progress bar
    let div = document.createElement("div");
    div.classList.add("horizontal");
    this.div.appendChild(div);

    // div element to visualize value of measure
    let barValue = document.createElement("div");
    barValue.style.width = +measureValue * 10 + "px";
    barValue.style.display = "flex";
    barValue.classList.add("value");

    // element to display category value
    let bp = document.createElement("p");
    bp.innerText = category.toString();

    // div element to visualize highlight of measure
    let barHighlight = document.createElement("div");
    barHighlight.classList.add("highlight")
    barHighlight.style.backgroundColor = "blue";
    barHighlight.style.width = +measureHighlight * 10 + "px";

    // element to display highlighted value of measure
    let p = document.createElement("p");
    p.innerText = `${measureHighlight}/${measureValue}`;
    barHighlight.appendChild(bp);

    div.appendChild(barValue);

    barValue.appendChild(barHighlight);
    div.appendChild(p);
});
Zastosuj wymagane style dla elementów, aby użyć flexboxelementu , i zdefiniuj kolory dla elementów div:
div.vertical {
    display: flex;
    flex-direction: column;
}

div.horizontal {
    display: flex;
    flex-direction: row;
}

div.highlight {
    background-color: blue
}

div.value {
    background-color: red;
    display: flex;
}
Następujący widok wizualizacji jest wynikiem:

Wyróżnianie punktów danych za pomocą mapowania widoku danych macierzy
W przypadku wizualizacji z mapowaniem widoku danych macierzy dodaj "supportsHighlight": true do capabilities.json pliku. Na przykład:
{
    "dataRoles": [
        {
            "displayName": "Columns",
            "name": "columns",
            "kind": "Grouping"
        },
        {
            "displayName": "Rows",
            "name": "rows",
            "kind": "Grouping"
        },
        {
            "displayName": "Value",
            "name": "value",
            "kind": "Measure"
        }
    ],
    "dataViewMappings": [
        {
            "matrix": {
                "columns": {
                    "for": {
                        "in": "columns"
                    }
                },
                "rows": {
                    "for": {
                        "in": "rows"
                    }
                },
                "values": {
                    "for": {
                        "in": "value"
                    }
                }
            }
        }
    ],
    "supportsHighlight": true
}
Przykładowe dane służące do tworzenia hierarchii mapowania widoku danych macierzy:
| Wiersz1 | Wiersz 2 | Wiersz3 | Column1 | Kolumna2 | Kolumna3 | Wartości |
|---|---|---|---|---|---|---|
| R1 | R11 | R111 | C1 | C11 | C111 | 1 |
| R1 | R11 | R112 | C1 | C11 | C112 | 2 |
| R1 | R11 | R113 | C1 | C11 | C113 | 3 |
| R1 | R12 | R121 | C1 | C12 | C121 | 100 |
| R1 | R12 | R122 | C1 | C12 | C122 | 5 |
| R1 | R12 | R123 | C1 | C12 | C123 | 6 |
| R1 | R13 | R131 | C1 | C13 | C131 | 7 |
| R1 | R13 | R132 | C1 | C13 | C132 | 8 |
| R1 | R13 | R133 | C1 | C13 | C133 | 9 |
| R2 | R21 | R211 | C2 | C21 | C211 | 10 |
| R2 | R21 | R212 | C2 | C21 | C212 | 11 |
| R2 | R21 | R213 | C2 | C21 | C213 | 12 |
| R2 | R22 | R221 | C2 | C22 | C221 | 13 |
| R2 | R22 | R222 | C2 | C22 | C222 | 14 |
| R2 | R22 | R223 | C2 | C22 | C223 | 16 |
| R2 | R23 | R231 | C2 | C23 | C231 | 17 |
| R2 | R23 | R232 | C2 | C23 | C232 | 18 |
| R2 | R23 | R233 | C2 | C23 | C233 | 19 |
Utwórz domyślny projekt wizualny i zastosuj przykładowy capabilities.json plik.
Po usunięciu niepotrzebnego kodu domyślny kod źródłowy wizualizacji wygląda podobnie do następującego przykładu:
"use strict";

// ... default imports

import { FormattingSettingsService } from "powerbi-visuals-utils-formattingmodel";
import { VisualFormattingSettingsModel } from "./settings";

export class Visual implements IVisual {
    private target: HTMLElement;
    private formattingSettings: VisualFormattingSettingsModel;
    private formattingSettingsService: FormattingSettingsService;

    constructor(options: VisualConstructorOptions) {
        console.log('Visual constructor', options);
        this.formattingSettingsService = new FormattingSettingsService();
        this.target = options.element;
        this.host = options.host;
    }

    public update(options: VisualUpdateOptions) {
        this.formattingSettings = this.formattingSettingsService.populateFormattingSettingsModel(VisualFormattingSettingsModel, options.dataViews);
        console.log('Visual update', options);

    }

   /**
     * Returns properties pane formatting model content hierarchies, properties and latest formatting values, Then populate properties pane.
     * This method is called once every time we open properties pane or when the user edit any format property.
     */
    public getFormattingModel(): powerbi.visuals.FormattingModel {
        return this.formattingSettingsService.buildFormattingModel(this.formattingSettings);
    }
}
Zaimportuj wymagane interfejsy do przetwarzania danych z usługi Power BI:
import DataViewMatrix = powerbi.DataViewMatrix;
import DataViewMatrixNode = powerbi.DataViewMatrixNode;
import DataViewHierarchyLevel = powerbi.DataViewHierarchyLevel;
Utwórz dwa div elementy dla układu wizualizacji:
constructor(options: VisualConstructorOptions) {
    // ...
    this.rowsDiv = document.createElement("div");
    this.target.appendChild(this.rowsDiv);

    this.colsDiv = document.createElement("div");
    this.target.appendChild(this.colsDiv);
    this.target.style.overflowY = "auto";
}
Sprawdź dane w metodzie update , aby upewnić się, że wizualizacja pobiera dane:
public update(options: VisualUpdateOptions) {
    this.formattingSettings = this.formattingSettingsService.populateFormattingSettingsModel(VisualFormattingSettingsModel, options.dataViews);
    console.log('Visual update', options);

    const dataView: DataView = options.dataViews[0];
    const matrixDataView: DataViewMatrix = dataView.matrix;

    if (!matrixDataView ||
        !matrixDataView.columns ||
        !matrixDataView.rows ) {
        return
    }
    // ...
}
Wyczyść zawartość div elementów przed renderowaniem nowych danych:
public update(options: VisualUpdateOptions) {
    // ...

    // remove old elements
    // to better performance use D3js pattern:
    // https://d3js.org/#enter-exit
    while (this.rowsDiv.firstChild) {
        this.rowsDiv.removeChild(this.rowsDiv.firstChild);
    }
    const prow = document.createElement("p");
    prow.innerText = "Rows";
    this.rowsDiv.appendChild(prow);

    while (this.colsDiv.firstChild) {
        this.colsDiv.removeChild(this.colsDiv.firstChild);
    }
    const pcol = document.createElement("p");
    pcol.innerText = "Columns";
    this.colsDiv.appendChild(pcol);
    // ...
}
Utwórz funkcję, treeWalker aby przejść przez strukturę danych macierzy:
public update(options: VisualUpdateOptions) {
    // ...
    const treeWalker = (matrixNode: DataViewMatrixNode, index: number, levels: DataViewHierarchyLevel[], div: HTMLDivElement)  => {

    }
    // ...
}
Gdzie matrixNode jest bieżącym węzłem, levels to kolumny metadanych tego poziomu hierarchii — div element nadrzędny dla podrzędnych elementów HTML.
Jest treeWalker to funkcja rekursywna, należy utworzyć div element i p tekst jako nagłówek, a następnie wywołać funkcję dla podrzędnych elementów węzła:
public update(options: VisualUpdateOptions) {
    // ...
    const treeWalker = (matrixNode: DataViewMatrixNode, index: number, levels: DataViewHierarchyLevel[], div: HTMLDivElement)  => {
        // ...

        if (matrixNode.children) {
            const childDiv = document.createElement("div");
            childDiv.classList.add("vertical");
            div.appendChild(childDiv);

            const p = document.createElement("p");
            const level = levels[matrixNode.level]; // get current level column metadata from current node
            p.innerText = level.sources[level.sources.length - 1].displayName; // get column name from metadata

            childDiv.appendChild(p); // add paragraph element to div element
            matrixNode.children.forEach((node, index) => treeWalker(node, levels, childDiv, ++levelIndex));
        }
    }
    // ...
}
Wywołaj funkcję dla elementów głównych kolumny i wiersza struktury widoku danych macierzy:
public update(options: VisualUpdateOptions) {
    // ...
    const treeWalker = (matrixNode: DataViewMatrixNode, index: number, levels: DataViewHierarchyLevel[], div: HTMLDivElement)  => {
        // ...
    }
    // ...
    // remove old elements
    // ...

    // ...
    const rowRoot: DataViewMatrixNode = matrixDataView.rows.root;
    rowRoot.children.forEach((node) => treeWalker(node, matrixDataView.rows.levels, this.rowsDiv));

    const colRoot = matrixDataView.columns.root;
    colRoot.children.forEach((node) => treeWalker(node, matrixDataView.columns.levels, this.colsDiv));
}
Wygeneruj identyfikator wyboru dla węzłów i przycisków Utwórz, aby wyświetlić węzły:
public update(options: VisualUpdateOptions) {
    // ...
    const treeWalker = (matrixNode: DataViewMatrixNode, index: number, levels: DataViewHierarchyLevel[], div: HTMLDivElement)  => {
        const selectionID: ISelectionID = this.host.createSelectionIdBuilder()
            .withMatrixNode(matrixNode, levels)
            .createSelectionId();

        let nodeBlock = document.createElement("button");
        nodeBlock.innerText = matrixNode.value.toString();

        nodeBlock.addEventListener("click", (event) => {
            // call select method in the selection manager
            this.selectionManager.select(selectionID);
        });

        nodeBlock.addEventListener("contextmenu", (event) => {
            // call showContextMenu method to display context menu on the visual
            this.selectionManager.showContextMenu(selectionID, {
                x: event.clientX,
                y: event.clientY
            });
            event.preventDefault();
        });
        // ...
    }
    // ...
}
Głównym krokiem wyróżniania jest utworzenie innej tablicy wartości.
Obiekt węzła terminalu ma dwie właściwości tablicy wartości, wartość i wyróżnienie:
JSON.stringify(options.dataViews[0].matrix.rows.root.children[0].children[0].children[0], null, " ");
{
 "level": 2,
 "levelValues": [
  {
   "value": "R233",
   "levelSourceIndex": 0
  }
 ],
 "value": "R233",
 "identity": {
  "identityIndex": 2
 },
 "values": {
  "0": {
   "value": null,
   "highlight": null
  },
  "1": {
   "value": 19,
   "highlight": 19
  }
 }
}
Gdzie value reprezentuje wartość węzła bez stosowania zaznaczenia z innej wizualizacji, wskazuje, highlight która część danych została wyróżniona.
Uwaga
Jeśli wartość parametru highlight jest mniejsza niż wartość value, value została częściowo wyróżniona.
Dodaj kod, aby przetworzyć tablicę values węzła, jeśli jest on przedstawiony:
public update(options: VisualUpdateOptions) {
    // ...
    const treeWalker = (matrixNode: DataViewMatrixNode, index: number, levels: DataViewHierarchyLevel[], div: HTMLDivElement)  => {
        // ...

        if (matrixNode.values) {
            const sumOfValues = Object.keys(matrixNode.values) // get key property of object (value are 0 to N)
                .map(key => +matrixNode.values[key].value) // convert key property to number
                .reduce((prev, curr) => prev + curr) // sum of values

            let sumOfHighlights = sumOfValues;
            sumOfHighlights = Object.keys(matrixNode.values) // get key property of object (value are 0 to N)
                .map(key => matrixNode.values[key].highlight ? +matrixNode.values[key].highlight : null ) // convert key property to number if it exists
                .reduce((prev, curr) => curr ? prev + curr : null) // convert key property to number

            // create div container for value and highlighted value
            const vals = document.createElement("div");
            vals.classList.add("vertical")
            vals.classList.replace("vertical", "horizontal");
            // create paragraph element for label
            const highlighted = document.createElement("p");
            // Display complete value and highlighted value
            highlighted.innerText = `${sumOfHighlights}/${sumOfValues}`;

            // create div container for value
            const valueDiv = document.createElement("div");
            valueDiv.style.width = sumOfValues * 10 + "px";
            valueDiv.classList.add("value");

            // create div container for highlighted values
            const highlightsDiv = document.createElement("div");
            highlightsDiv.style.width = sumOfHighlights * 10 + "px";
            highlightsDiv.classList.add("highlight");
            valueDiv.appendChild(highlightsDiv);

            // append button and paragraph to div containers to parent div
            vals.appendChild(nodeBlock);
            vals.appendChild(valueDiv);
            vals.appendChild(highlighted);
            div.appendChild(vals);
        } else {
            div.appendChild(nodeBlock);
        }

        if (matrixNode.children) {
            // ...
        }
    }
    // ...
}
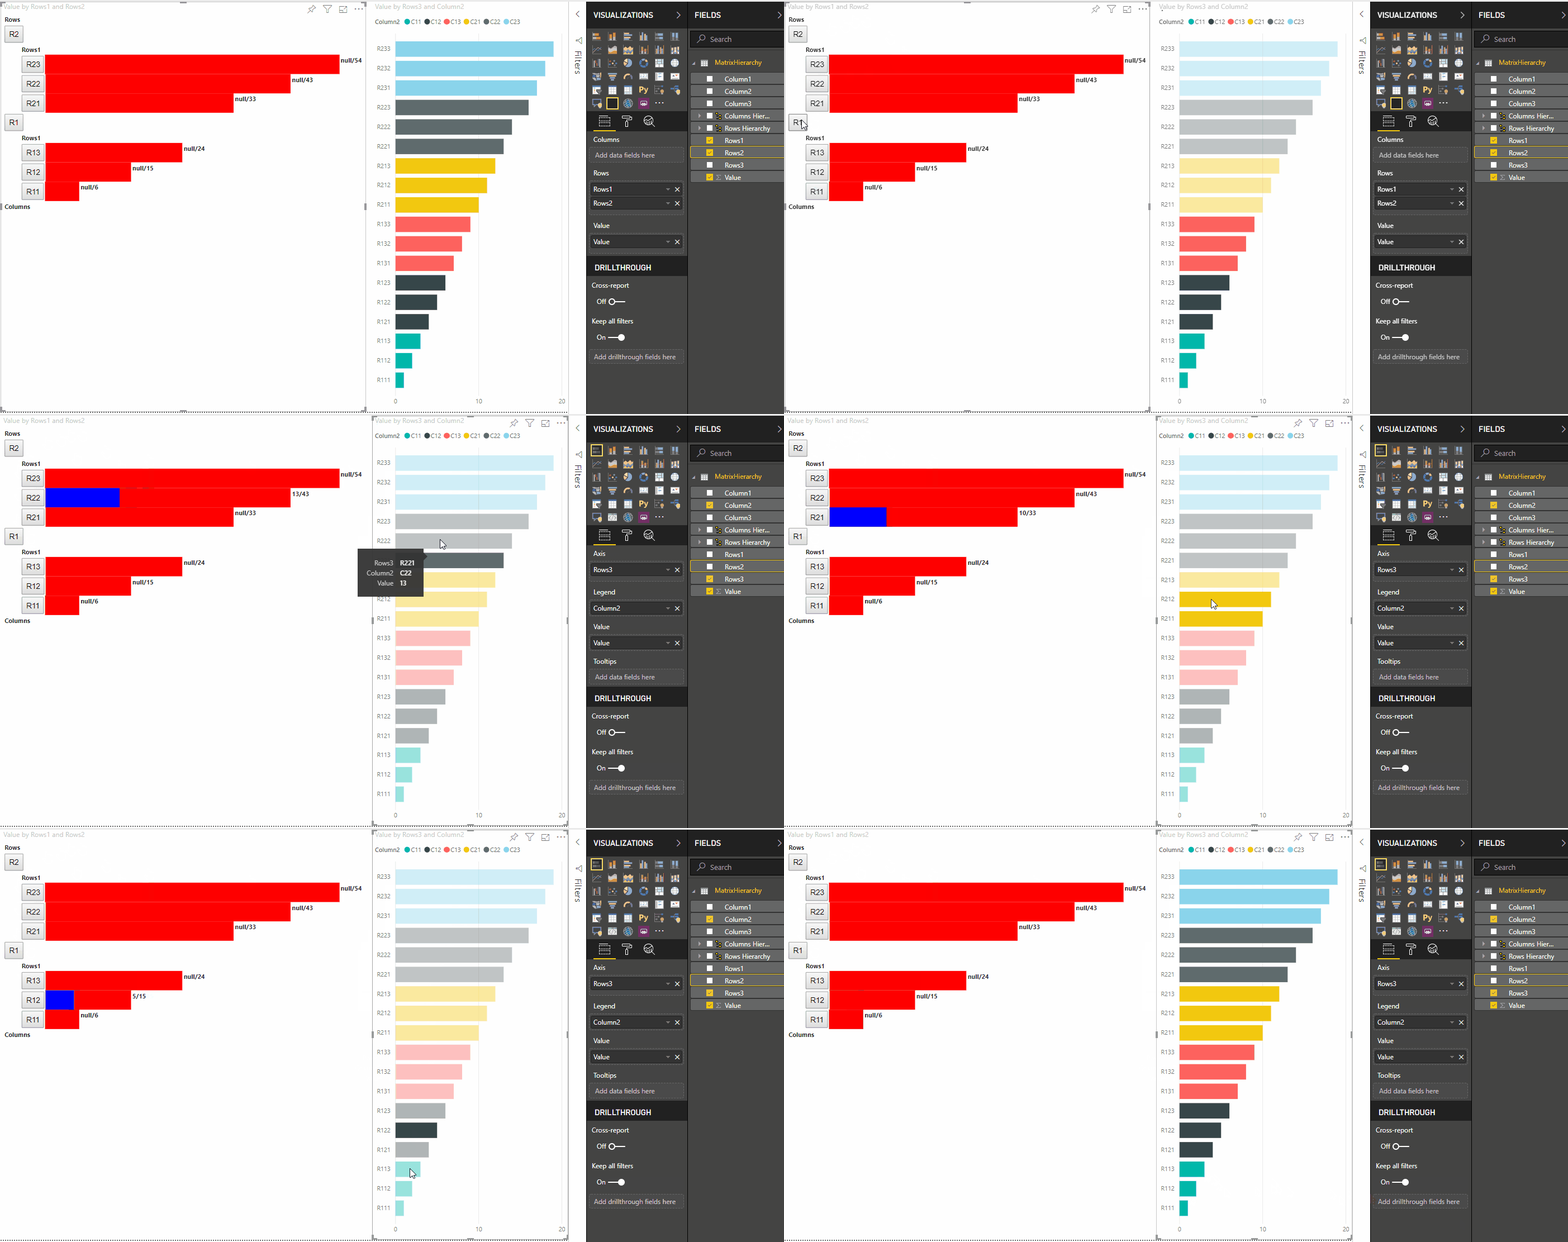
Wynik jest wizualizacją z przyciskami i wartościami, takimi jak highlighted value/default value.


