Pushing the Limits of Windows: Handles
This is the fifth post in my Pushing the Limits of Windows series where I explore the upper bound on the number and size of resources that Windows manages, such as physical memory, virtual memory, processes and threads. Here’s the index of the entire Pushing the Limits series. While they can stand on their own, they assume that you read them in order.
Pushing the Limits of Windows: Physical Memory
Pushing the Limits of Windows: Virtual Memory
Pushing the Limits of Windows: Paged and Nonpaged Pool
Pushing the Limits of Windows: Processes and Threads
Pushing the Limits of Windows: Handles
Pushing the Limits of Windows: USER and GDI Objects – Part 1
Pushing the Limits of Windows: USER and GDI Objects – Part 2
This time I’m going to go inside the implementation of handles to find and explain their limits. Handles are data structures that represent open instances of basic operating system objects applications interact with, such as files, registry keys, synchronization primitives, and shared memory. There are two limits related to the number of handles a process can create: the maximum number of handles the system sets for a process and the amount of memory available to store the handles and the objects the application is referencing with its handles.
In most cases the limits on handles are far beyond what typical applications or a system ever use. However, applications not designed with the limits in mind may push them in ways their developers don’t anticipate. A more common class of problems arise because the lifetime of these resources must be managed by applications and, just like for virtual memory, resource lifetime management is challenging even for the best developers. An application that fails to release unneeded resources causes a leak of the resource that can ultimately cause a limit to be hit, resulting in bizarre and difficult to diagnose behaviors for the application, other applications or the system in general.
As always, I recommend you read the previous posts because they explain some of the concepts this post references, like paged pool.
Handles and Objects
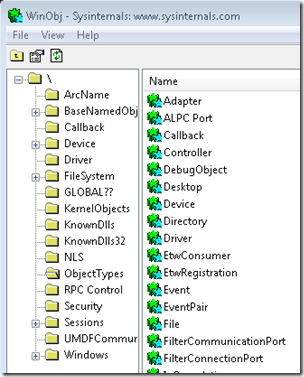
The kernel-mode core of Windows, which is implemented in the %SystemRoot%\System32\Ntoskrnl.exe image, consists of various subsystems such as the Memory Manager, Process Manager, I/O Manager, Configuration Manager (registry), which are all parts of the Executive. Each of these subsystems defines one or more types with the Object Manager to represent the resources they expose to applications. For example, the Configuration Manager defines the key object to represent an open registry key; the memory manager defines the Section object for shared memory; the Executive defines Semaphore, Mutant (the internal name for a mutex), and Event synchronization objects (these objects wrap fundamental data structures defined by the operating system’s Kernel subsystem); the I/O Manager defines the File object to represent open instances of device driver resources, which include file system files; and the Process Manager the creates Thread and Process objects I discussed in my last Pushing the Limits post. Every release of Windows introduces new object types with Windows 7 defining a total of 42. You can see the objects defined by running the Sysinternals Winobj utility with administrative rights and navigating to the ObjectTypes directory in the Object Manager namespace:
When an application wants to manage one of these resources it first must call the appropriate API to create or open the resource. For instance, the CreateFile function opens or creates a file, the RegOpenKeyEx function opens a registry key, and the CreateSemaphoreEx function opens or creates a semaphore. If the function succeeds, Windows allocates a handle in the handle table of the application’s process and returns the handle value, which applications treat as opaque but that is actually the index of the returned handle in the handle table.
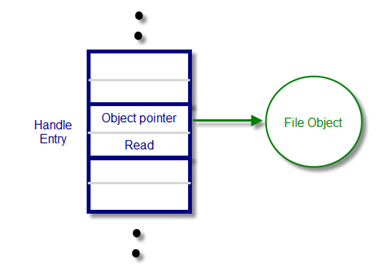
With the handle in hand, the application then queries or manipulates the object by passing the handle value to subsequent API functions like ReadFile, SetEvent, SetThreadPriority, and MapViewOfFile. The system can look up the object the handle refers to by indexing into the handle table to locate the corresponding handle entry, which contains a pointer to the object. The handle entry also stores the accesses the process was granted at the time it opened the object, which enables the system to make sure it doesn’t allow the process to perform an operation on the object for which it didn’t ask permission. For example, if the process successfully opened a file for read access, the handle entry would look like this:
If the process tried to write to the file, the function would fail because the access hadn’t been granted and the cached read access means that the system doesn’t have to execute a more expensive access-check again.
Maximum Number of Handles
You can explore the first limit with the Testlimit tool I’ve been using in this series to empirically explore limits. It’s available for download on the Windows Internals book page here. To test the number of handles a process can create, Testlimit implements the –h switch that directs it to create as many handles as possible. It does so by creating an event object with CreateEvent and then repeatedly duplicating the handle the system returns using DuplicateHandle. By duplicating the handle, Testlimit avoids creating new events and the only resources it consumes are those for the handle table entries. Here’s the result of Testlimit with the –h option on a 64-bit system:
The result doesn’t represent the total number of handles a process can create, however, because system DLLs open various objects during process initialization. You see a process’s total handle count by adding a handle count column to Task Manager or Process Explorer. The total shown for Testlimit in this case is 16,711,680:
When you run Testlimit on a 32-bit system, the number of handles it can create is slightly different:
Its total handle count is also different, 16,744,448:
Where do the differences come from? The answer lies in the way that the Executive, which is responsible for managing handle tables, sets the per-process handle limit, as well as the size of a handle table entry. In one of the rare cases where Windows sets a hard-coded upper limit on a resource, the Executive defines 16,777,216 (16*1024*1024) as the maximum number of handles a process can allocate. Any process that has more than a ten thousand handles open at any given point in time is likely either poorly designed or has a handle leak, so a limit of 16 million is essentially infinite and can simply help prevent a process with a leak from impacting the rest of the system. Understanding why the numbers Task Manager shows don’t equal the hard-coded maximum requires a look at the way the Executive organizes handle tables.
A handle table entry must be large enough to store the granted-access mask and an object pointer. The access mask is 32-bits, but the pointer size obviously depends on whether it’s a 32-bit or 64-bit system. Thus, a handle entry is 8-bytes on 32-bit Windows and 12-bytes on 64-bit Windows. 64-bit Windows aligns the handle entry data structure on 64-bit boundaries, so a 64-bit handle entry actually consumes 16-bytes. Here’s the definition for a handle entry on 64-bit Windows, as shown in a kernel debugger using the dt (dump type) command:
The output reveals that the structure is actually a union that can sometimes store information other than an object pointer and access mask, but those two fields are highlighted.
The Executive allocates handle tables on demand in page-sized blocks that it divides into handle table entries. That means a page, which is 4096 bytes on both x86 and x64, can store 512 entries on 32-bit Windows and 256 entries on 64-bit Windows. The Executive determines the maximum number of pages to allocate for handle entries by dividing the hard-coded maximum,16,777,216, by the number of handle entries in a page, which results on 32-bit Windows to 32,768 and on 64-bit Windows to 65,536. Because the Executive uses the first entry of each page for its own tracking information, the number of handles available to a process is actually 16,777,216 minus those numbers, which explains the results obtained by Testlimit: 16,777,216-65,536 is 16,711,680 and 16,777,216-65,536-32,768 is 16,744,448.
Handles and Paged Pool
The second limit affecting handles is the amount of memory required to store handle tables, which the Executive allocates from paged pool. The Executive uses a three-level scheme, similar to the way that processor Memory Management Units (MMUs) manage virtual to physical address translations, to keep track of the handle table pages that it allocates. We’ve already seen the organization of the lowest and mid levels, which store actual handle table entries. The top level serves as pointers into the mid-level tables and includes 1024 entries per-page on 32-bit Windows. The total number of pages required to store the maximum number of handles can therefore be calculated for 32-bit Windows as 16,777,216/512*4096, which is 128MB. That’s consistent with the paged pool usage of Testlimit as shown in Task Manager:
On 64-bit Windows, there are 256 pointers in a page of top-level pointers. That means the total paged pool usage for a full handle table is 16,777,216/256*4096, which is 256MB. A look at Testlimit’s paged pool usage on 64-bit Windows confirms the calculation:
Paged pool is generally large enough to more than accommodate those sizes, but as I stated earlier, a process that creates that many handles is almost certainly going to exhaust other resources, and if it reaches the per-process handle limit it will probably fail itself because it can’t open any other objects.
Handle Leaks
A handle leaker will have a handle count that rises over time. The reason that a handle leak is so insidious is that unlike the handles Testlimit creates, which all point to the same object, a process leaking handles is probably leaking objects as well. For example, if a process creates events but fails to close them, it will leak both handle entries and event objects. Event objects consume nonpaged pool, so the leak will impact nonpaged pool in addition to paged pool.
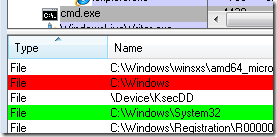
You can graphically spot the objects a process is leaking using Process Explorer’s handle view because it highlights new handles in green and closed handles in red; if you see lots of green with infrequent red then you might be seeing a leak. You can watch Process Explorer’s handle highlighting in action by opening a Command Prompt process, selecting the process in Process Explorer, opening the handle-view lower pane and then changing directory in the Command Prompt. The old working directory’s handle will highlight in red and the new one in green:
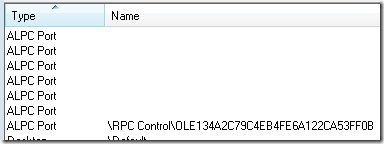
By default, Process Explorer only shows handles that reference objects that have names, which means that you won’t see all the handles a process is using unless you select Show Unnamed Handles and Mappings from the View menu. Here are some of the unnamed handles in Command Prompt’s handle table:
Just like most bugs, only the developer of the code that’s leaking can fix it. If you spot a leak in a process that can host multiple components or extensions, like Explorer, a Service Host or Internet Explorer, then the question is what component is the one responsible for the leak. Figuring that out might enable you to avoid the problem by disabling or uninstalling the problematic extension, fix the problem by checking for an update, or report the bug to the vendor.
Fortunately, Windows includes a handle tracing facility that you can use to help identify leaks and the responsible software. It’s enabled on a per-process basis and when active causes the Executive to record a stack trace at the time every handle is created or closed. You can enable it either by using the Application Verifier, a free download from Microsoft, or by using the Windows Debugger (Windbg). You should use the Application Verifier if you want the system to track a process’s handle activity from when it starts. In either case, you’ll need to use a debugger and the !htrace debugger command to view the trace information.
To demonstrate the tracing in action, I launched Windbg and attached to the Command Prompt I had opened earlier. I then executed the !htrace command with the -enable switch to turn on handle tracing:
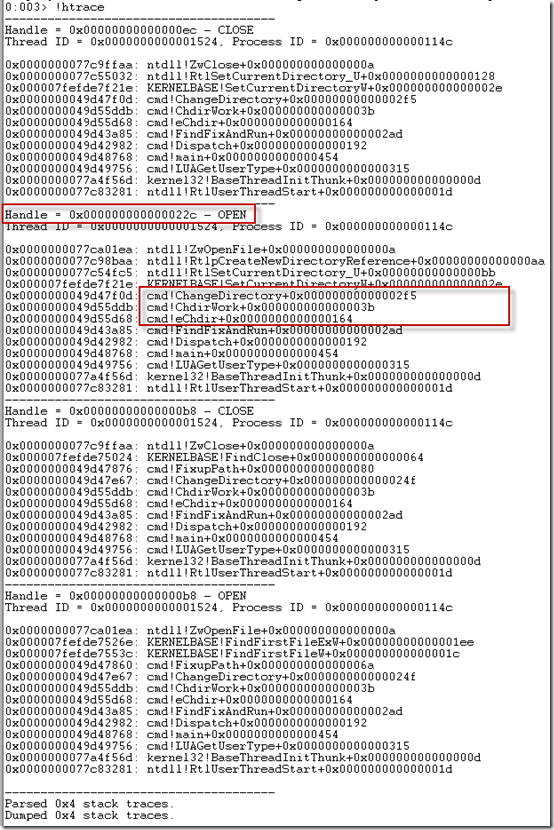
I let the process’s execution continue and changed directory again. Then I switched back to Windbg, stopped the process’s execution, and executed htrace without any options, which has it list all the open and close operations the process executed since the previous !htrace snapshot (created with the –snapshot option) or from when handle tracing was enabled. Here’s the output of the command for the same session:
The events are printed from most recent operation to least, so reading from the bottom, Command Prompt opened handle 0xb8, then closed it, next opened handle 0x22c, and finally closed handle 0xec. Process Explorer would show handle 0x22c in green and 0xec in red if it was refreshed after the directory change, but probably wouldn’t see 0xb8 unless it happened to refresh between the open and close of that handle. The stack for 0x22c’s open reveals that it was the result of Command Prompt (cmd.exe) executing its ChangeDirectory function. Adding the handle value column to Process Explorer confirms that the new handle is 0x22c:
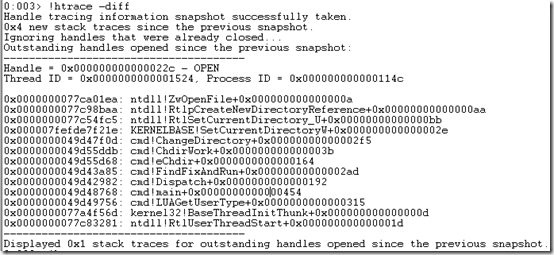
If you’re just looking for leaks, you should use !htrace with the –diff switch, which has it show only new handles since the last snapshot or start of tracing. Executing that command shows just handle 0x22c, as expected:
Finally, a great video that presents more tips for debugging handle leaks is this Channel 9 interview with Jeff Dailey, a Microsoft Escalation Engineer that debugs them for a living: https://channel9.msdn.com/posts/jeff_dailey/Understanding-handle-leaks-and-how-to-use-htrace-to-find-them/
Next time I’ll look at limits for a couple of other handle-based resources, GDI Object and USER Objects. Handles to those resources are managed by the Windows subsystem, not the Executive, so use different resources and have different limits.
Comments
Anonymous
January 01, 2003
You can find it here: http://technet.microsoft.com/en-us/sysinternals/bb963901.aspxAnonymous
January 01, 2003
Interesting and very explanatory. A great post, very useful. Thank you.Anonymous
January 01, 2003
What happened to the Testlimit utility? I cannot find it in the Sysinternals indexAnonymous
September 29, 2009
Another great post Mark! As someone who evaluates application stress tests, this series has been extremely useful in understanding some the fundamental resource limits within Windows. Thank you.Anonymous
October 01, 2009
It is allways a Great pleasure and a source of knowledge reading your post !Anonymous
October 01, 2009
Xcellent series and a great post by Mark. I signed off from my messenger to read this complete article.., and its worth it. Cheers' Vijay Raj MS-MVP [Setup-Deploy]Anonymous
October 02, 2009
Great tips. One question I have though: DuplicateHandle returns a new handle pointing to the same object. Is there a way to test this handle against another one to see if it's the same object?Anonymous
October 03, 2009
A case of handle leak: http://www.withinwindows.com/2009/08/09/nvidia-stereo-3d-vision-service-bug-causes-handle-leak/Anonymous
October 05, 2009
The comment has been removedAnonymous
October 15, 2009
Hi Mark, The missing part of this series: open TCP connections. Any chance of doing a write up on that one? Thanks.Anonymous
October 20, 2009
Mark thanks for this it's been a useful overview. As always your work is very informative.Anonymous
October 20, 2009
The comment has been removedAnonymous
October 23, 2009
GDI object limit is the most common resource problem that I run into, it will be interesting to read about. Most often I come across it when I'm going through my daily selection of webcomics, at some point Opera fails to show pictures, usually near 5000 GDI objects.Anonymous
October 29, 2009
Thanks Mark, I have used your Process Monitor year ago to debug very ugly handle leak problem in Creative driver for Soundblaster X-Fi on Windows XP. The final "stable" drivers were already 9 months old and only available was new beta (which solved the handle leak problem while bringing some new ones including crashing the volume mixer, nah).Anonymous
December 10, 2009
As always a great source of valuable information for the Windows Sys Admin!! I have recently encountered an unresponsive W2KR2_Ent_x64 system with a Nonpaged pool memory size reaching nearly 7GB on a 16GB system, due to an Oracle.exe 10.02 process having over 4 million handles open! Oracle was still functional and Windows returned back to normal once the offending application was shutdown.Anonymous
December 24, 2009
Thank you this post! I really enjoyed reading it. I have a question, pelase see if you can help. We have an Exchange 2003 Setup, and at times we get an unexpected volume of email from a mal function Application. This unexpected volume increase the handle count, new mail Event objects consume non paged pool memory and bring it to threshold a system cannot sustain. We wanted to Quantify NPP for every handle or Event objects ( In this case, it will be file (eMail), is it possible ? This is esntailly going to help us to set threshold for our monitoring and the way we trouble shoot.Anonymous
February 23, 2010
Hi Mark, Great article. I stumbled on the article while researching a nonpaged pool leak. I tracked the leak down to the poolmon event objects tag EVEN. I, eventually, checked the handles to discover a third party driver S7ADRV.exe with 1.5 million handles & climbing. This looks like the likely source of my leak. The driver provides a link between GeFanuc iFix SCADA application and Siemen's plcs. Any idea why a handle leak would cause a memory leak on the EVEN tag. The fact that the memory leak was showing up against the EVEN tag threw me off for a day.Anonymous
February 23, 2010
The comment has been removedAnonymous
March 22, 2010
Hi Mark First of all great blog and great post! i'm trying to debug a strange windows explorer behavior: it opens many handles on video files and never closes them (a similar behavior like the HKEY_CLASSES_ROOTSystemFileAssociations.avishellexPropertyHandler bug). My problem is that when i attach windbg to explorer.exe and turn on handle tracing my pc become unresponsiveness but windbg. I can trace only many close handle due to detaching debugger. Have you any suggestion? ThanksAnonymous
March 22, 2010
@giammin Use Process Monitor to check the stacks of the opens that don't have corresponding closes. Check for third-party modules in the stack. Symbol configuration will help, but is likely not necessary.Anonymous
June 04, 2010
Nice tutorial! Very well worth reading.Anonymous
July 15, 2010
This is by far the best explanation of Windows limits that I have seen. It has helped me track down the cause of mysterious system crashes on our Windows 2003 Terminal Server. Thank YouAnonymous
November 18, 2010
I just want to say that your review above is useful for us about how to understand about Handles issue. Good job Mark !!!
