Restart frequency in endpoint analytics
In endpoint analytics startup performance, we've provided insights into PC boot times, and how to improve the reboot times of poorly performing devices. Reboot frequency can affect a user's experience. A device that reboots daily due to Stop errors results in poor user experience even if the boot times are fast. We've recently added insights into restart frequencies within your organization to help you identify problematic devices.
Prerequisites
- Devices are enrolled in endpoint analytics.
- Enroll Configuration Manager devices
- Enroll Intune devices
- After enrollment, client devices require a restart to fully enable all analytics.
- Devices meet the endpoint analytics startup performance requirements.
- Devices enrolled from Configuration Manager need client version 2006, or later installed
Restart categories
Each restart is categorized into one of six categories. They're described as either abnormal shutdowns or normal shutdowns.
Abnormal shutdowns: Where the shutdown or restart didn't go through the normal Windows shutdown process. There are three categories for different types of abnormal shutdowns:
- Stop errors: You might also know these as blue screen errors. Stop errors should be infrequent, less than 2 per device per year is typical.
- Long power button press: When an end user holds the power button down to force a restart. These shutdowns should be less frequent than Stop errors (blue screen errors).
- Unknown: Any abnormal shutdown that isn't one of the above shutdowns. Over time we'll be refining this list as we isolate issues in this category.
Normal shutdowns: Where the shutdown or restart went through the normal Windows shutdown process. There are three categories for different types of normal shutdowns:
- Update: The restart was done to finish installation of a Windows update. Ideally there should be around one of these restarts per device per month. Less than once per month is problematic since it indicates devices aren't getting patched. More than once per month is also problematic as it indicates users are enduring more update restarts than is typically necessary.
- Shutdown (no update): Typically means someone is trying to save battery or power and isn't indicative of a poor user experience.
- Restart (no update): Ideally this category should be close to zero since there shouldn't be a reason to restart a device beyond monthly patching.
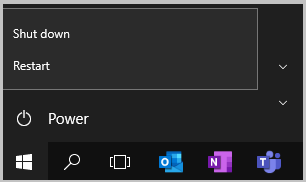
The difference between Shutdown (no update) and Restart (no update) is the user's action. A shutdown or restart doesn't have to be initiated through the start menu, it could be initiated other ways too.

Device performance tab
In the device performance tab, two default columns are available; total number of restarts and the number of Stop errors (blue screen errors) each device has had in the last 30 days. You can sort by these columns to find problematic devices. You can also use this tab to review the total number of devices that have sent restart records. For example, the screenshot shows 31 records, meaning 31 devices have sent restart data.
Note
In the Device performance tabs of Endpoint analytics, admins will only see devices they have access to according to their assigned Scope tags. To learn more about Scope tags, see Scope tags for distributed IT. Aggregated insights, such as scores and summary views are calculated using all enrolled devices in the tenant. To apply Scope tags to aggregated insights, see Device scopes in Endpoint analytics.
Model performance tab
In the model performance tab, two default columns have been added so you can review both the average number of restarts and the average number of Stop errors (blue screen errors) per model over the last 30 days. Sort by these columns to find problematic device models. Only models with at least 10 devices are shown to ensure the averages are done across enough devices to be meaningful.
Restart frequency tab
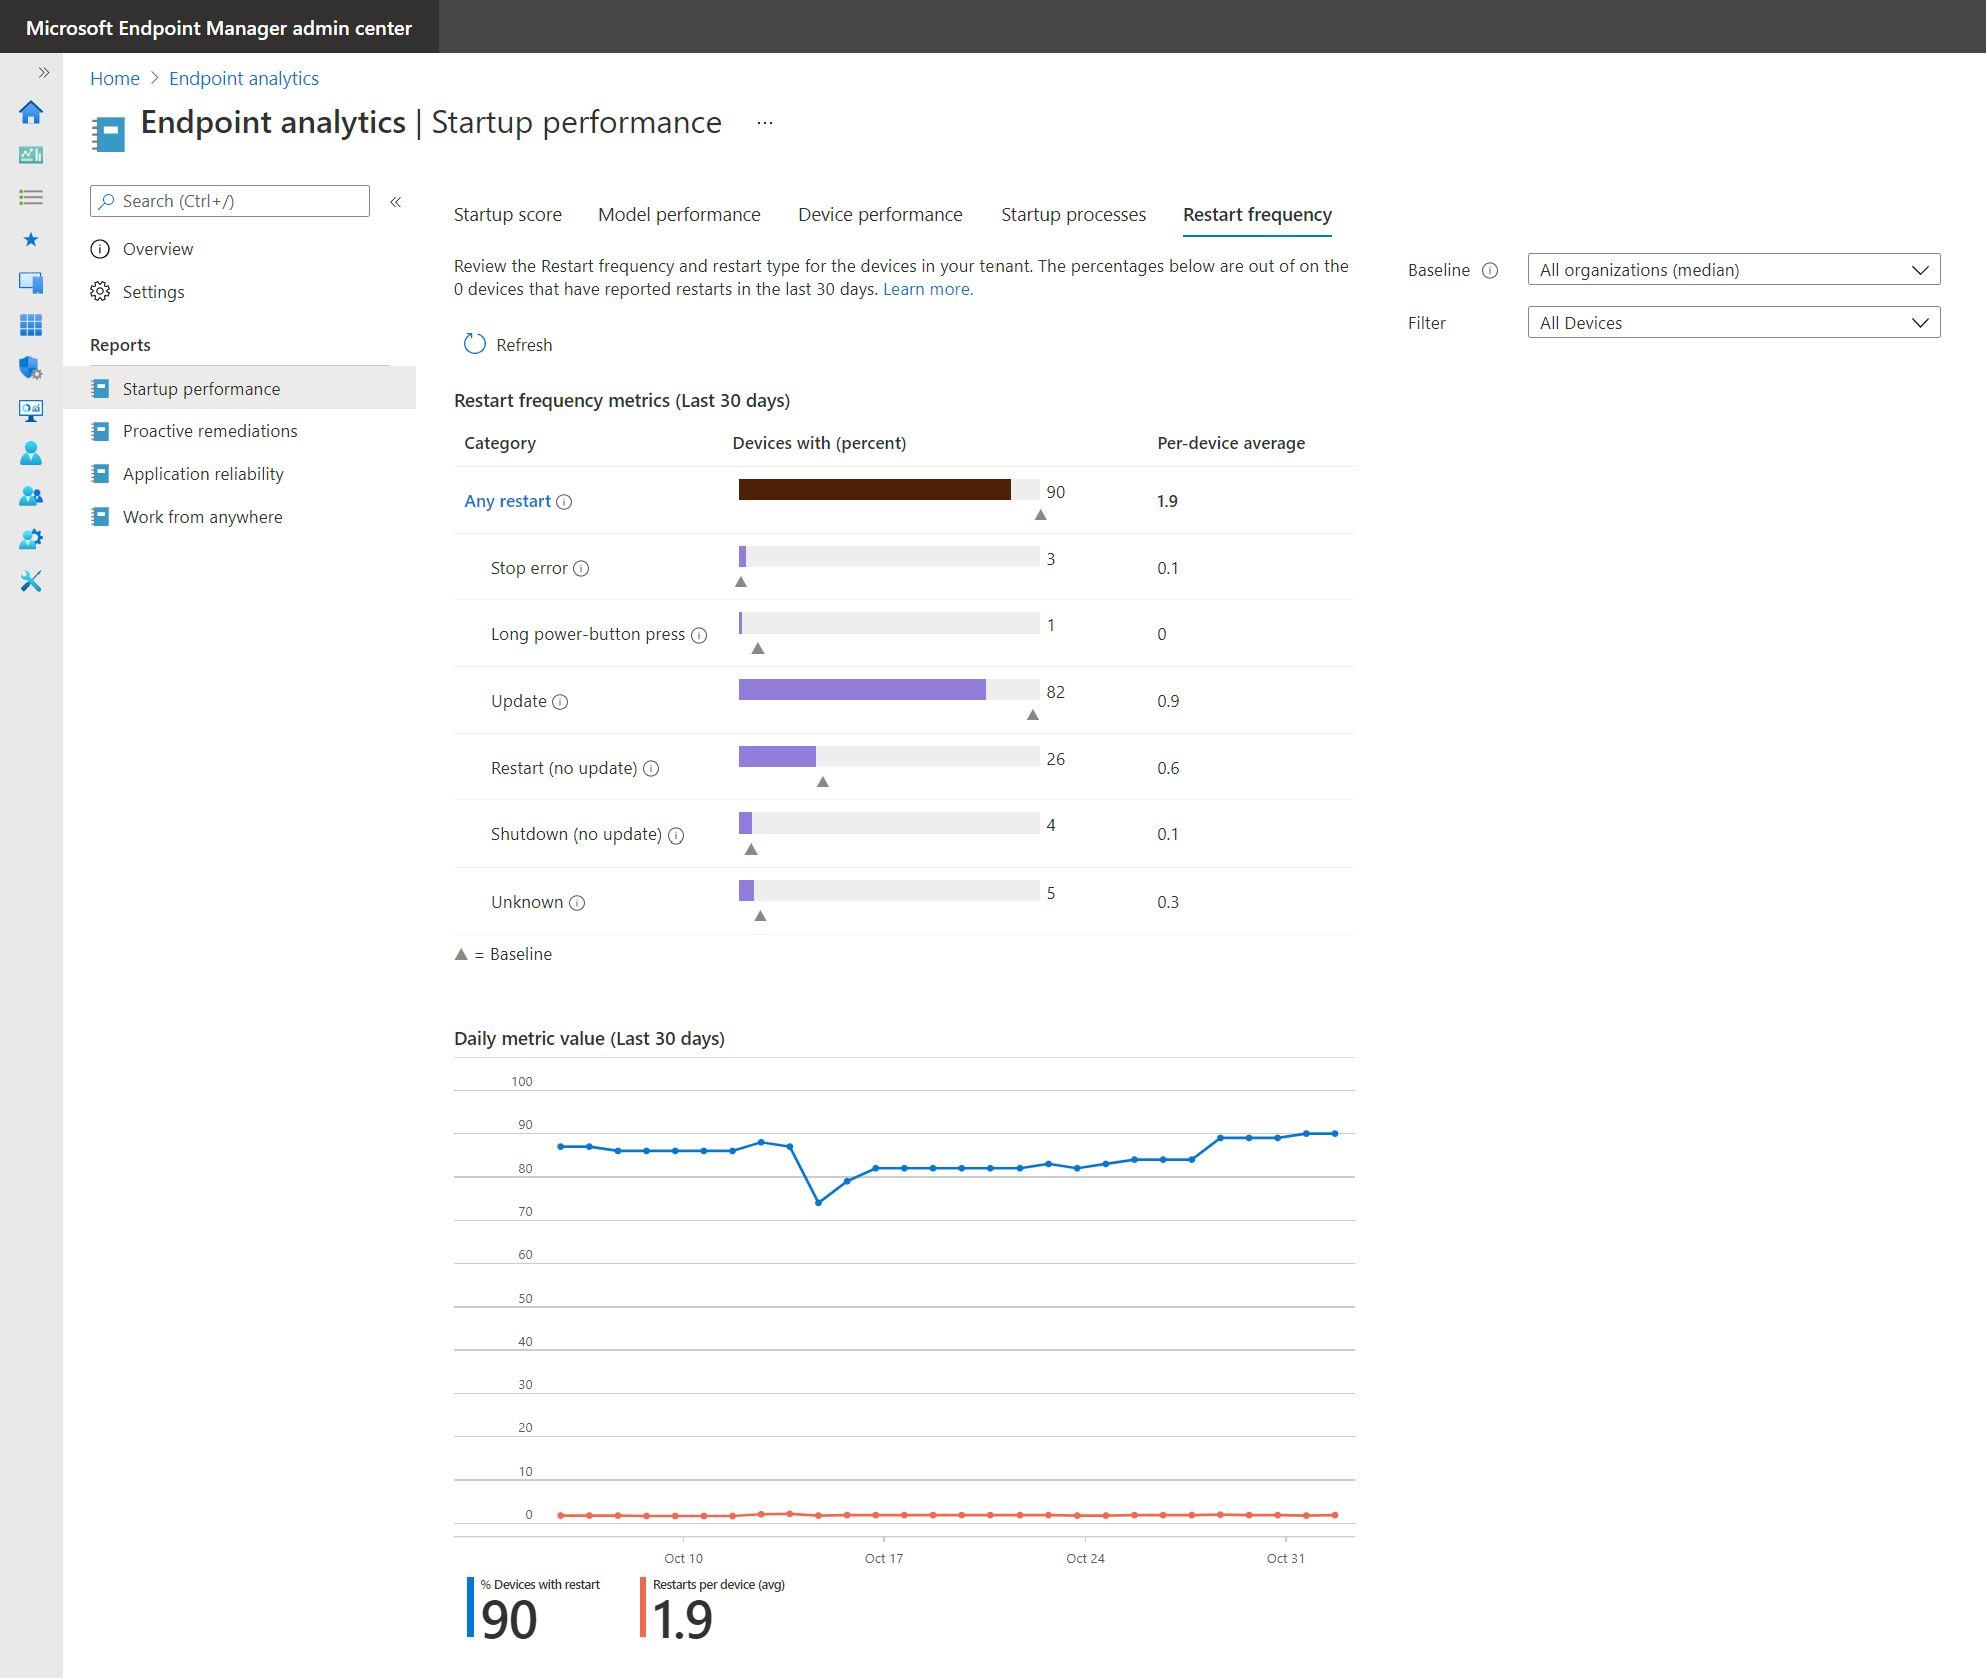
The new restart frequency tab shows aggregates of restart frequency counts for each of the restart categories over the last 30 days. For each restart category, the following information is displayed:
- Number of devices that have had at least one restart in that category
- The average number of restarts per device across all devices, to understand the total impact.
- This average is all devices, not just the ones that had at least one restart in the category.
The trend chart indicates how the rolling 30-day average changes over time. If there's a regression, you can see it and identify when it started. Click through the metrics table to go to the Device performance tab, which is sorted by the number of restarts, so you can quickly identify the devices with the most restarts.
Devices page
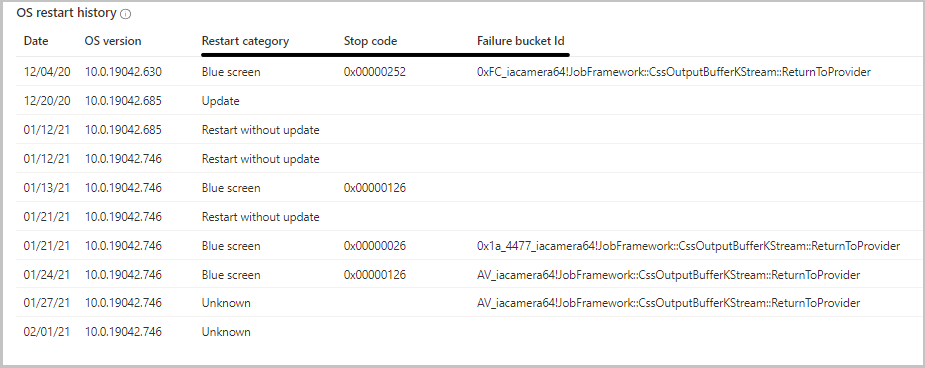
Select a particular device in the Device performance tab,to go to the device's Startup performance tab. The table called OS version history is renamed to OS restart history.
The OS restart history table has the following information:
- The Restart category for each reboot
- For Stop errors (blue screen errors), the following additional information is available:
- The stop code also called the bug check code
- A Failure bucket ID that can be used for diagnostics when working with Microsoft support
The OS restart history table is truncated to the 10 most recent restarts that occurred in the last 30 days. The table is low latency, so new restarts typically show up here before they appear in the daily aggregates shown in the Device performance tab.
Known issues
The count of restarts in a device's restart history in the Devices page might not match the count shown in the Device performance tab. This difference is by design. The differences are:
- The aggregates in the Device performance tab are computed daily to show counts for the last 30 days
- The restart history in the Devices page is truncated to the 10 most recent restarts
Currently, there isn't an aggregation of Stop errors (blue screen errors) by driver or failure bucket ID.

