plotly_anomaly_fl()
적용 대상: ✅Microsoft Fabric✅Azure Data Explorer✅Azure Monitor✅Microsoft Sentinel
이 함수 plotly_anomaly_fl() 는 대화형 변칙 차트를 만들기 위해 플롯 템플릿을 사용자 지정할 수 있는 UDF(사용자 정의 함수)입니다.
이 함수는 원본 및 기준 시계열, 해당 크기의 양수 및 음수 변칙 목록 및 차트 레이블 문자열이 포함된 테이블을 허용합니다. 함수는 플롯 JSON을 포함하는 단일 셀 테이블을 반환합니다. 필요에 따라 Azure Data Explorer 대시보드 타일에서 데이터를 렌더링할 수 있습니다. 자세한 내용은 Plotly(미리 보기)를 참조하세요.
이 함수는 원본 및 기준 시계열, 해당 크기의 양수 및 음수 변칙 목록 및 차트 레이블 문자열이 포함된 테이블을 허용합니다. 함수는 플롯 JSON을 포함하는 단일 셀 테이블을 반환합니다. 필요에 따라 실시간 대시보드 타일에서 데이터를 렌더링할 수 있습니다. 자세한 내용은 Plotly(미리 보기)를 참조하세요.
참고 항목
비대화형 변칙 차트를 렌더링하기 위해 Azure Data Explorer 네이티브 " | render anomalychart" 메서드를 사용하는 것이 좋습니다.
전제 조건
공개적으로 사용 가능한 PlotlyTemplate 테이블에서 필요한 'anomaly' 템플릿을 추출합니다. 대상 데이터베이스에서 다음 KQL 명령을 실행하여 샘플 데이터베이스에서 데이터베이스로 이 테이블을 복사합니다.
.set PlotlyTemplate <| cluster('help.kusto.windows.net').database('Samples').PlotlyTemplate
구문
T | invoke plotly_anomaly_fl(, time_col val_col, baseline_col time_high_col,, val_high_col size_high_col ,val_low__col, time_low_col size_low_col , chart_title, series_name val_name, , , )
구문 규칙에 대해 자세히 알아봅니다.
매개 변수
| 이름 | Type | 필수 | 설명 |
|---|---|---|---|
| time_col | string |
✔️ | 원래 시계열의 시간 지점의 동적 배열을 포함하는 열의 이름입니다. |
| val_col | string |
✔️ | 원래 시계열의 값을 포함하는 열의 이름입니다. |
| baseline_col | string |
✔️ | 기준 시계열의 값을 포함하는 열의 이름입니다. 일반적으로 예상 기준 값에서 큰 값 오프셋으로 변칙이 검색됩니다. |
| time_high_col | string |
✔️ | 높은 시간(기준선 위) 변칙이 포함된 열의 이름입니다. |
| val_high_col | string |
✔️ | 높은 변칙 값을 포함하는 열의 이름입니다. |
| size_high_col | string |
✔️ | 높은 변칙의 표식 크기를 포함하는 열의 이름입니다. |
| time_low_col | string |
✔️ | 낮은 변칙의 시간 지점을 포함하는 열의 이름입니다. |
| val_low_col | string |
✔️ | 낮은 변칙 값을 포함하는 열의 이름입니다. |
| size_low_col | string |
✔️ | 낮은 변칙의 표식 크기를 포함하는 열의 이름입니다. |
| chart_title | string |
차트 제목, 기본값은 '변칙 차트' | |
| series_name | string |
시계열 이름, 기본값은 '메트릭'입니다. | |
| val_name | string |
값 축 이름, 기본값은 'Value' |
함수 정의
다음과 같이 해당 코드를 쿼리 정의 함수로 포함하거나 데이터베이스에 저장된 함수로 만들어 함수를 정의할 수 있습니다.
다음 let 문을 사용하여 함수를 정의합니다. 사용 권한이 필요 없습니다.
Important
let 문은 자체적으로 실행할 수 없습니다. 그 뒤에 테이블 형식 식 문이 있어야 합니다. 작업 예제 plotly_anomaly_fl()를 실행하려면 예제를 참조 하세요.
let plotly_anomaly_fl=(tbl:(*), time_col:string, val_col:string, baseline_col:string, time_high_col:string , val_high_col:string, size_high_col:string,
                                time_low_col:string, val_low_col:string, size_low_col:string,
                                chart_title:string='Anomaly chart', series_name:string='Metric', val_name:string='Value')
{
    let anomaly_chart = toscalar(PlotlyTemplate | where name == "anomaly" | project plotly);
    let tbl_ex = tbl | extend _timestamp = column_ifexists(time_col, datetime(null)), _values = column_ifexists(val_col, 0.0), _baseline = column_ifexists(baseline_col, 0.0),
                              _high_timestamp = column_ifexists(time_high_col, datetime(null)), _high_values = column_ifexists(val_high_col, 0.0), _high_size = column_ifexists(size_high_col, 1),
                              _low_timestamp = column_ifexists(time_low_col, datetime(null)), _low_values = column_ifexists(val_low_col, 0.0), _low_size = column_ifexists(size_low_col, 1);
    tbl_ex
    | extend plotly = anomaly_chart
    | extend plotly=replace_string(plotly, '$TIME_STAMPS$', tostring(_timestamp))
    | extend plotly=replace_string(plotly, '$SERIES_VALS$', tostring(_values))
    | extend plotly=replace_string(plotly, '$BASELINE_VALS$', tostring(_baseline))
    | extend plotly=replace_string(plotly, '$TIME_STAMPS_HIGH_ANOMALIES$', tostring(_high_timestamp))
    | extend plotly=replace_string(plotly, '$HIGH_ANOMALIES_VALS$', tostring(_high_values))
    | extend plotly=replace_string(plotly, '$HIGH_ANOMALIES_MARKER_SIZE$', tostring(_high_size))
    | extend plotly=replace_string(plotly, '$TIME_STAMPS_LOW_ANOMALIES$', tostring(_low_timestamp))
    | extend plotly=replace_string(plotly, '$LOW_ANOMALIES_VALS$', tostring(_low_values))
    | extend plotly=replace_string(plotly, '$LOW_ANOMALIES_MARKER_SIZE$', tostring(_low_size))
    | extend plotly=replace_string(plotly, '$TITLE$', chart_title)
    | extend plotly=replace_string(plotly, '$SERIES_NAME$', series_name)
    | extend plotly=replace_string(plotly, '$Y_NAME$', val_name)
    | project plotly
};
// Write your query to use the function here.
예시
다음 예제에서는 호출 연산자를 사용하여 함수를 실행합니다.
쿼리 정의 함수를 사용하려면 포함된 함수 정의 후에 호출합니다.
let plotly_anomaly_fl=(tbl:(*), time_col:string, val_col:string, baseline_col:string, time_high_col:string , val_high_col:string, size_high_col:string,
                                time_low_col:string, val_low_col:string, size_low_col:string,
                                chart_title:string='Anomaly chart', series_name:string='Metric', val_name:string='Value')
{
    let anomaly_chart = toscalar(PlotlyTemplate | where name == "anomaly" | project plotly);
    let tbl_ex = tbl | extend _timestamp = column_ifexists(time_col, datetime(null)), _values = column_ifexists(val_col, 0.0), _baseline = column_ifexists(baseline_col, 0.0),
                              _high_timestamp = column_ifexists(time_high_col, datetime(null)), _high_values = column_ifexists(val_high_col, 0.0), _high_size = column_ifexists(size_high_col, 1),
                              _low_timestamp = column_ifexists(time_low_col, datetime(null)), _low_values = column_ifexists(val_low_col, 0.0), _low_size = column_ifexists(size_low_col, 1);
    tbl_ex
    | extend plotly = anomaly_chart
    | extend plotly=replace_string(plotly, '$TIME_STAMPS$', tostring(_timestamp))
    | extend plotly=replace_string(plotly, '$SERIES_VALS$', tostring(_values))
    | extend plotly=replace_string(plotly, '$BASELINE_VALS$', tostring(_baseline))
    | extend plotly=replace_string(plotly, '$TIME_STAMPS_HIGH_ANOMALIES$', tostring(_high_timestamp))
    | extend plotly=replace_string(plotly, '$HIGH_ANOMALIES_VALS$', tostring(_high_values))
    | extend plotly=replace_string(plotly, '$HIGH_ANOMALIES_MARKER_SIZE$', tostring(_high_size))
    | extend plotly=replace_string(plotly, '$TIME_STAMPS_LOW_ANOMALIES$', tostring(_low_timestamp))
    | extend plotly=replace_string(plotly, '$LOW_ANOMALIES_VALS$', tostring(_low_values))
    | extend plotly=replace_string(plotly, '$LOW_ANOMALIES_MARKER_SIZE$', tostring(_low_size))
    | extend plotly=replace_string(plotly, '$TITLE$', chart_title)
    | extend plotly=replace_string(plotly, '$SERIES_NAME$', series_name)
    | extend plotly=replace_string(plotly, '$Y_NAME$', val_name)
    | project plotly
};
let min_t = datetime(2017-01-05);
let max_t = datetime(2017-02-03 22:00);
let dt = 2h;
let marker_scale = 8;
let s_name = 'TS1';
demo_make_series2
| make-series num=avg(num) on TimeStamp from min_t to max_t step dt by sid
| where sid == s_name
| extend (anomalies, score, baseline) = series_decompose_anomalies(num, 1.5, -1, 'linefit')
| mv-apply num1=num to typeof(double), anomalies1=anomalies to typeof(double), score1=score to typeof(double), TimeStamp1=TimeStamp to typeof(datetime)  on (
    summarize pAnomalies=make_list_if(num1, anomalies1 > 0), pTimeStamp=make_list_if(TimeStamp1, anomalies1 > 0), pSize=make_list_if(toint(score1*marker_scale), anomalies1 > 0),
              nAnomalies=make_list_if(num1, anomalies1 < 0), nTimeStamp=make_list_if(TimeStamp1, anomalies1 < 0), nSize=make_list_if(toint(-score1*marker_scale), anomalies1 < 0)
)
| invoke plotly_anomaly_fl('TimeStamp', 'num', 'baseline', 'pTimeStamp', 'pAnomalies', 'pSize', 'nTimeStamp', 'nAnomalies', 'nSize',
                           chart_title='Anomaly chart using plotly_anomaly_fl()', series_name=s_name, val_name='# of requests')
| render plotly
출력
출력은 '|을(를) 사용하여 렌더링할 수 있는 Plotly JSON 문자열입니다. render plotly' 또는 Azure Data Explorer 대시보드 타일에 있습니다. 대시보드 타일을 만드는 방법에 대한 자세한 내용은 Azure Data Explorer 대시보드를 사용하여 데이터 시각화를 참조 하세요 .
출력은 실시간 대시보드 타일에서 렌더링할 수 있는 Plotly JSON 문자열입니다. 대시보드 타일을 만드는 방법에 대한 자세한 내용은 실시간 대시보드를 참조 하세요.
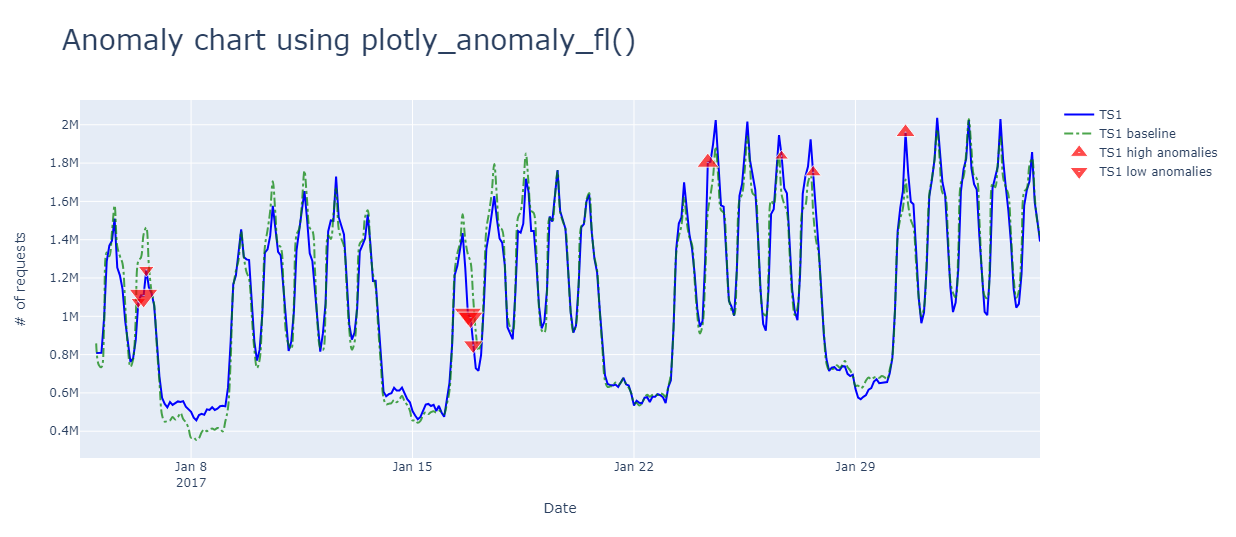
다음 이미지는 위의 함수를 사용하는 샘플 변칙 차트를 보여줍니다.

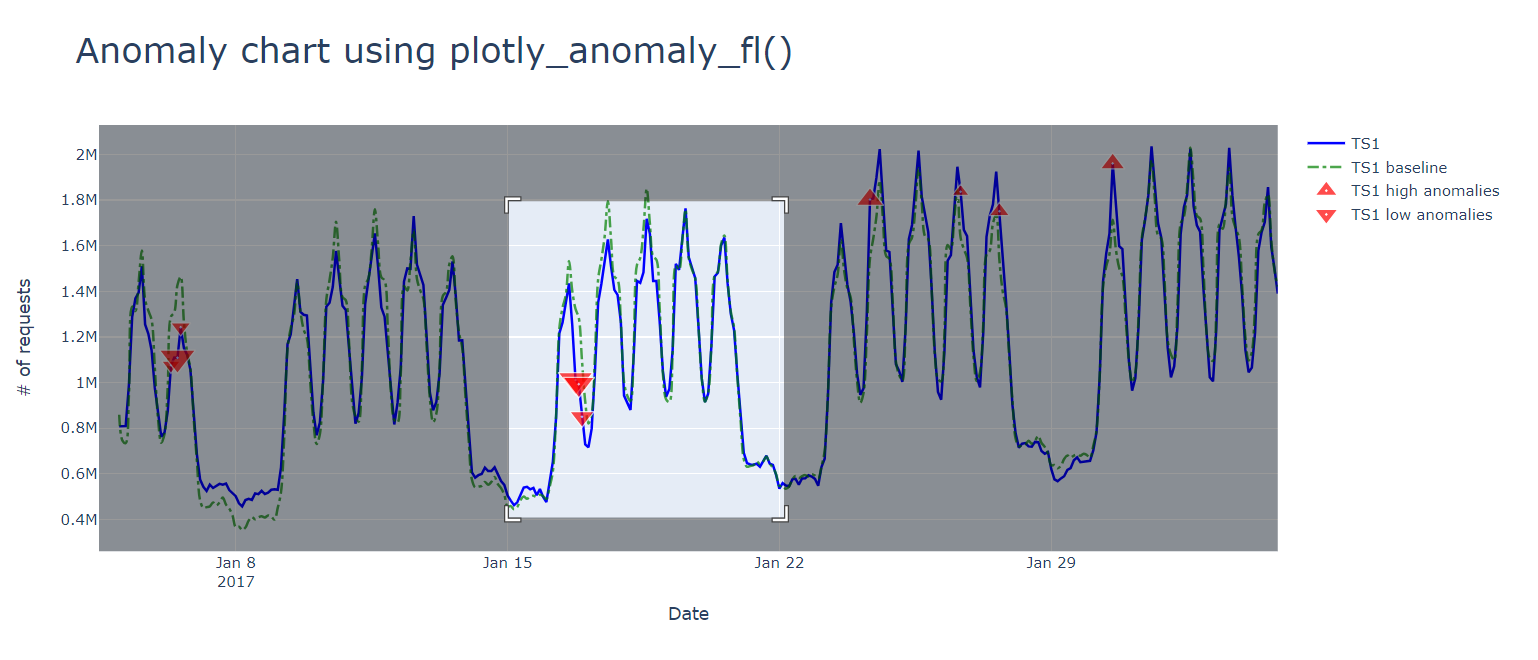
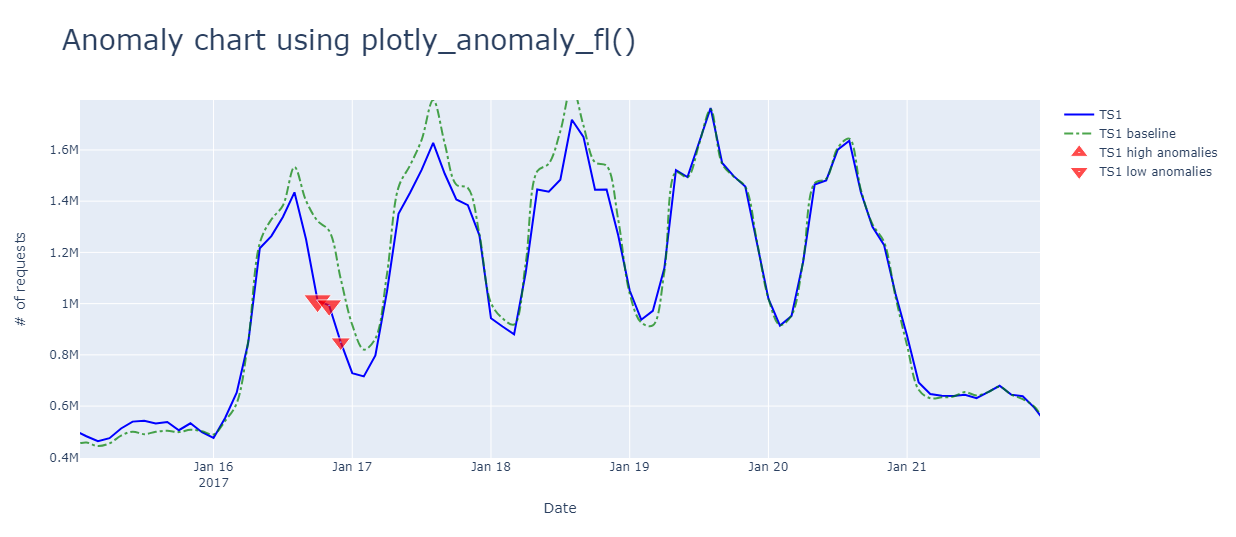
변칙을 확대하고 마우스로 가리킬 수 있습니다.

