Analytics, business intelligence, and reporting overview
Small and mid-sized companies rely on built-in analytics and reporting capabilities they can use out-of-the-box to help keep track of their business. Business Central provides reports and analytics tools that cover basic and complex business processes.
Analytics needs in organizations
When you think about analytics in your organization, it might help to use a persona-based model to outline different needs.
The model is based on the fact that different roles in an organization have different needs when it comes to data. The higher a role is placed in the organizational chart, the more aggregated data someone in the role needs to do their work.
Roles often have preferred ways to consume and analyze data, ways that reflect the level of data aggregation they need.
Use the following sections to learn more about ways to consume data from Business Central:
- Financial Reports
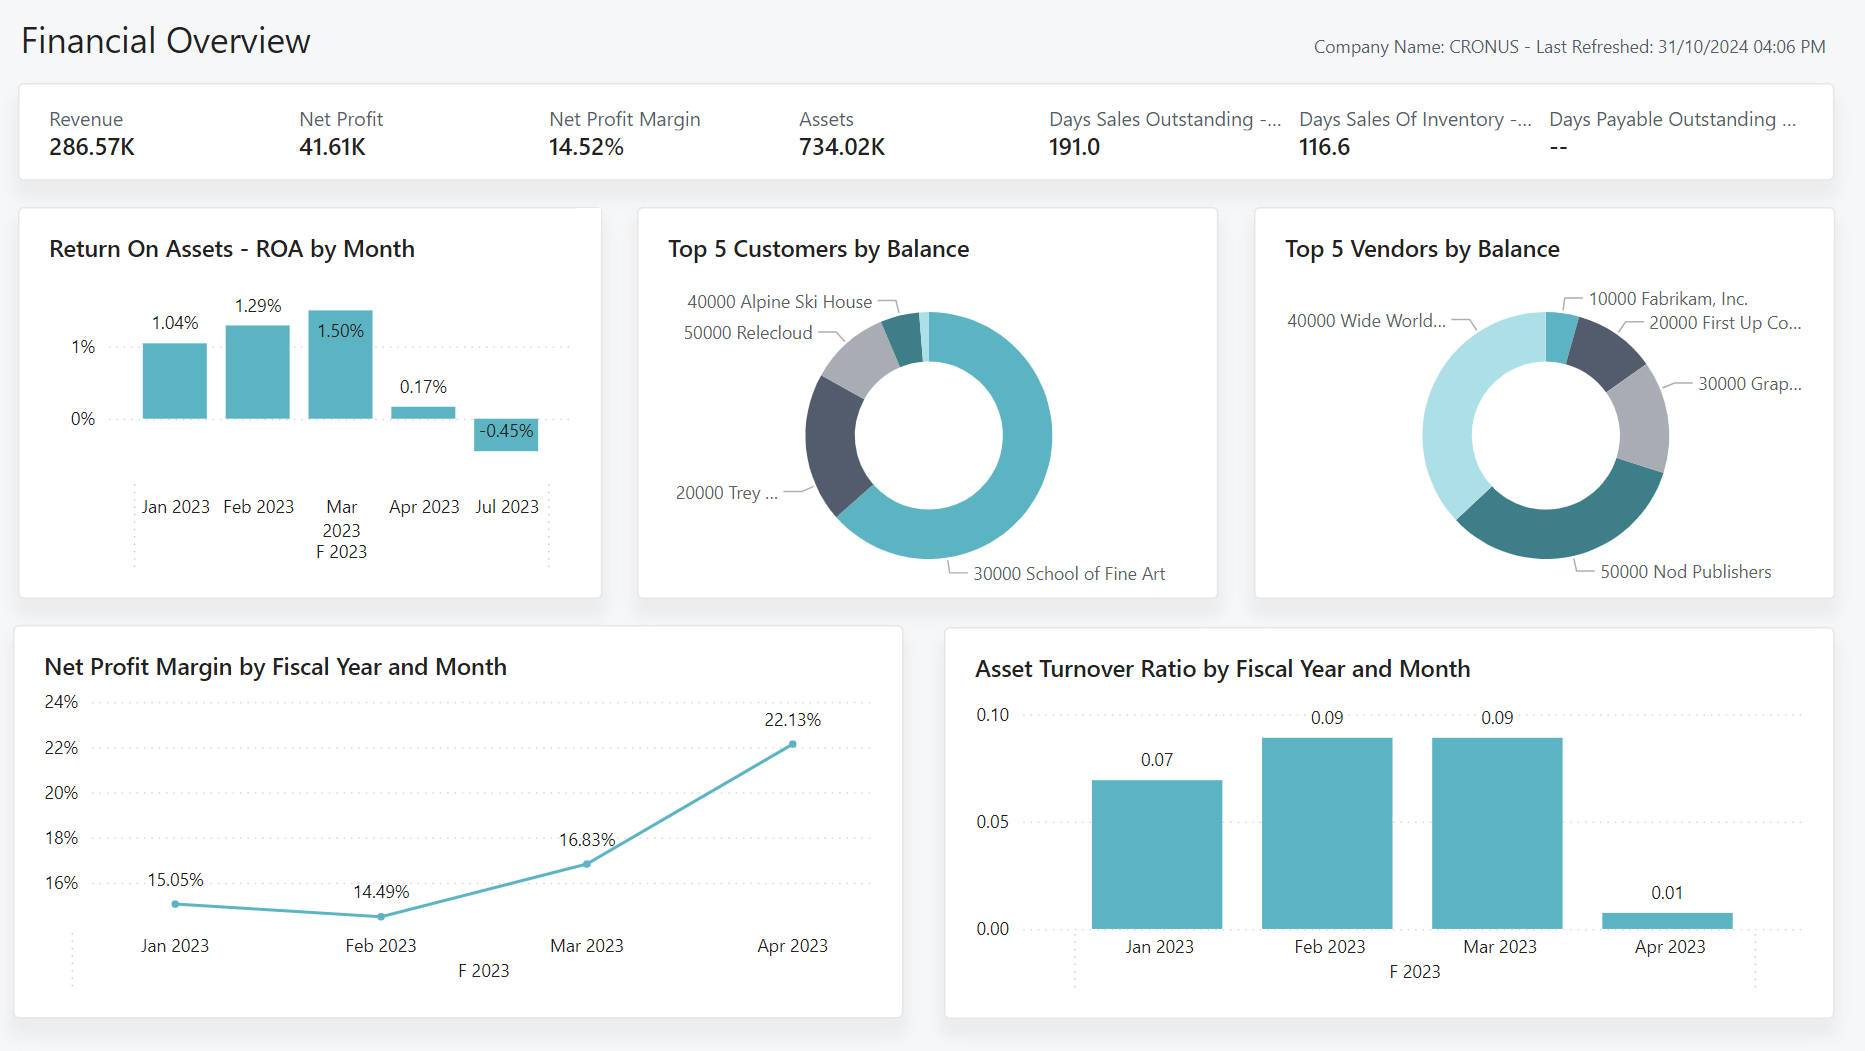
- KPIs and dashboards
- Power BI apps
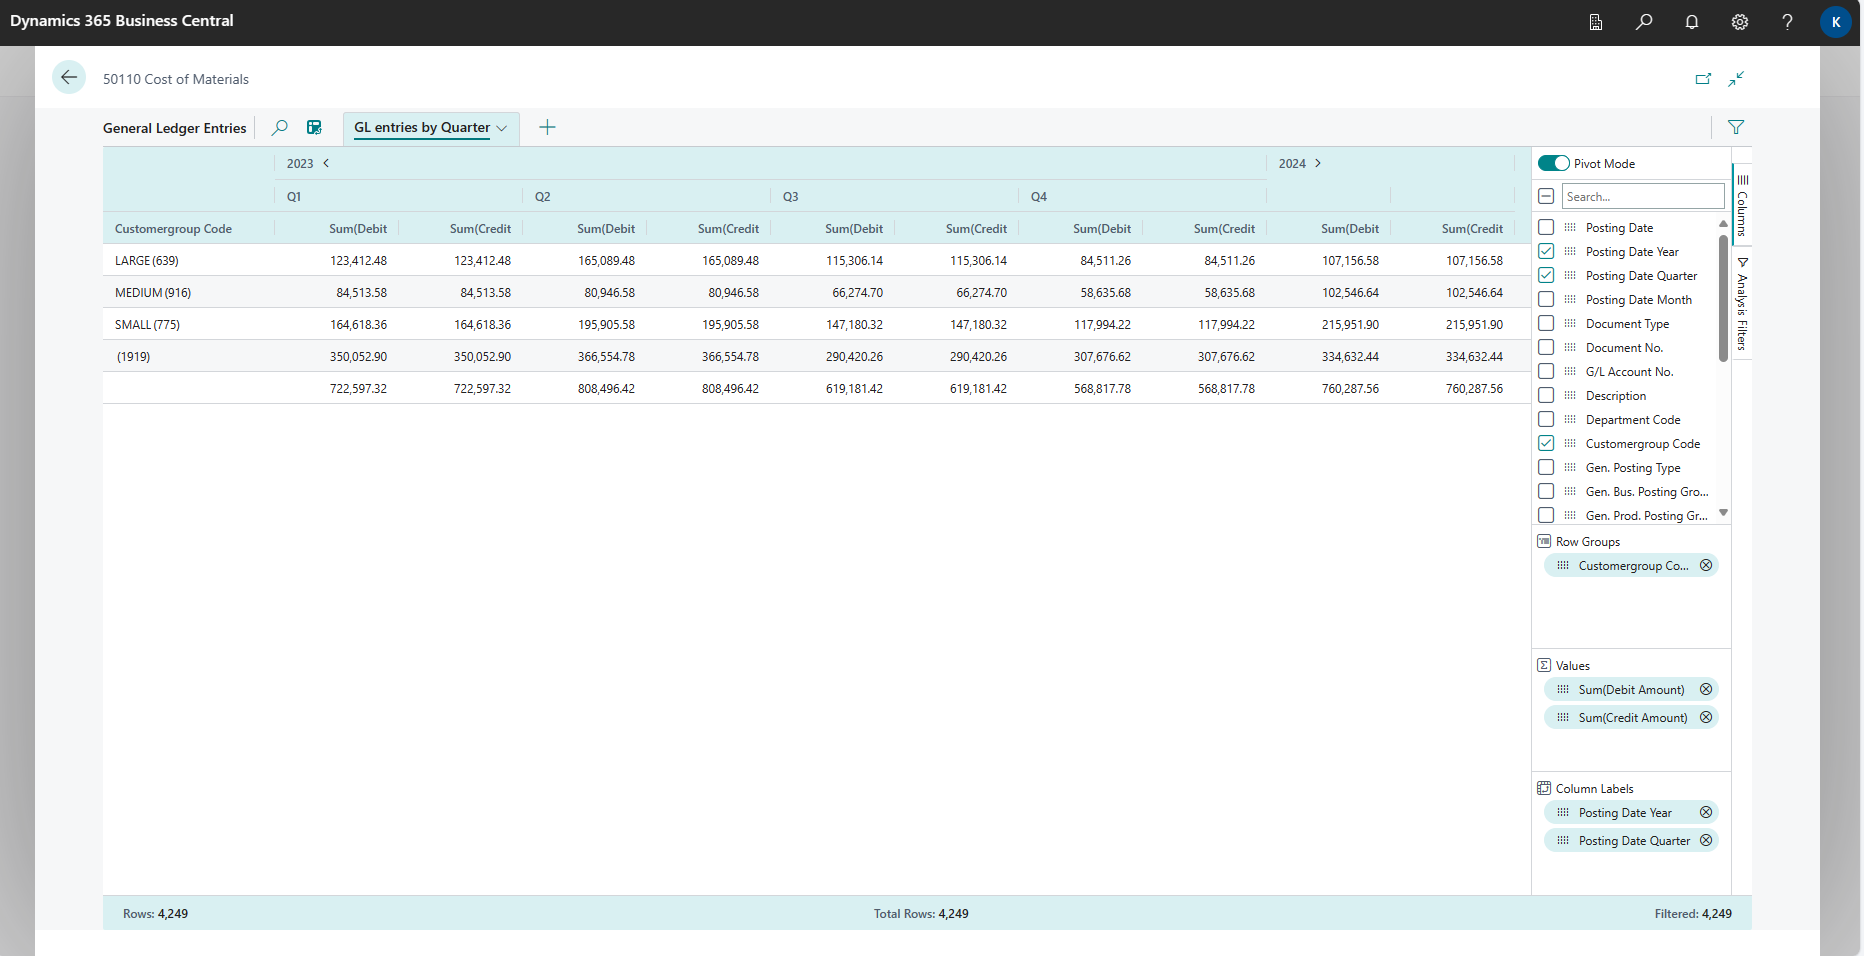
- Ad-hoc analysis
- Reports
Using Financial Reports to produce financial statements and KPIs
The Financial Reports feature gives you insight into the financial data stored in your chart of accounts (COA). You can set up financial reports to analyze figures in general ledger (G/L) accounts, and compare general ledger entries with budget entries.
Dimensions play an important role in business intelligence. A dimension is data that you can add to an entry as a parameter. Dimensions let you group entries that have similar characteristics. For example, groups of customers, regions, products, and salesperson. Groups make it easier to retrieve data for analysis. Among other purposes, you use dimensions when you define analysis views and create financial reports. Learn more at Work with Dimensions.
To learn more about financial statements and KPIs, go to Using Financial reporting to produce financial statements and KPIs.
Using key performance indicators to meet your business goals
A key performance indicator (KPI) is a measurable value that shows how effectively you’re meeting your goals. Think of KPIs as your company’s scorecard, a way to measure whether you’re delivering on your objectives.
Identifying and tracking KPIs lets you know whether your business is on the right path, or whether you should change course. When used properly, KPIs are powerful tools that help you:
- Monitor company financial health.
- Measure progress against strategic goals.
- Spot problems early on.
- Make timely adjustments to tactics.
- Motivate team members.
- Make better decisions, faster.
To learn more about KPIs, go to Using key performance indicators to meet your business goals
Built-in Power BI apps
Power BI apps are available for the following functional areas in Business Central:
- Finance (14 reports)
- Sales (11 reports)
- Purchasing (12 reports)
- Inventory (11 reports)
- Inventory Valuation (3 reports)
- Projects (7 reports)
- Manufacturing (11 reports)
To learn more, go to Power BI apps/reports by functional area
Ad-hoc data analysis
You might just want to check whether the numbers add up correctly, quickly confirm or debunk a hypothesis about the business, or maybe look for anomalies in your financial data. For ad-hoc analyses, you might not have a built-in report that helps answer your questions. For ad-hoc analyses, use these two features:
- Data analysis on ledger list pages
- Open in Excel
The Data analysis feature lets you open almost any list page, such as the General Ledger Entries or Customer Ledger Entries pages, enter analysis mode, and then group, filter, and pivot data as you see fit.
Similarly, you can use the Open in Excel action to open a list page, optionally filter the list to a subset of the data, and then use Excel to work with the data. For example, by using features such as Analyze Data, What-If Analysis, or Forecast Sheet.
Tip
If you configure OneDrive for system features, the Excel workbook opens in your browser in Excel online.
To learn more about ad-how analyses, go to Ad hoc data analysis.
Reports
A report in Business Central gathers information based on a specified set of criteria. Reports organize and present the information in an easy-to-read format you can use in Excel, print, or save as a file.
As an example of an interactive report in Excel, the Aged Accounts Receivable report lets you analyze what your customers owe you and when payments are due.
For aged accounts receivables, Business Central also includes a report designed for print. The ability to print is handy if you prefer to have the data in a .pdf file.
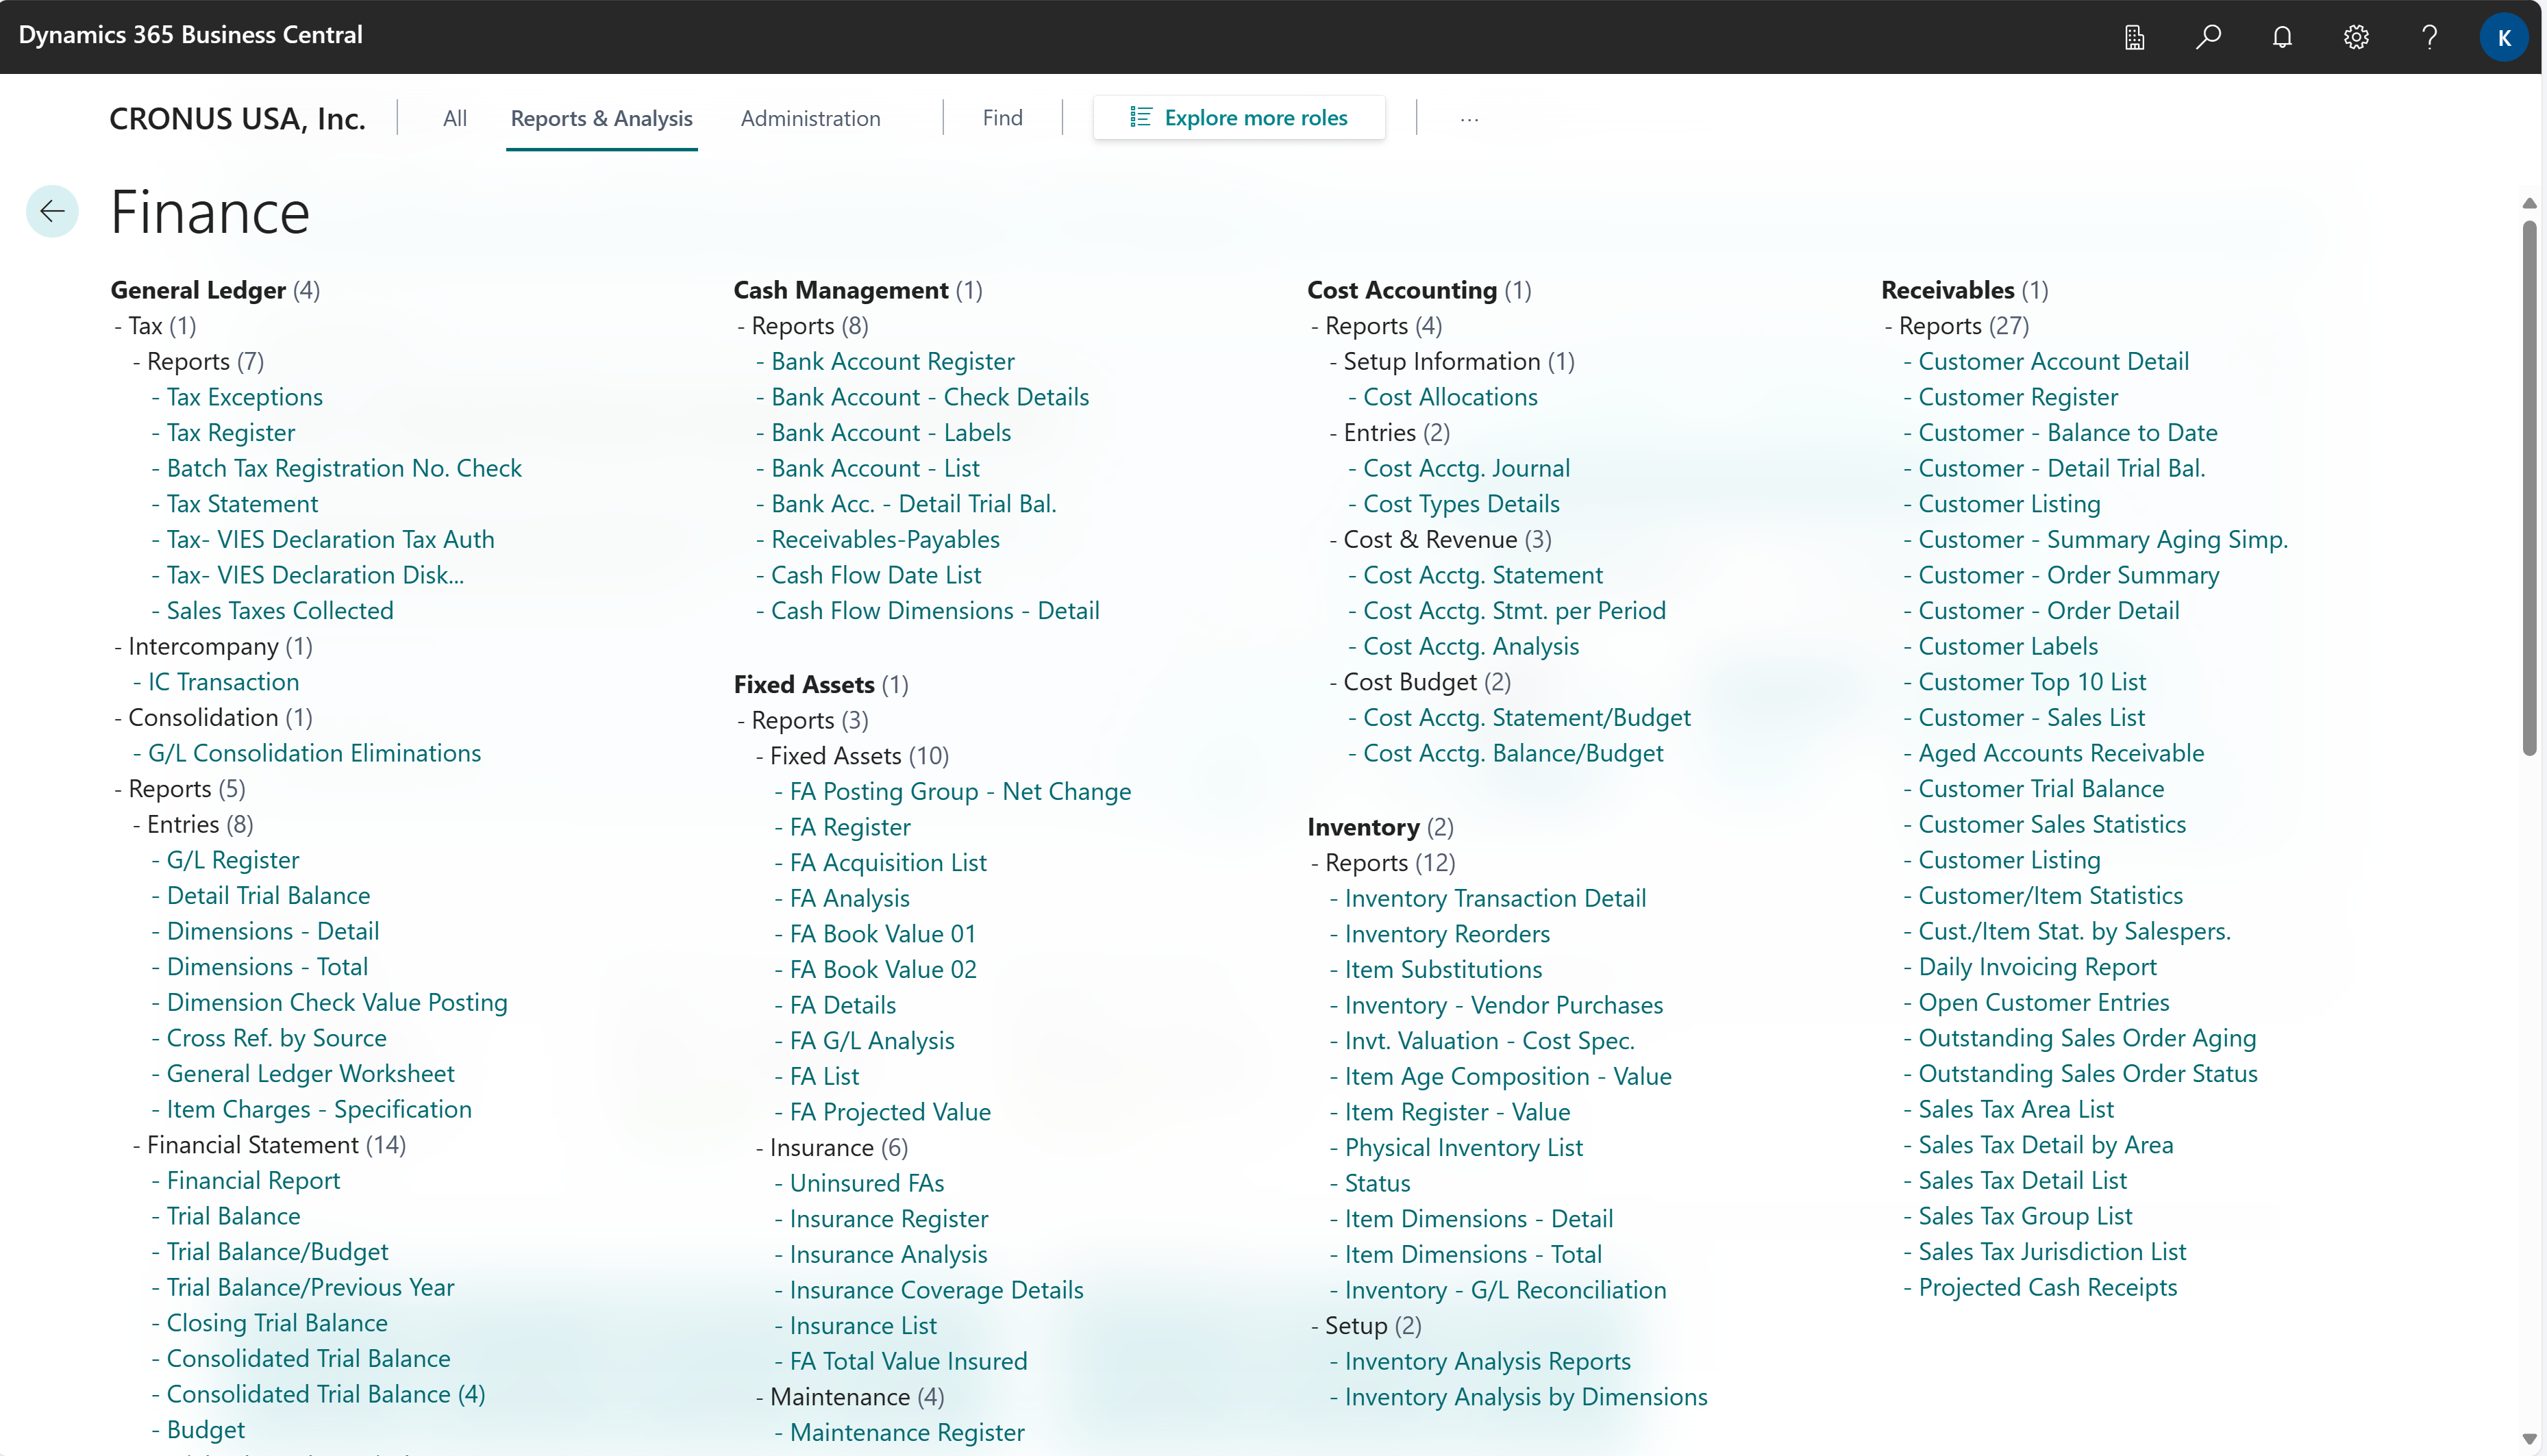
Business Central comes with more than 300 built-in reports that you can use to support your business processes with data-driven insights. To get a quick overview of all the reports that are available for your role, you can open the report explorer from the role center and all list pages and from Tell Me.
To learn more about using the report explorer to see all built-in reports, go to Exploring reports per Role.
The following table lists articles about how to use built-in reports in Business Central.
| To | See |
|---|---|
| Learn how to use reports (bookmark, run, print, schedule, and change the layout). | Use Reports in Daily Work |
| Learn about which built-in reports are available in Business Central. | Report Overview |
| Use the Report Explorer to see all built-in reports. | Exploring reports per Role |
External business intelligence and reporting tools
If you prefer, you can use business intelligence tools that aren't embedded in Business Central. The following table provides links to guidance and ways to use external tools.
| To | See |
|---|---|
| Use Power BI with Business Central data | Using Power BI with Business Central |
| Integrate external business intelligence tools with Business Central. | External Business Intelligence Tools |
| Extract data to data warehouses or data lakes | How to extract data to data warehouses or data lakes |
| Analyze Business Central data with Microsoft Fabric | Introduction to Microsoft Fabric and Business Central |
| Read data from Business Central using APIs | Business Central API v2.0 |
Analytics by functional area
The content in this general article is also available in special versions for many functional areas in Business Central.
| If you work with... | See |
|---|---|
| Finance | Financial analytics Accounts receivable analytics overview Accounts payable analytics overview |
| Sales | Sales analytics |
| Purchasing | Purchasing analytics |
| Inventory | Inventory analytics overview |
| Fixed Assets Management | Fixed assets analytics |
| Projects | Project management analytics |
| Manufacturing | Manufacturing analytics |
See also
Using Financial reporting to produce financial statements and KPIs
Using key performance indicators (KPIs) to meet your business goals
Power BI apps/reports by functional area
Doing ad-hoc data analysis
Use reports in your daily work
Overview of built-in reports
Exploring reports per Role
Analytics by functional area


