Historical Utilization (Power BI Report)
APPLIES TO: Generally available in Business Central 2024 release wave 2 (version 25.1).
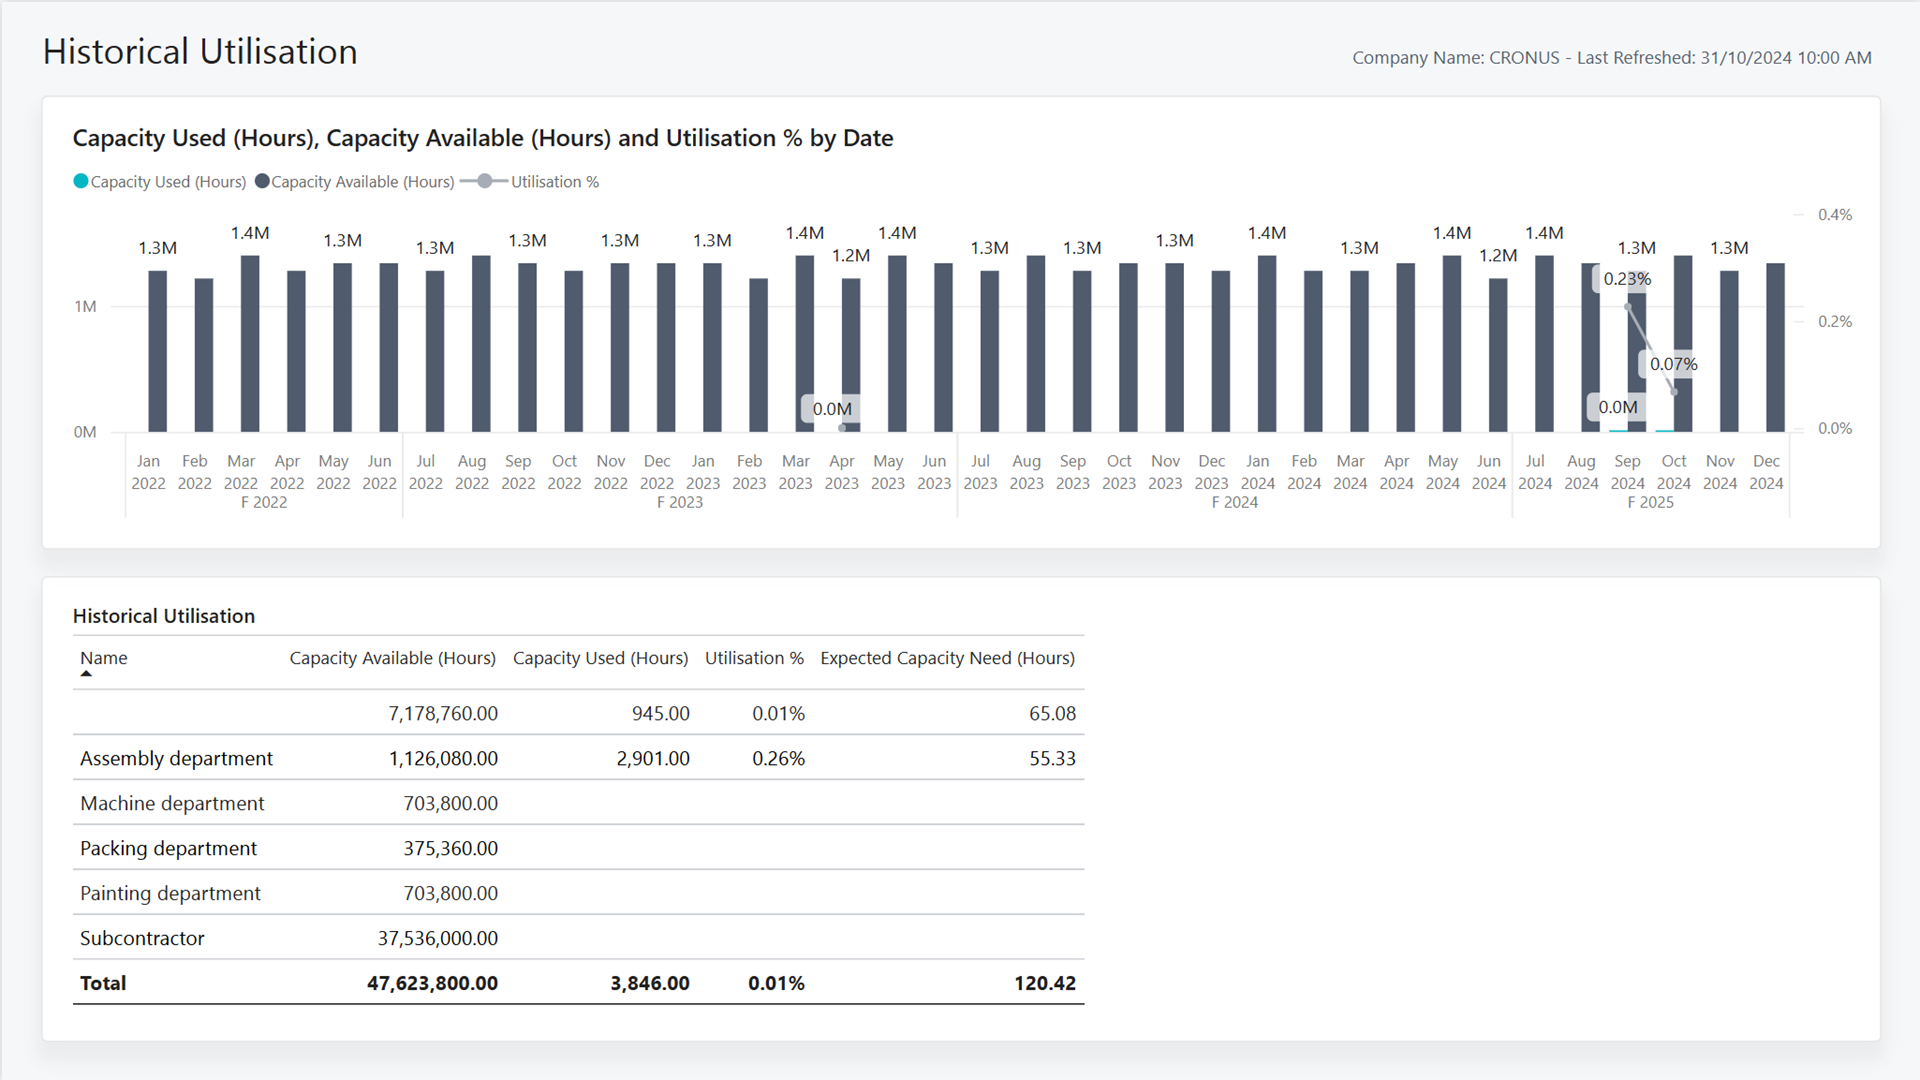
The Historical Utilization report provides insights into the historic use of manufacturing resources and machinery over time. It helps identify downtimes, busy periods, and bottlenecks so you can improve capacity planning and optimize the use of machinery and resources.
Use the report
The report is meant for business leaders and manufacturing teams.
COOs use the report to measure the return on resources and machinery over time, and get insights into how well your manufacturing team used them. You can track the historical utilization rate to identify bottlenecks and make necessary adjustments to ensure you use resources efficiently.
Manufacturing managers use this report to identify the historical utilization rate of machinery and resources. The report provides insights into the capacity used and available over time. This data identifies downtimes, busy periods, and bottlenecks. Use this information to improve capacity planning and optimize the use of machinery and resources. A low utilization rate means you have idle resources, which is good for efficiency. Conversely, if the utilization rate is high, it means your production output increased, and you might consider investing in new machines for production.
Key Performance Indicators (KPIs)
The Historical Utilization report includes the following KPIs and measures:
Click on the link for a KPI to learn more about what it means, how it is calculated, and what data was used in the calculations.
Tip
You can easily track the KPIs that the Power BI reports display against your business objectives. To learn more, go to Track your business KPIs with Power BI metrics.
Data used in the report
The report uses data from the following tables in Business Central:
- Capacity Ledger Entry
- Calendar Entry
- Production Order Routing Line
Try the report
Try the report here: Historical Utilization
Tip
If you hold down the CTRL key while you select the report link, the report opens on a new browser tab. In this way, you can stay on the current page while you explore the report on the other browser tab.
See also
Track your business KPIs with Power BI metrics
Power BI Manufacturing app
Built-in production reports
Manufacturing overview
