Review data quality score of your data assets
After you create data quality rules and run a data quality scan, your data assets receive a data quality score based on results from your rules. This article covers how scores are calculated to give you a deeper understanding of your data quality results, and help you develop action items to improve your data's integrity.
Understand data quality scores
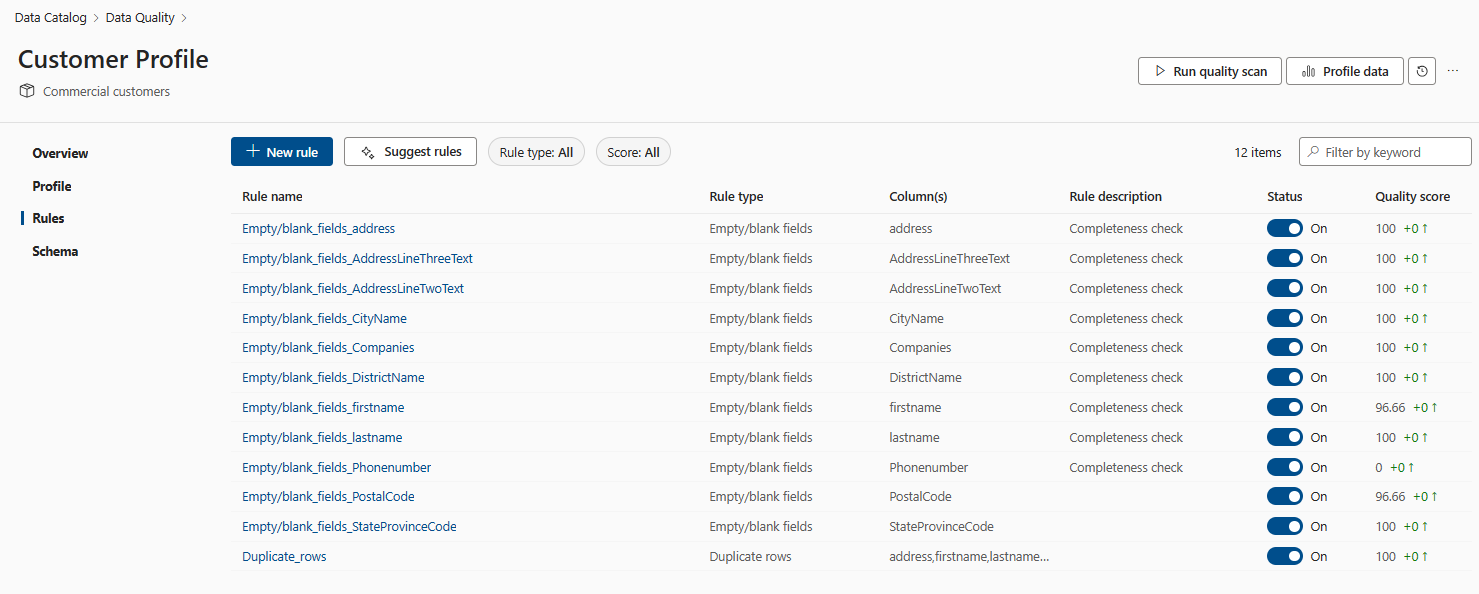
The goal of data quality rules is to provide a description of the state of the data. In particular, it shows how far away the data is from the ideal state described by the rules. Each rule, when it runs, produces a score that describes how close the data is to its desired state. Most rules are very straight forward; they divide the total number of rows that have passed the assessment by the total number of rows to arrive at the score.
The formula used to calculate the data quality score for a rule against data in a column is:
[(total number of passed records)/(passed records + failed records + miscast records + empty records + ignored records)]
- Numerator = number of passed records
- Denominator = total number of records (number of passed records + number of failed records + number of miscast records + number of empty + number of ignored records)
- Passed - number of records that passed an applied rule
- Unevaluable - the columns required to evaluate this rule aren't evaluable
- Failed - number of records that failed an applied rule
- Miscast - the data type of the asset and the type that customer listed it as not matching. It can't be converted to the expressed type.
- Empty - null or blank records
- Ignored - rows didn't participate in the rule evaluation. Customers can express rows to ignore. Like ignore all rows that have email = "n/a" or Ignore all rows where departmentCode = 'test' or 'internal'
Microsoft Purview Data Quality then gives a sense for the state of each column by generating a column score. This score is the average of the all the scores of the rules on that column.
Once the column scores are calculated, the formula used to calculate average percentage data quality score for data products and governance domains is:
[(Percentage 1 + Percentage 2) / (Sample size 1 + Sample size 2)] x 100
(The score is multiplied by 100 to make the scores more readable.)
Example calculation
Let's imagine there's a column that doesn't have the 'Empty/blank fields' rule defined on it. This implies that null values are allowed for this column. So certain rules, like the unique values rule, will filter out null values in that case.
For example:
If the asset has 10,000 rows in a table but 3,000 were null and 500 weren't unique then the score would be:
((10000 - 3000 - 500)/(10000 - 3000) )* 100 = 93
The null rows are ignored when evaluating the data and determining a score.
Specific rule scores
For custom rules there's a similar capability like you might see for the unique values rule, but in this case the filter isn't on nulls but rather the filter expression.
Some rules, like the freshness rule, are either pass or fail. So their scores will be either 0 or 100. And the freshness rule is applied in the data asset level, not in the columns level.
Rule details and history
You can view the details and history of rule scores by selecting a rule. Selecting a specific rule name and navigating to the rule history tab, you see the trend of the different scan runs for the particular rule.
Rule Details provides information on the number of rows passed, failed, and ignored for the various runs for the particular rule. Rules that are in draft state (OFF state) won't have their scores contribute to the global score. Rules in a draft state won't be run at all during quality scans and so won't have scores.
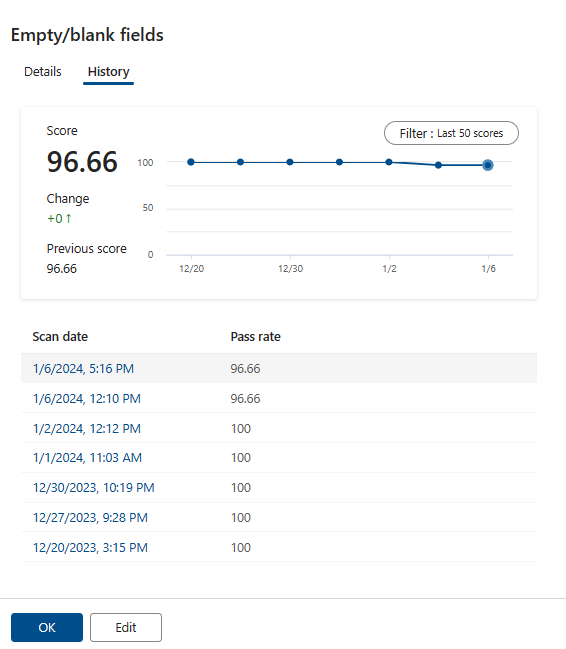
Columns and rules have a many-to-many relationship, the same rule can be applied to many columns, and many rules can be applied to the same column. You can view the trend pattern of each rule by viewing the Trend line in the Schema pane.

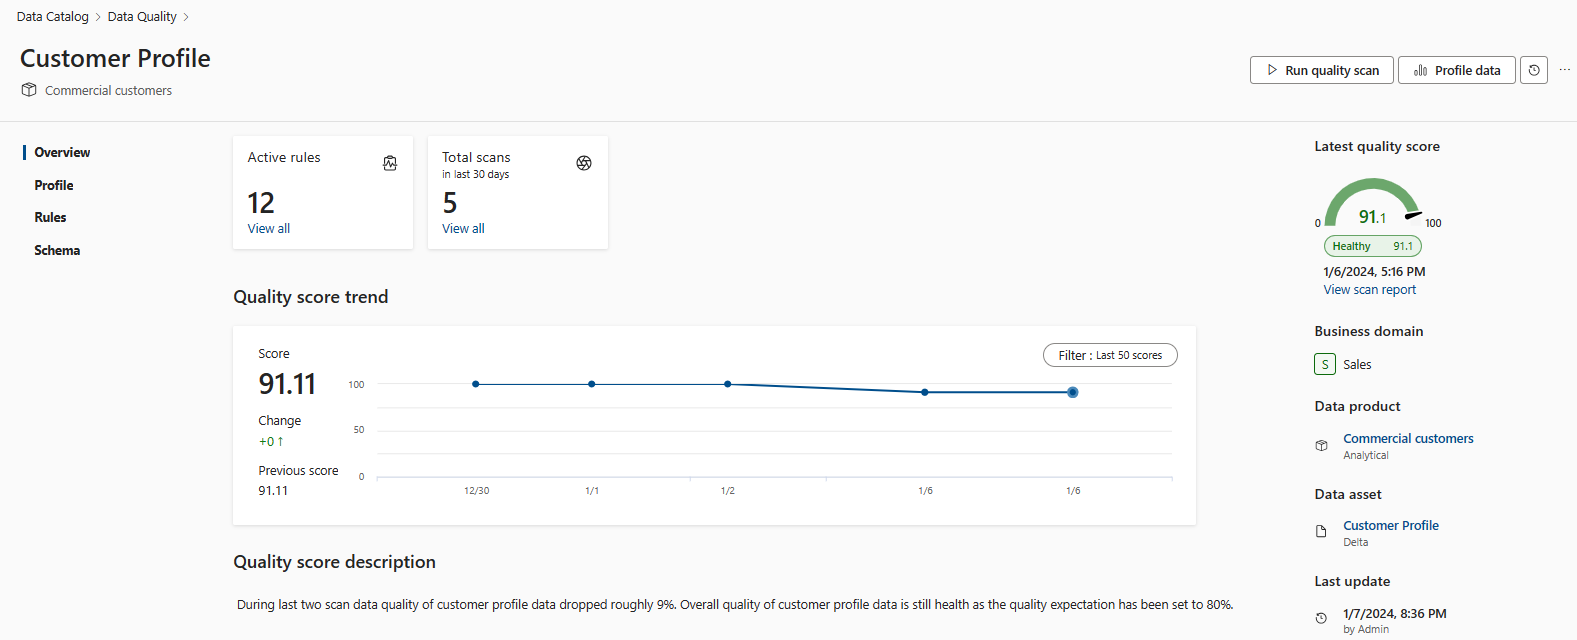
Asset level data quality score trends are available for the last 50 runs. This quality score trend helps data quality stewards to monitor data quality trend and fluctuations month over month. Data quality can also trigger alerts for every data quality scan if the quality score doesn't meet the threshold or business expectation.
Global score is the average of all the production rule defined on the asset. The asset level global score is also rolled up to the data product level and governance domain level. The global score is intended to be the official definition of the state of the data asset, data product, and governance domain in context of quality of data.
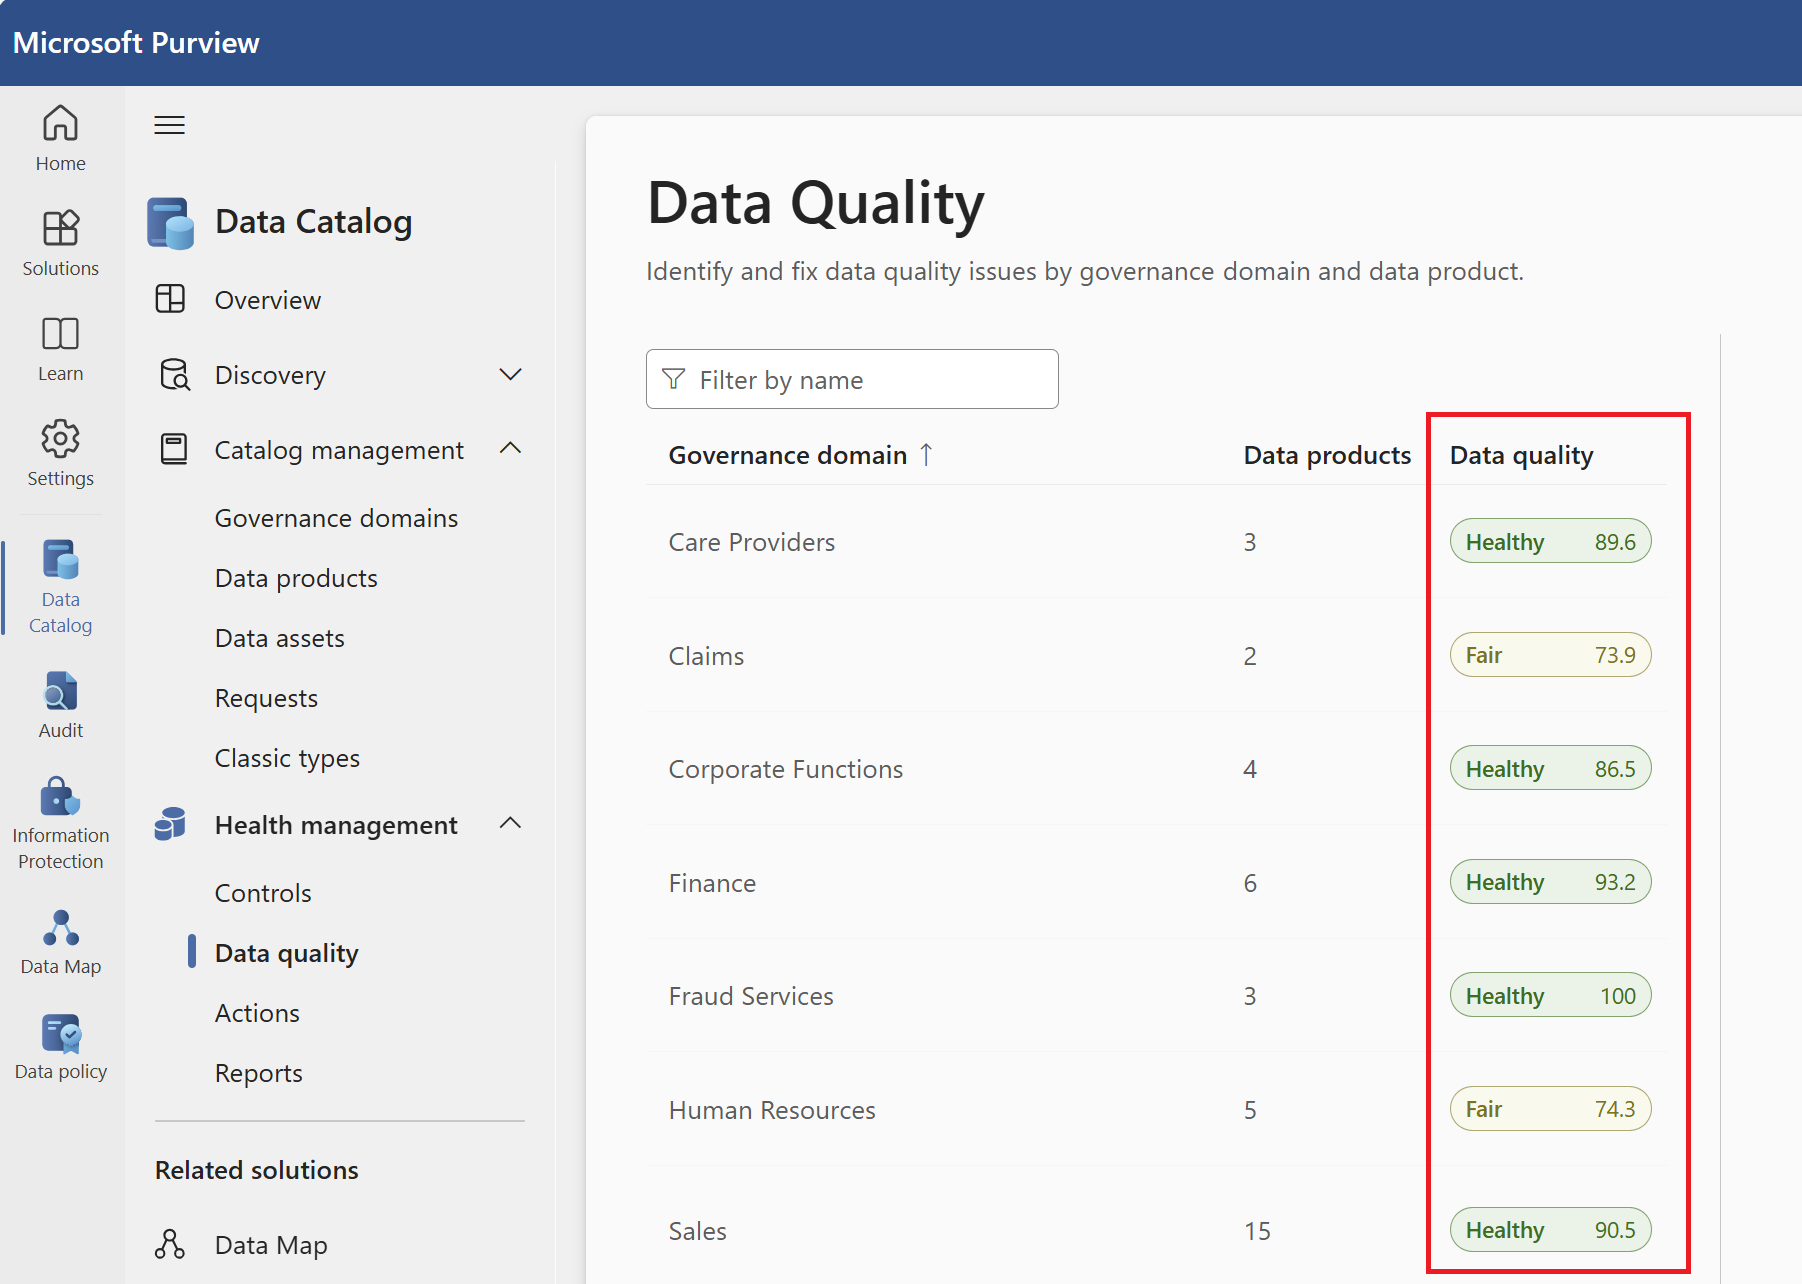
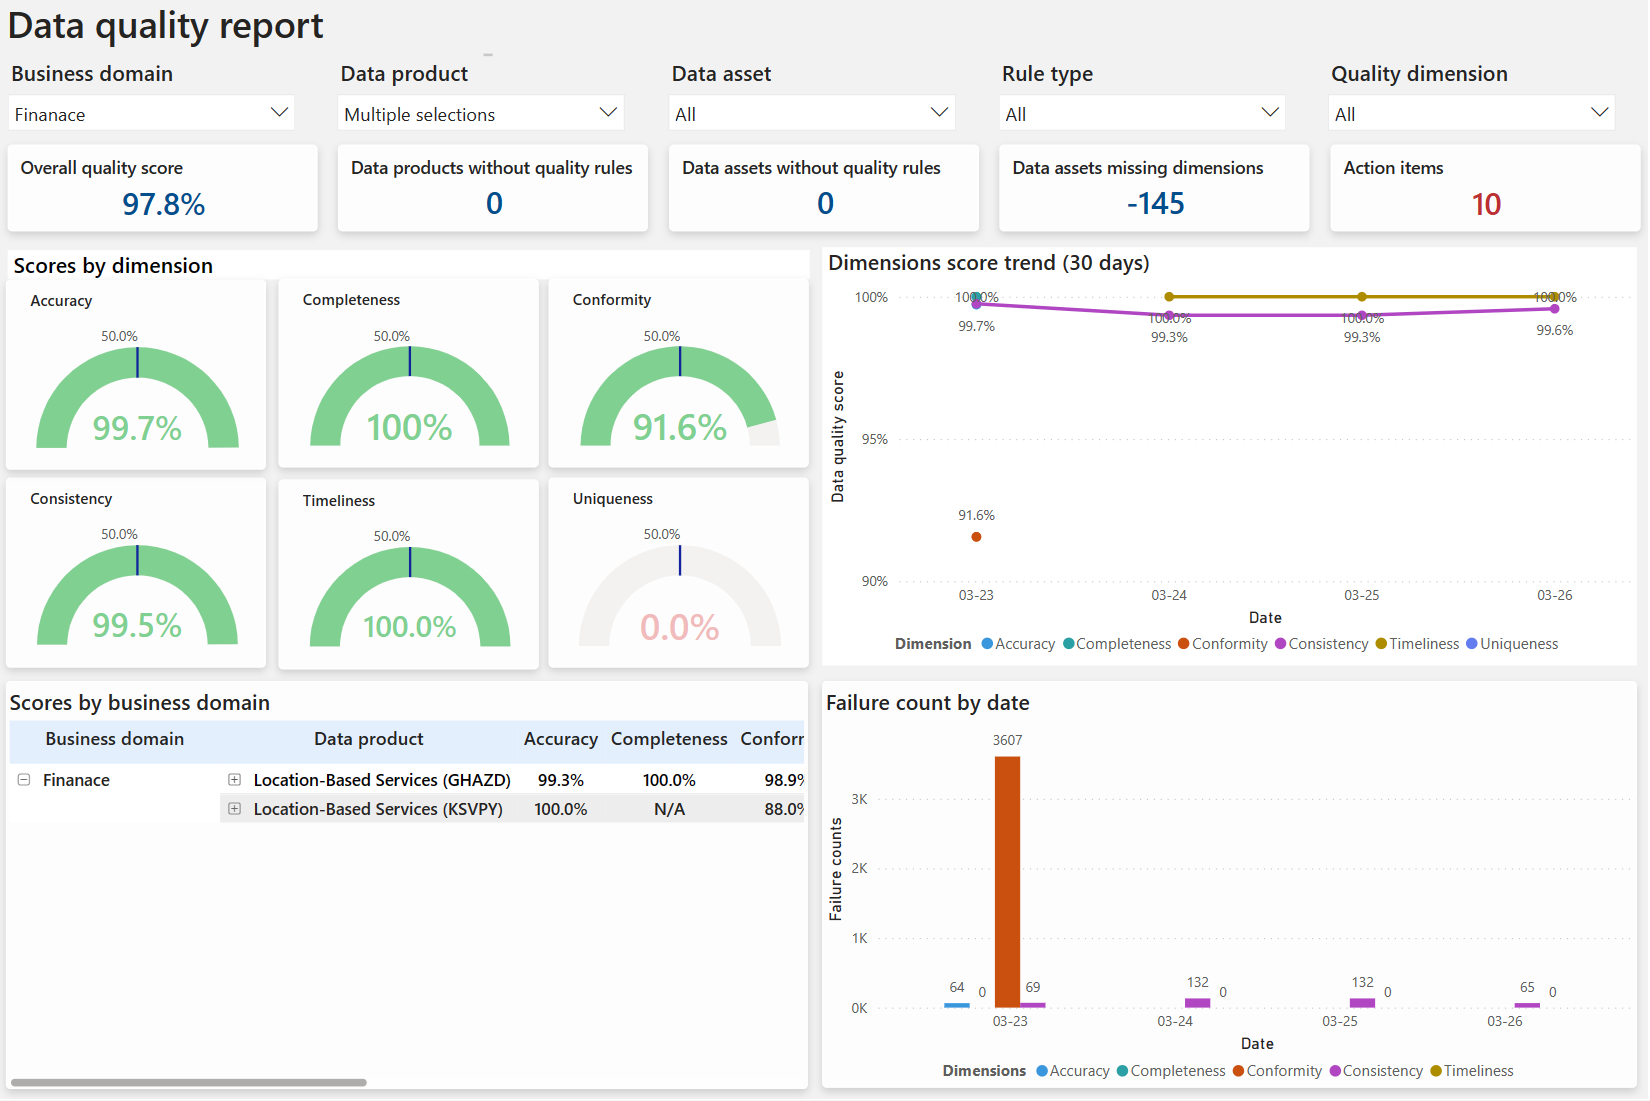
A summary report is created for data quality dimension. This report contains data quality score for each data quality dimension. Global score for the governance domain is published also in this report. You can browse the quality score for each governance domain, data product, and data asset from this Power BI report.
Note
- Data quality dimensions are recognized terms used by data practitioners to describe a feature of data that can be measured or assessed against defined standards in order to quantify the quality level of data used to run a business.
- The data quality score for an asset is the arithmetic average of the scores of the rules applied to its columns.
- The data quality score for a data product is the arithmetic average of the data quality scores of the data assets associated with that data product.
- The data quality score for a governance domain is the arithmetic average of the data quality scores of the data products associated with that domain.
