Create custom views of C++ objects in the debugger using the Natvis framework
Applies to: ![]() Visual Studio
Visual Studio ![]() Visual Studio for Mac
Visual Studio for Mac
Note
This article applies to Visual Studio 2017. If you're looking for the latest Visual Studio documentation, see Visual Studio documentation. We recommend upgrading to the latest version of Visual Studio. Download it here
The Visual Studio Natvis framework customizes the way native types appear in debugger variable windows, such as the Locals and Watch windows, and in DataTips. Natvis visualizations can help make the types you create more visible during debugging.
Natvis replaces the autoexp.dat file in earlier versions of Visual Studio with XML syntax, better diagnostics, versioning, and multiple file support.
Note
Natvis customizations work with classes and structs, but not typedefs.
Natvis visualizations
You use the Natvis framework to create visualization rules for the types you create, so that developers can see them more easily during debugging.
For example, the following illustration shows a variable of type Windows::UI::Xaml::Controls::TextBox in a debugger window without any custom visualizations applied.
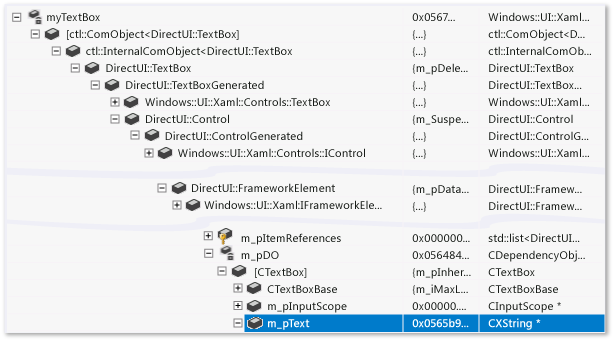
The highlighted row shows the Text property of the TextBox class. The complex class hierarchy makes it difficult to find this property. The debugger doesn't know how to interpret the custom string type, so you can't see the string held inside the textbox.
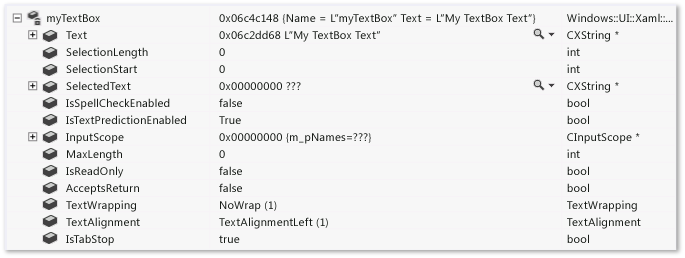
The same TextBox looks much simpler in the variable window when Natvis custom visualizer rules are applied. The important members of the class appear together, and the debugger shows the underlying string value of the custom string type.
Use .natvis files in C++ projects
Natvis uses .natvis files to specify visualization rules. A .natvis file is an XML file with a .natvis extension. The Natvis schema is defined in <VS Installation Folder>\Xml\Schemas\1033\natvis.xsd.
The basic structure of a .natvis file is one or more Type elements representing visualization entries. The fully qualified name of each Type element is specified in its Name attribute.
<?xml version="1.0" encoding="utf-8"?>
<AutoVisualizer xmlns="http://schemas.microsoft.com/vstudio/debugger/natvis/2010">
  <Type Name="MyNamespace::CFoo">
    .
    .
  </Type>

  <Type Name="...">
    .
    .
  </Type>
</AutoVisualizer>
Visual Studio provides some .natvis files in the <VS Installation Folder>\Common7\Packages\Debugger\Visualizers folder. These files have visualization rules for many common types, and can serve as examples for writing visualizations for new types.
Add a .natvis file to a C++ project
You can add a .natvis file to any C++ project.
To add a new .natvis file:
Select the C++ project node in Solution Explorer, and select Project > Add new item, or right-click the project and select Add > New item.
In the Add New Item dialog, select Visual C++ > Utility > Debugger visualization file (.natvis).
Name the file, and select Add.
The new file is added to Solution Explorer, and opens in the Visual Studio document pane.
The Visual Studio debugger loads .natvis files in C++ projects automatically, and by default, also includes them in the .pdb file when the project builds. If you debug the built app, the debugger loads the .natvis file from the .pdb file, even if you don't have the project open. If you don't want the .natvis file included in the .pdb, you can exclude it from the built .pdb file.
To exclude a .natvis file from a .pdb:
Select the .natvis file in Solution Explorer, and select the Properties icon, or right-click the file and select Properties.
Drop down the arrow next to Excluded From Build and select Yes, and then select OK.
Note
For debugging executable projects, use the solution items to add any .natvis files that are not in the .pdb, since there is no C++ project available.
Note
Natvis rules loaded from a .pdb apply only to the types in the modules that the .pdb refers to. For example, if Module1.pdb has a Natvis entry for a type named Test, it only applies to the Test class in Module1.dll. If another module also defines a class named Test, the Module1.pdb Natvis entry does not apply to it.
To install and register a .natvis file via a VSIX package:
A VSIX package can install and register .natvis files. No matter where are they installed, all registered .natvis files are automatically picked up during debugging.
Include the .natvis file in the VSIX package. For example, for the following project file:
<?xml version="1.0" encoding="utf-8"?>
<Project DefaultTargets="Build" xmlns="http://schemas.microsoft.com/developer/msbuild/2003" ToolsVersion="14.0">
  <ItemGroup>
    <VSIXSourceItem Include="Visualizer.natvis" />
  </ItemGroup>
</Project>
Register the .natvis file in the source.extension.vsixmanifest file:
<?xml version="1.0" encoding="utf-8"?>
<PackageManifest Version="2.0.0" xmlns="http://schemas.microsoft.com/developer/vsx-schema/2011" xmlns:d="http://schemas.microsoft.com/developer/vsx-schema-design/2011">
  <Assets>
    <Asset Type="NativeVisualizer" Path="Visualizer.natvis"  />
  </Assets>
</PackageManifest>
Natvis file locations
You can add .natvis files to your user directory or to a system directory, if you want them to apply to multiple projects.
The .natvis files are evaluated in the following order:
Any .natvis files that are embedded in a .pdb you're debugging, unless a file of the same name exists in the loaded project.
Any .natvis files that are in a loaded C++ project or top-level solution. This group includes all loaded C++ projects, including class libraries, but not projects in other languages.
Any .natvis files installed and registered via a VSIX package.
- The user-specific Natvis directory (for example, %USERPROFILE%\Documents\Visual Studio 2017\Visualizers).
- The system-wide Natvis directory (<VS Installation Folder>\Common7\Packages\Debugger\Visualizers). This directory has the .natvis files that are installed with Visual Studio. If you have administrator permissions, you can add files to this directory.
Modify .natvis files while debugging
You can modify a .natvis file in the IDE while debugging its project. Open the file in the same instance of Visual Studio you're debugging with, modify it, and save it. As soon as the file is saved, the Watch and Locals windows update to reflect the change.
You can also add or delete .natvis files in a solution that you're debugging, and Visual Studio adds or removes the relevant visualizations.
You can't update .natvis files that are embedded in .pdb files while you're debugging.
If you modify the .natvis file outside of Visual Studio, the changes don't take effect automatically. To update the debugger windows, you can reevaluate the .natvisreload command in the Immediate window. Then the changes take effect without restarting the debugging session.
Also use the .natvisreload command to upgrade the .natvis file to a newer version. For example, the .natvis file may be checked into source control, and you want to pick up recent changes that somebody else made.
Expressions and formatting
Natvis visualizations use C++ expressions to specify the data items to display. In addition to the enhancements and limitations of C++ expressions in the debugger, which are described in Context operator (C++), be aware of the following:
Natvis expressions are evaluated in the context of the object being visualized, not the current stack frame. For example,
xin a Natvis expression refers to the field named x in the object being visualized, not to a local variable named x in the current function. You can't access local variables in Natvis expressions, although you can access global variables.Natvis expressions don't allow function evaluation or side effects. Function calls and assignment operators are ignored. Because debugger intrinsic functions are side-effect free, they may be freely called from any Natvis expression, even though other function calls are disallowed.
To control how an expression displays, you can use any of the format specifiers described in Format specifiers in C++. Format specifiers are ignored when the entry is used internally by Natvis, such as the
Sizeexpression in a ArrayItems expansion.
Note
Because the natvis document is XML, your expressions cannot directly use the ampersand, greater than, less than, or shift operators. You must escape these characters in both the item body and the condition statements. For example:
<Item Name="HiByte">(byte)(_flags >> 24),x</Item>
<Item Name="HiByteStatus" Condition="(_flags & 0xFF000000) == 0">"None"</Item>
<Item Name="HiByteStatus" Condition="(_flags & 0xFF000000) != 0">"Some"</Item>
Natvis views
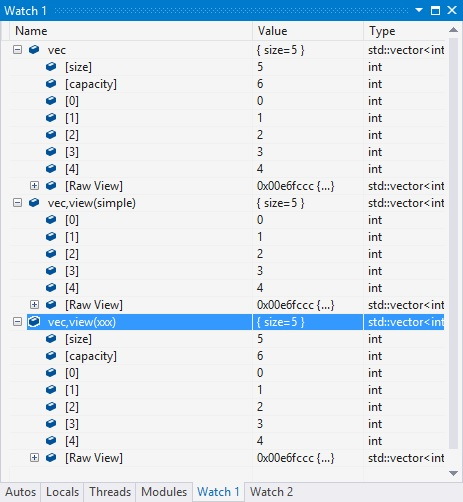
You can define different Natvis views to display types in different ways. For example, here is a visualization of std::vector that defines a simplified view named simple. The DisplayString and the ArrayItems elements show in the default view and the simple view, while the [size] and [capacity] items don't show in the simple view.
<Type Name="std::vector<*>">
<DisplayString>{{ size={_Mylast - _Myfirst} }}</DisplayString>
<Expand>
<Item Name="[size]" ExcludeView="simple">_Mylast - _Myfirst</Item>
<Item Name="[capacity]" ExcludeView="simple">_Myend - _Myfirst</Item>
<ArrayItems>
<Size>_Mylast - _Myfirst</Size>
<ValuePointer>_Myfirst</ValuePointer>
</ArrayItems>
</Expand>
</Type>
In the Watch window, use the ,view format specifier to specify an alternate view. The simple view appears as vec,view(simple):
Natvis errors
When the debugger encounters errors in a visualization entry, it ignores them. It either displays the type in its raw form, or picks another suitable visualization. You can use Natvis diagnostics to understand why the debugger ignored a visualization entry, and to see underlying syntax and parse errors.
To turn on Natvis diagnostics:
- Under Tools > Options (or Debug > Options) > Debugging > Output Window, set Natvis diagnostic messages (C++ only) to Error, Warning, or Verbose, and then select OK.
The errors appear in the Output window.
Natvis syntax reference
AutoVisualizer element
The AutoVisualizer element is the root node of the .natvis file, and contains the namespace xmlns: attribute.
<?xml version="1.0" encoding="utf-8"?>
<AutoVisualizer xmlns="http://schemas.microsoft.com/vstudio/debugger/natvis/2010">
.
.
</AutoVisualizer>
The AutoVisualizer element can have Type, HResult, UIVisualizer, and CustomVisualizer children.
Type element
A basic Type looks like this example:
<Type Name="[fully qualified type name]">
  <DisplayString Condition="[Boolean expression]">[Display value]</DisplayString>
  <Expand>
    ...
  </Expand>
</Type>
The Type element specifies:
What type the visualization should be used for (the
Nameattribute).What the value of an object of that type should look like (the
DisplayStringelement).What the members of the type should look like when the user expands the type in a variable window (the
Expandnode).
Templated classes
The Name attribute of the Type element accepts an asterisk * as a wildcard character that can be used for templated class names.
In the following example, the same visualization is used whether the object is a CAtlArray<int> or a CAtlArray<float>. If there's a specific visualization entry for a CAtlArray<float>, then it takes precedence over the generic one.
<Type Name="ATL::CAtlArray<*>">
<DisplayString>{{Count = {m_nSize}}}</DisplayString>
</Type>
You can reference template parameters in the visualization entry by using macros $T1, $T2, and so forth. To find examples of these macros, see the .natvis files shipped with Visual Studio.
Visualizer type matching
If a visualization entry fails to validate, the next available visualization is used.
Inheritable attribute
The optional Inheritable attribute specifies whether a visualization applies only to a base type, or to a base type and all derived types. The default value of Inheritable is true.
In the following example, the visualization applies only to the BaseClass type:
<Type Name="Namespace::BaseClass" Inheritable="false">
    <DisplayString>{{Count = {m_nSize}}}</DisplayString>
</Type>
Priority attribute
The optional Priority attribute specifies the order in which to use alternate definitions, if a definition fails to parse. The possible values of Priority are: Low, MediumLow,Medium, MediumHigh, and High. The default value is Medium. The Priority attribute distinguishes only among priorities within the same .natvis file.
The following example first parses the entry that matches the 2015 STL. If that fails to parse, it uses the alternate entry for the 2013 version of the STL:
<!-- VC 2013 -->
<Type Name="std::reference_wrapper<*>" Priority="MediumLow">
<DisplayString>{_Callee}</DisplayString>
<Expand>
<ExpandedItem>_Callee</ExpandedItem>
</Expand>
</Type>
<!-- VC 2015 -->
<Type Name="std::reference_wrapper<*>">
<DisplayString>{*_Ptr}</DisplayString>
<Expand>
<Item Name="[ptr]">_Ptr</Item>
</Expand>
</Type>
Optional attribute
You can put an Optional attribute on any node. If a subexpression inside an optional node fails to parse, the debugger ignores that node, but applies the rest of the Type rules. In the following type, [State] is non-optional, but [Exception] is optional. If MyNamespace::MyClass has a field named _M_exceptionHolder, both the [State] node and the [Exception] node appear, but if there's no _M_exceptionHolder field, only the [State] node appears.
<Type Name="MyNamespace::MyClass">
    <Expand>
      <Item Name="[State]">_M_State</Item>
      <Item Name="[Exception]" Optional="true">_M_exceptionHolder</Item>
    </Expand>
</Type>
Condition attribute
The optional Condition attribute is available for many visualization elements, and specifies when to use a visualization rule. If the expression inside the condition attribute resolves to false, the visualization rule doesn't apply. If it evaluates to true, or there is no Condition attribute, the visualization applies. You can use this attribute for if-else logic in the visualization entries.
For example, the following visualization has two DisplayString elements for a smart pointer type. When the _Myptr member is empty, the condition of the first DisplayString element resolves to true, so that form displays. When the _Myptr member is not empty, the condition evaluates to false, and the second DisplayString element displays.
<Type Name="std::auto_ptr<*>">
<DisplayString Condition="_Myptr == 0">empty</DisplayString>
<DisplayString>auto_ptr {*_Myptr}</DisplayString>
<Expand>
<ExpandedItem>_Myptr</ExpandedItem>
</Expand>
</Type>
IncludeView and ExcludeView attributes
The IncludeView and ExcludeView attributes specify elements to display or not display in specific views. For example, in the following Natvis specification of std::vector, the simple view doesn't display the [size] and [capacity] items.
<Type Name="std::vector<*>">
<DisplayString>{{ size={_Mylast - _Myfirst} }}</DisplayString>
<Expand>
<Item Name="[size]" ExcludeView="simple">_Mylast - _Myfirst</Item>
<Item Name="[capacity]" ExcludeView="simple">_Myend - _Myfirst</Item>
<ArrayItems>
<Size>_Mylast - _Myfirst</Size>
<ValuePointer>_Myfirst</ValuePointer>
</ArrayItems>
</Expand>
</Type>
You can use the IncludeView and ExcludeView attributes on types and on individual members.
Version element
The Version element scopes a visualization entry to a specific module and version. The Version element helps avoid name collisions, reduces inadvertent mismatches, and allows different visualizations for different type versions.
If a common header file that is used by different modules defines a type, the versioned visualization appears only when the type is in the specified module version.
In the following example, the visualization is applicable only for the DirectUI::Border type found in the Windows.UI.Xaml.dll from version 1.0 to 1.5.
<Type Name="DirectUI::Border">
  <Version Name="Windows.UI.Xaml.dll" Min="1.0" Max="1.5"/>
  <DisplayString>{{Name = {*(m_pDO->m_pstrName)}}}</DisplayString>
  <Expand>
    <ExpandedItem>*(CBorder*)(m_pDO)</ExpandedItem>
  </Expand>
</Type>
You don't need both Min and Max. They are optional attributes. No wildcard characters are supported.
The Name attribute is in the format filename.ext, such as hello.exe or some.dll. No path names are allowed.
DisplayString element
The DisplayString element specifies a string to show as the value of a variable. It accepts arbitrary strings mixed with expressions. Everything inside curly braces is interpreted as an expression. For instance, the following DisplayString entry:
<Type Name="CPoint">
  <DisplayString>{{x={x} y={y}}}</DisplayString>
</Type>
Means that variables of type CPoint display as in this illustration:

In the DisplayString expression, x and y, which are members of CPoint, are inside curly braces, so their values are evaluated. The example also shows how you can escape a curly brace by using double curly braces ( {{ or }} ).
Note
The DisplayString element is the only element that accepts arbitrary strings and curly brace syntax. All other visualization elements accept only expressions that the debugger can evaluate.
StringView element
The StringView element defines a value that the debugger can send to the built-in text visualizer. For example, given the following visualization for the ATL::CStringT type:
<Type Name="ATL::CStringT<wchar_t,*>">
<DisplayString>{m_pszData,su}</DisplayString>
</Type>
The CStringT object displays in a variable window like this example:

Adding a StringView element tells the debugger it can display the value as a text visualization.
<Type Name="ATL::CStringT<wchar_t,*>">
<DisplayString>{m_pszData,su}</DisplayString>
<StringView>m_pszData,su</StringView>
</Type>
During debugging, you can select the magnifying glass icon next to the variable, and then select Text Visualizer to display the string that m_pszData points to.

The expression {m_pszData,su} includes a C++ format specifier su, to display the value as a Unicode string. For more information, see Format specifiers in C++.
Expand element
The optional Expand node customizes the children of a visualized type when you expand the type in a variable window. The Expand node accepts a list of child nodes that define the child elements.
If an
Expandnode isn't specified in a visualization entry, the children use the default expansion rules.If an
Expandnode is specified with no child nodes under it, the type isn't expandable in the debugger windows.
Item expansion
The Item element is the most basic and common element in an Expand node. Item defines a single child element. For example, a CRect class with fields top, left, right, and bottom has the following visualization entry:
<Type Name="CRect">
  <DisplayString>{{top={top} bottom={bottom} left={left} right={right}}}</DisplayString>
  <Expand>
    <Item Name="Width">right - left</Item>
    <Item Name="Height">bottom - top</Item>
  </Expand>
</Type>
In the debugger window, the CRect type looks like this example:
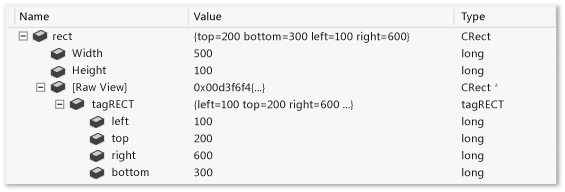
The debugger evaluates the expressions specified in the Width and Height elements, and shows the values in the Value column of the variable window.
The debugger automatically creates the [Raw View] node for every custom expansion. The preceding screenshot displays the [Raw View] node expanded, to show how the default raw view of the object differs from its Natvis visualization. The default expansion creates a subtree for the base class, and lists all the data members of the base class as children.
Note
If the expression of the item element points to a complex type, the Item node itself is expandable.
ArrayItems expansion
Use the ArrayItems node to have the Visual Studio debugger interpret the type as an array and display its individual elements. The visualization for std::vector is a good example:
<Type Name="std::vector<*>">
<DisplayString>{{size = {_Mylast - _Myfirst}}}</DisplayString>
<Expand>
<Item Name="[size]">_Mylast - _Myfirst</Item>
<Item Name="[capacity]">(_Myend - _Myfirst)</Item>
<ArrayItems>
<Size>_Mylast - _Myfirst</Size>
<ValuePointer>_Myfirst</ValuePointer>
</ArrayItems>
</Expand>
</Type>
A std::vector shows its individual elements when expanded in the variable window:

The ArrayItems node must have:
- A
Sizeexpression (which must evaluate to an integer) for the debugger to understand the length of the array. - A
ValuePointerexpression that points to the first element (which must be a pointer of an element type that is notvoid*).
The default value of the array lower bound is 0. To override the value, use a LowerBound element. The .natvis files shipped with Visual Studio have examples.
Note
You can use the [] operator, for example vector[i], with any single-dimensional array visualization that uses ArrayItems, even if the type itself (for example CATLArray) does not allow this operator.
You can also specify multi-dimensional arrays. In that case, the debugger needs slightly more information to properly display child elements:
<Type Name="Concurrency::array<*,*>">
<DisplayString>extent = {_M_extent}</DisplayString>
<Expand>
<Item Name="extent">_M_extent</Item>
<ArrayItems Condition="_M_buffer_descriptor._M_data_ptr != 0">
<Direction>Forward</Direction>
<Rank>$T2</Rank>
<Size>_M_extent._M_base[$i]</Size>
<ValuePointer>($T1*) _M_buffer_descriptor._M_data_ptr</ValuePointer>
</ArrayItems>
</Expand>
</Type>
Directionspecifies whether the array is in row-major or column-major order.Rankspecifies the rank of the array.- The
Sizeelement accepts the implicit$iparameter, which it substitutes with the dimension index to find the length of the array in that dimension. In the previous example, the expression_M_extent.M_base[0]should give the length of the 0th dimension,_M_extent._M_base[1]the 1st, and so on.
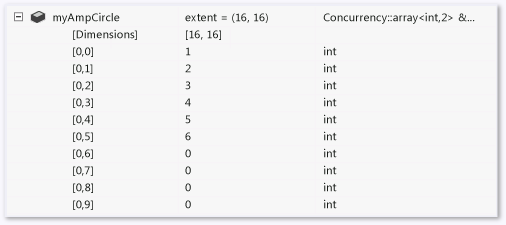
Here's how a two-dimensional Concurrency::array object looks in the debugger window:
IndexListItems expansion
You can use ArrayItems expansion only if the array elements are laid out contiguously in memory. The debugger gets to the next element by simply incrementing its pointer. If you need to manipulate the index to the value node, use IndexListItems nodes. Here's a visualization with an IndexListItems node:
<Type Name="Concurrency::multi_link_registry<*>">
<DisplayString>{{size = {_M_vector._M_index}}}</DisplayString>
<Expand>
<Item Name="[size]">_M_vector._M_index</Item>
<IndexListItems>
<Size>_M_vector._M_index</Size>
<ValueNode>*(_M_vector._M_array[$i])</ValueNode>
</IndexListItems>
</Expand>
</Type>
The only difference between ArrayItems and IndexListItems is the ValueNode, which expects the full expression to the ith element with the implicit $i parameter.
Note
You can use the [] operator, for example vector[i], with any single-dimensional array visualization that uses IndexListItems, even if the type itself (for example CATLArray) does not allow this operator.
LinkedListItems expansion
If the visualized type represents a linked list, the debugger can display its children by using a LinkedListItems node. The following visualization for the CAtlList type uses LinkedListItems:
<Type Name="ATL::CAtlList<*,*>">
<DisplayString>{{Count = {m_nElements}}}</DisplayString>
<Expand>
<Item Name="Count">m_nElements</Item>
<LinkedListItems>
<Size>m_nElements</Size>
<HeadPointer>m_pHead</HeadPointer>
<NextPointer>m_pNext</NextPointer>
<ValueNode>m_element</ValueNode>
</LinkedListItems>
</Expand>
</Type>
The Size element refers to the length of the list. HeadPointer points to the first element, NextPointer refers to the next element, and ValueNode refers to the value of the item.
The debugger evaluates the NextPointer and ValueNode expressions in the context of the LinkedListItems node element, not the parent list type. In the preceding example, CAtlList has a CNode class (found in atlcoll.h) that is a node of the linked list. m_pNext and m_element are fields of that CNode class, not of the CAtlList class.
ValueNode can be left empty, or use this to refer to the LinkedListItems node itself.
CustomListItems expansion
The CustomListItems expansion allows you to write custom logic for traversing a data structure such as a hashtable. Use CustomListItems to visualize data structures that can use C++ expressions for everything you need to evaluate, but don't quite fit the mold for ArrayItems, IndexListItems, or LinkedListItems.
You can use Exec to execute code inside of a CustomListItems expansion, using the variables and objects defined in the expansion. You can use logical operators, arithmetic operators, and assignment operators with Exec. You can't use Exec to evaluate functions, except for debugger intrinsic functions supported by the C++ expression evaluator.
The following visualizer for CAtlMap is an excellent example where CustomListItems is appropriate.
<Type Name="ATL::CAtlMap<*,*,*,*>">
<AlternativeType Name="ATL::CMapToInterface<*,*,*>"/>
<AlternativeType Name="ATL::CMapToAutoPtr<*,*,*>"/>
<DisplayString>{{Count = {m_nElements}}}</DisplayString>
<Expand>
<CustomListItems MaxItemsPerView="5000" ExcludeView="Test">
<Variable Name="iBucket" InitialValue="-1" />
<Variable Name="pBucket" InitialValue="m_ppBins == nullptr ? nullptr : *m_ppBins" />
<Variable Name="iBucketIncrement" InitialValue="-1" />
<Size>m_nElements</Size>
<Exec>pBucket = nullptr</Exec>
<Loop>
<If Condition="pBucket == nullptr">
<Exec>iBucket++</Exec>
<Exec>iBucketIncrement = __findnonnull(m_ppBins + iBucket, m_nBins - iBucket)</Exec>
<Break Condition="iBucketIncrement == -1" />
<Exec>iBucket += iBucketIncrement</Exec>
<Exec>pBucket = m_ppBins[iBucket]</Exec>
</If>
<Item>pBucket,na</Item>
<Exec>pBucket = pBucket->m_pNext</Exec>
</Loop>
</CustomListItems>
</Expand>
</Type>
TreeItems expansion
If the visualized type represents a tree, the debugger can walk the tree and display its children by using a TreeItems node. Here's the visualization for the std::map type using a TreeItems node:
<Type Name="std::map<*>">
<DisplayString>{{size = {_Mysize}}}</DisplayString>
<Expand>
<Item Name="[size]">_Mysize</Item>
<Item Name="[comp]">comp</Item>
<TreeItems>
<Size>_Mysize</Size>
<HeadPointer>_Myhead->_Parent</HeadPointer>
<LeftPointer>_Left</LeftPointer>
<RightPointer>_Right</RightPointer>
<ValueNode Condition="!((bool)_Isnil)">_Myval</ValueNode>
</TreeItems>
</Expand>
</Type>
The syntax is similar to the LinkedListItems node. LeftPointer, RightPointer, and ValueNode are evaluated under the context of the tree node class. ValueNode can be left empty or use this to refer to the TreeItems node itself.
ExpandedItem expansion
The ExpandedItem element generates an aggregated child view by displaying properties of base classes or data members as if they were children of the visualized type. The debugger evaluates the specified expression, and appends the child nodes of the result to the child list of the visualized type.
For example, the smart pointer type auto_ptr<vector<int>> typically displays as:

To see the values of the vector, you have to drill down two levels in the variable window, passing through the _Myptr member. By adding an ExpandedItem element, you can eliminate the _Myptr variable from the hierarchy and directly view the vector elements:
<Type Name="std::auto_ptr<*>">
<DisplayString>auto_ptr {*_Myptr}</DisplayString>
<Expand>
<ExpandedItem>_Myptr</ExpandedItem>
</Expand>
</Type>

The following example shows how to aggregate properties from the base class in a derived class. Suppose the CPanel class derives from CFrameworkElement. Instead of repeating the properties that come from the base CFrameworkElement class, the ExpandedItem node visualization appends those properties to the child list of the CPanel class.
<Type Name="CPanel">
  <DisplayString>{{Name = {*(m_pstrName)}}}</DisplayString>
  <Expand>
    <Item Name="IsItemsHost">(bool)m_bItemsHost</Item>
    <ExpandedItem>*(CFrameworkElement*)this,nd</ExpandedItem>
  </Expand>
</Type>
The nd format specifier, which turns off visualization matching for the derived class, is necessary here. Otherwise, the expression *(CFrameworkElement*)this would cause the CPanel visualization to be applied again, because the default visualization type matching rules consider it the most appropriate one. Use the nd format specifier to instruct the debugger to use the base class visualization, or the default expansion if the base class has no visualization.
Synthetic item expansion
While the ExpandedItem element provides a flatter view of data by eliminating hierarchies, the Synthetic node does the opposite. It allows you to create an artificial child element that isn't a result of an expression. The artificial element can have child elements of its own. In the following example, the visualization for the Concurrency::array type uses a Synthetic node to show a diagnostic message to the user:
<Type Name="Concurrency::array<*,*>">
<DisplayString>extent = {_M_extent}</DisplayString>
<Expand>
<Item Name="extent" Condition="_M_buffer_descriptor._M_data_ptr == 0">_M_extent</Item>
<ArrayItems Condition="_M_buffer_descriptor._M_data_ptr != 0">
<Rank>$T2</Rank>
<Size>_M_extent._M_base[$i]</Size>
<ValuePointer>($T1*) _M_buffer_descriptor._M_data_ptr</ValuePointer>
</ArrayItems>
<Synthetic Name="Array" Condition="_M_buffer_descriptor._M_data_ptr == 0">
<DisplayString>Array members can be viewed only under the GPU debugger</DisplayString>
</Synthetic>
</Expand>
</Type>

HResult element
The HResult element lets you customize the information shown for an HRESULT in debugger windows. The HRValue element must contain the 32-bit value of the HRESULT that is to be customized. The HRDescription element contains the information to show in the debugger window.
<HResult Name="MY_E_COLLECTION_NOELEMENTS">
  <HRValue>0xABC0123</HRValue>
  <HRDescription>No elements in the collection.</HRDescription>
</HResult>
UIVisualizer element
A UIVisualizer element registers a graphical visualizer plug-in with the debugger. A graphical visualizer creates a dialog box or other interface that shows a variable or object in a way consistent with its data type. The visualizer plug-in must be authored as a VSPackage, and must expose a service that the debugger can consume. The .natvis file contains registration information for the plug-in, such as its name, the GUID of the exposed service, and the types it can visualize.
Here's an example of a UIVisualizer element:
<?xml version="1.0" encoding="utf-8"?>
<AutoVisualizer xmlns="http://schemas.microsoft.com/vstudio/debugger/natvis/2010">
    <UIVisualizer ServiceId="{5452AFEA-3DF6-46BB-9177-C0B08F318025}"
        Id="1" MenuName="Vector Visualizer"/>
    <UIVisualizer ServiceId="{5452AFEA-3DF6-46BB-9177-C0B08F318025}"
        Id="2" MenuName="List Visualizer"/>
.
.
</AutoVisualizer>
A
ServiceId-Idattribute pair identifies aUIVisualizer. TheServiceIdis the GUID of the service the visualizer package exposes.Idis a unique identifier that differentiates visualizers, if a service provides more than one. In the preceding example, the same visualizer service provides two visualizers.The
MenuNameattribute defines a visualizer name to display in the drop-down next to the magnifying glass icon in the debugger. For example:
Each type defined in the .natvis file must explicitly list any UI visualizers that can display it. The debugger matches the visualizer references in the type entries with the registered visualizers. For example, the following type entry for std::vector references the UIVisualizer in the preceding example.
<Type Name="std::vector<int,*>">
<UIVisualizer ServiceId="{5452AFEA-3DF6-46BB-9177-C0B08F318025}" Id="1" />
</Type>
You can see an example of a UIVisualizer in the Image Watch extension used to view in-memory bitmaps.
CustomVisualizer element
CustomVisualizer is an extensibility point that specifies a VSIX extension that you write to control visualizations in Visual Studio code. For more information about writing VSIX extensions, see the Visual Studio SDK.
It's a lot more work to write a custom visualizer than an XML Natvis definition, but you're free from constraints about what Natvis does or doesn't support. Custom visualizers have access to the full set of debugger extensibility APIs, which can query and modify the debuggee process or communicate with other parts of Visual Studio.
You can use the Condition, IncludeView, and ExcludeView attributes on CustomVisualizer elements.
Limitations
Natvis customizations work with classes and structs, but not typedefs.
Natvis does not support visualizers for primitive types (for example, int, bool) or for pointers to primitive types. In this scenario, one option is to use the format specifier appropriate to your use case. For example, if you use double* mydoublearray in your code, then you can use an array format specifier in the debugger's Watch window, such as the expression mydoublearray, [100], which shows the first 100 elements.